August 5, 2026 - Q2 2026 net product sales of $176 million - 2026 net product sales guidance increased to $680 million to $700 million - Volixibat granted Breakthrough Therapy and Orphan Drug Designations for cholestatic pruritus due to PSC - Pre-NDA…
August 5, 2026
- Q2 2026 net product sales of $176 million
- 2026 net product sales guidance increased to $680 million to $700 million
- Volixibat granted Breakthrough Therapy and Orphan Drug Designations for cholestatic pruritus due to PSC
- Pre-NDA meeting held for volixibat in cholestatic pruritus due to PSC; additional discussions planned before potential NDA submission, now targeted in H1 2027
- Enrollment completed in VANTAGE study of volixibat in cholestatic pruritus due to PBC; data expected Q1 2027
- Conference call to provide business updates today, August 5 at 1:30 p.m. PT / 4:30 p.m. ET
FOSTER CITY, Calif.--(BUSINESS WIRE)-- Mirum Pharmaceuticals, Inc. (Nasdaq: MIRM), a leading rare disease company, today reported financial results for the second quarter 2026 and provided a business update.
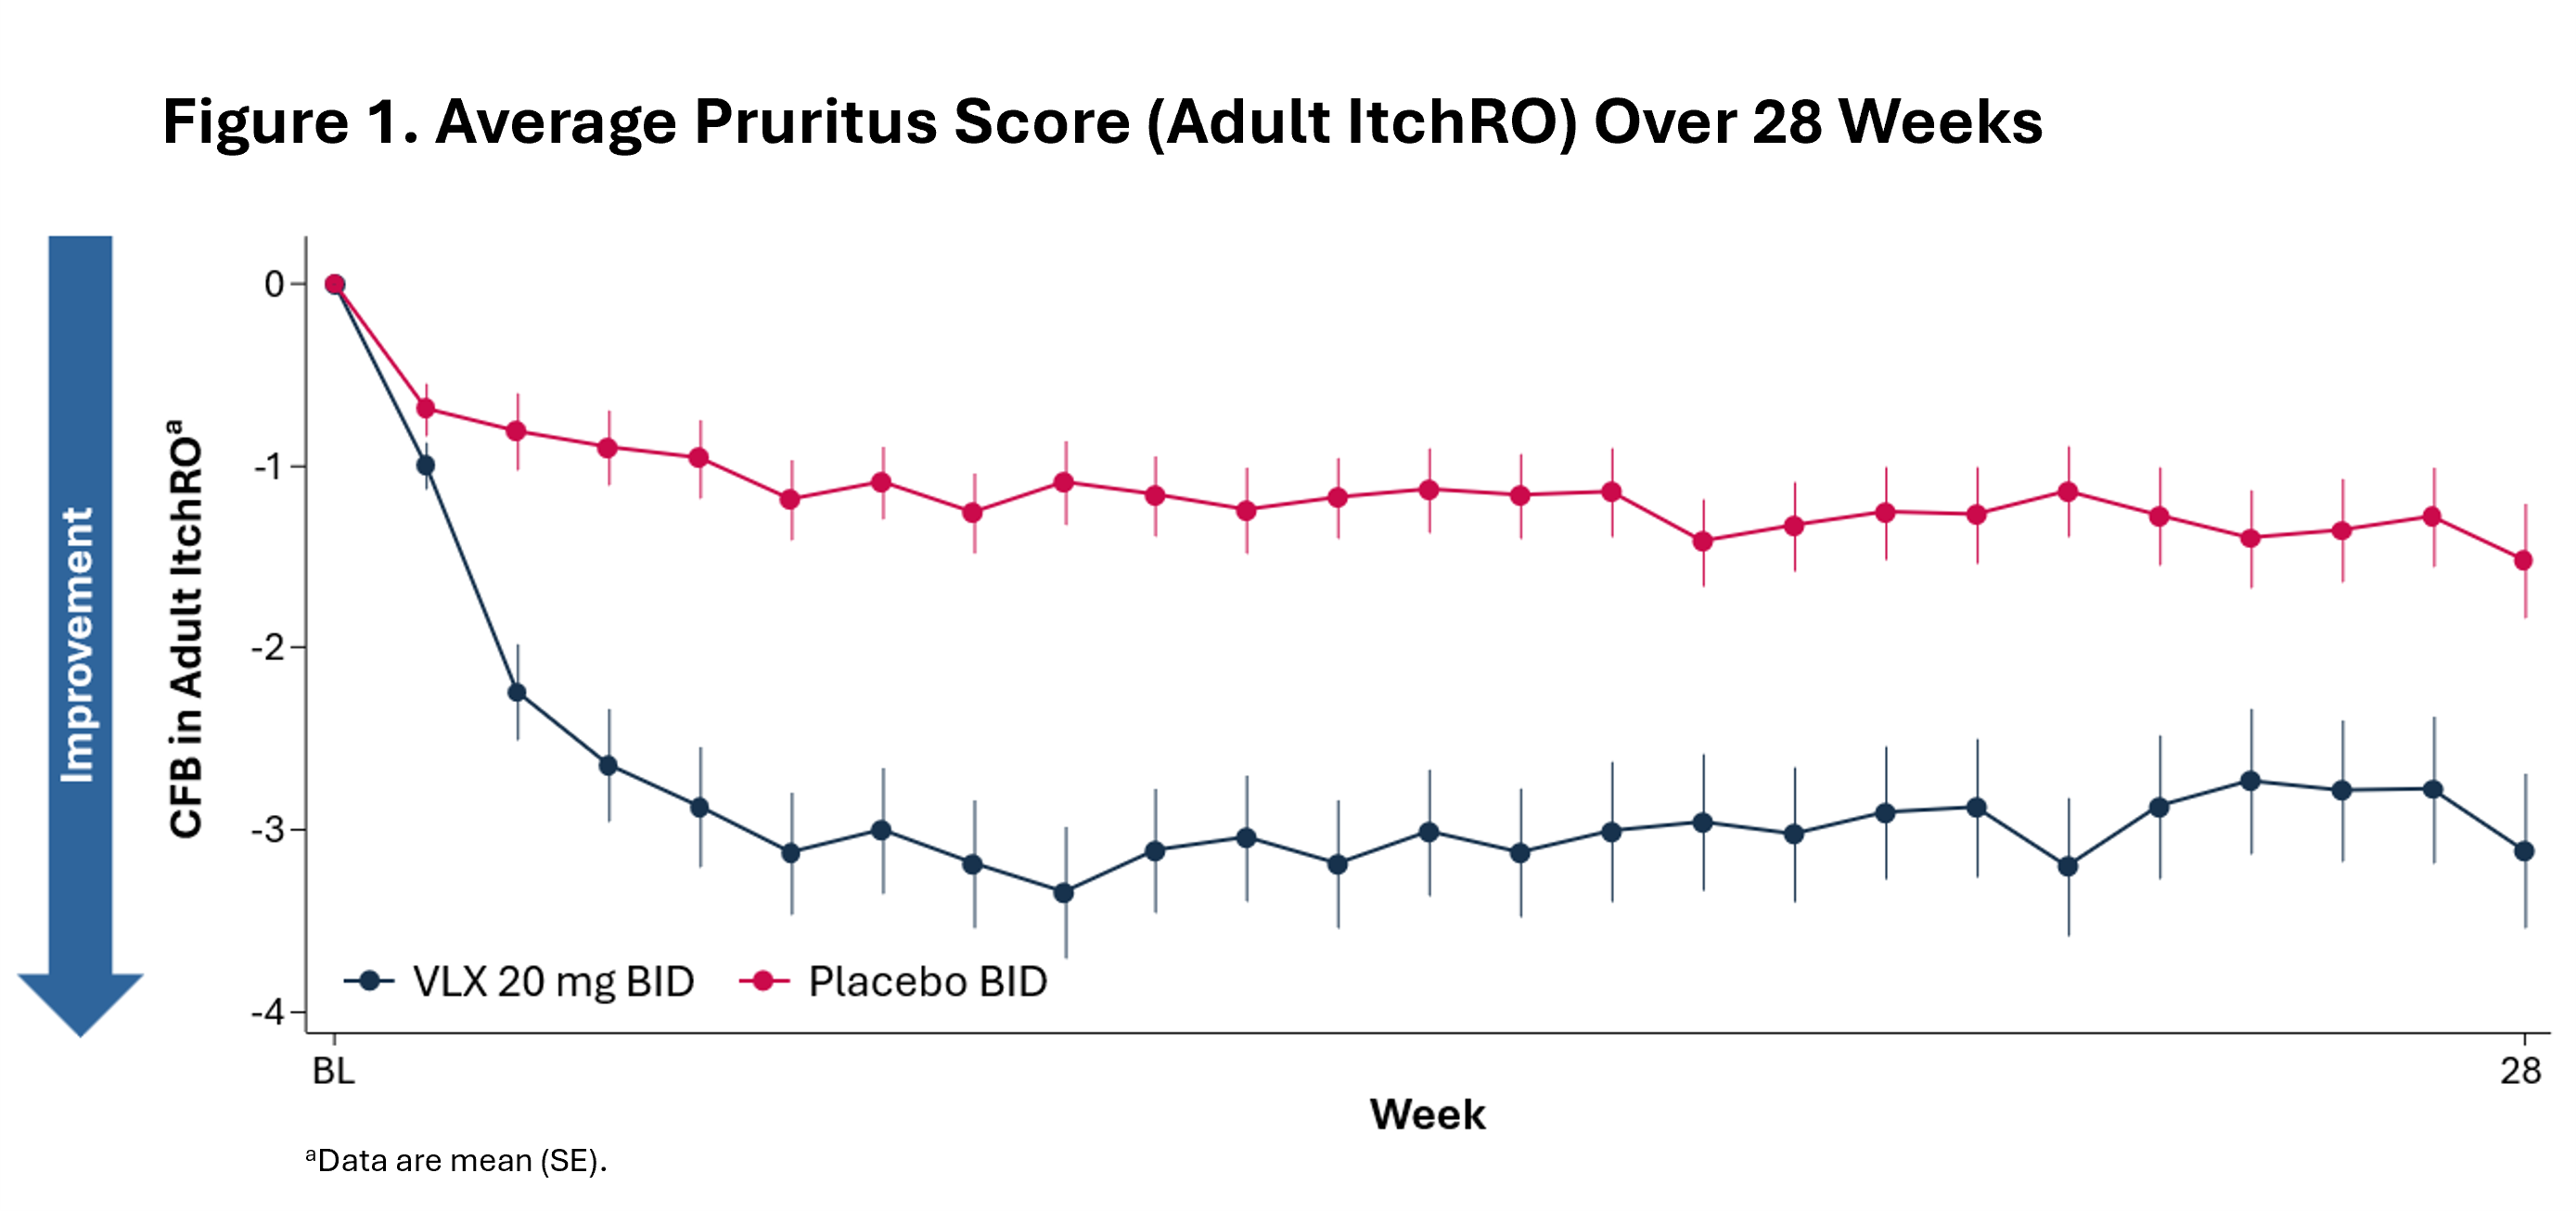
“Mirum delivered another strong quarter, with continued commercial momentum supporting an increase to our full-year net product sales guidance and launch readiness for the upcoming potential approval of zilurgisertib,” said Chris Peetz, Chief Executive Officer of Mirum. “The FDA’s decision to grant volixibat Breakthrough Therapy and Orphan Drug Designations underscores the strength of the VISTAS efficacy data and the serious unmet need in PSC. VISTAS was designed with FDA input as a pivotal study and met its primary endpoint with highly significant results. However, at our recent pre-NDA meeting, the agency recommended conducting a Phase 3 study. We intend to hold further discussions with the FDA before a potential NDA submission in the first half of 2027 based on VISTAS.”
Q2 and Recent Highlights
Commercial: Raising Full Year Net Product Sales Guidance to $680 Million to $700 Million
- Second quarter 2026 global net product sales of $176.2 million.
- Second quarter 2026 LIVMARLI® net product sales were $128.7 million, representing 46% growth over second quarter 2025 net product sales.
- Second quarter 2026 Bile Acid Medicines net product sales were $47.5 million, representing 20% growth over second quarter 2025 net product sales.
Regulatory and Pipeline: Advancing Toward Multiple Milestones
- U.S. FDA granted volixibat Breakthrough Therapy Designation for the treatment of cholestatic pruritus due to primary sclerosing cholangitis (PSC) and Orphan Drug Designation for PSC.
- Participated in pre-NDA meeting with U.S. FDA for volixibat in cholestatic pruritus due to PSC; planning additional discussions with the FDA before potential NDA submission, now targeted in H1 2027.
- Brelovitug AZURE-1 and AZURE-4 Phase 3 studies in chronic hepatitis delta virus (HDV) topline results expected in Q3 and Q4 2026, respectively.
- LIVMARLI EXPAND Phase 3 study in cholestatic pruritus due to additional rare cholestatic conditions topline results expected in Q4 2026.
- Completed enrollment in the volixibat VANTAGE Phase 2b study in cholestatic pruritus due to primary biliary cholangitis (PBC); topline results expected in Q1 2027.
- Presented positive pivotal Phase 2 results from the PROGRESS study of zilurgisertib in fibrodysplasia ossificans progressiva (FOP) at ENDO 2026; Prescription Drug User Fee Act (PDUFA) target action date for the zilurgisertib NDA is September 26, 2026.
Corporate & Financial: Strong Balance Sheet and Financial Independence
- Total revenue for the quarter ended June 30, 2026 was $176.2 million compared to $127.8 million for the quarter ended June 30, 2025.
- Total operating expenses were $218.8 million for the quarter ended June 30, 2026 compared to $132.8 million for the quarter ended June 30, 2025. Total operating expenses for the quarter ended June 30, 2026 included:
- Cost of sales of $23.2 million, excluding intangible amortization and stock-based compensation expense.
- Non-recurring acquired in-process research and development (IPR&D) expense associated with the exclusive license of worldwide rights to zilurgisertib of $16.4 million.
- Research and development expense of $76.3 million, including $28.8 million for the development of brelovitug, excluding stock-based compensation expense.
- Selling, general, and administrative expense of $65.6 million, excluding stock-based compensation expense.
- $37.3 million of stock-based compensation, intangible amortization, and other non-cash expenses.
- Issued $690.0 million aggregate principal amount of 0.00% convertible senior notes due 2032.
- Settled $237.2 million aggregate principal amount of 4.00% convertible senior notes due 2029, which represented approximately 75% of the then-outstanding notes.
- As of June 30, 2026, Mirum had unrestricted cash, cash equivalents, and investments of $561.3 million compared to $391.4 million as of December 31, 2025.
Business Update Conference Call
Mirum will host a conference call today, August 5 at 1:30 p.m. PT / 4:30 p.m. ET, to provide business updates. Join the call using the following details:
Conference Call Details:
US/Toll-Free: + 1 833 461 5787
International: +1 585 542 9983
Access Code: 789239699
You may also access the call via webcast by visiting the Investors
section of Mirum’s corporate website. The archived webcast will be available for replay.
About LIVMARLI® (maralixibat) oral solution and LIVMARLI® (maralixibat) tablets
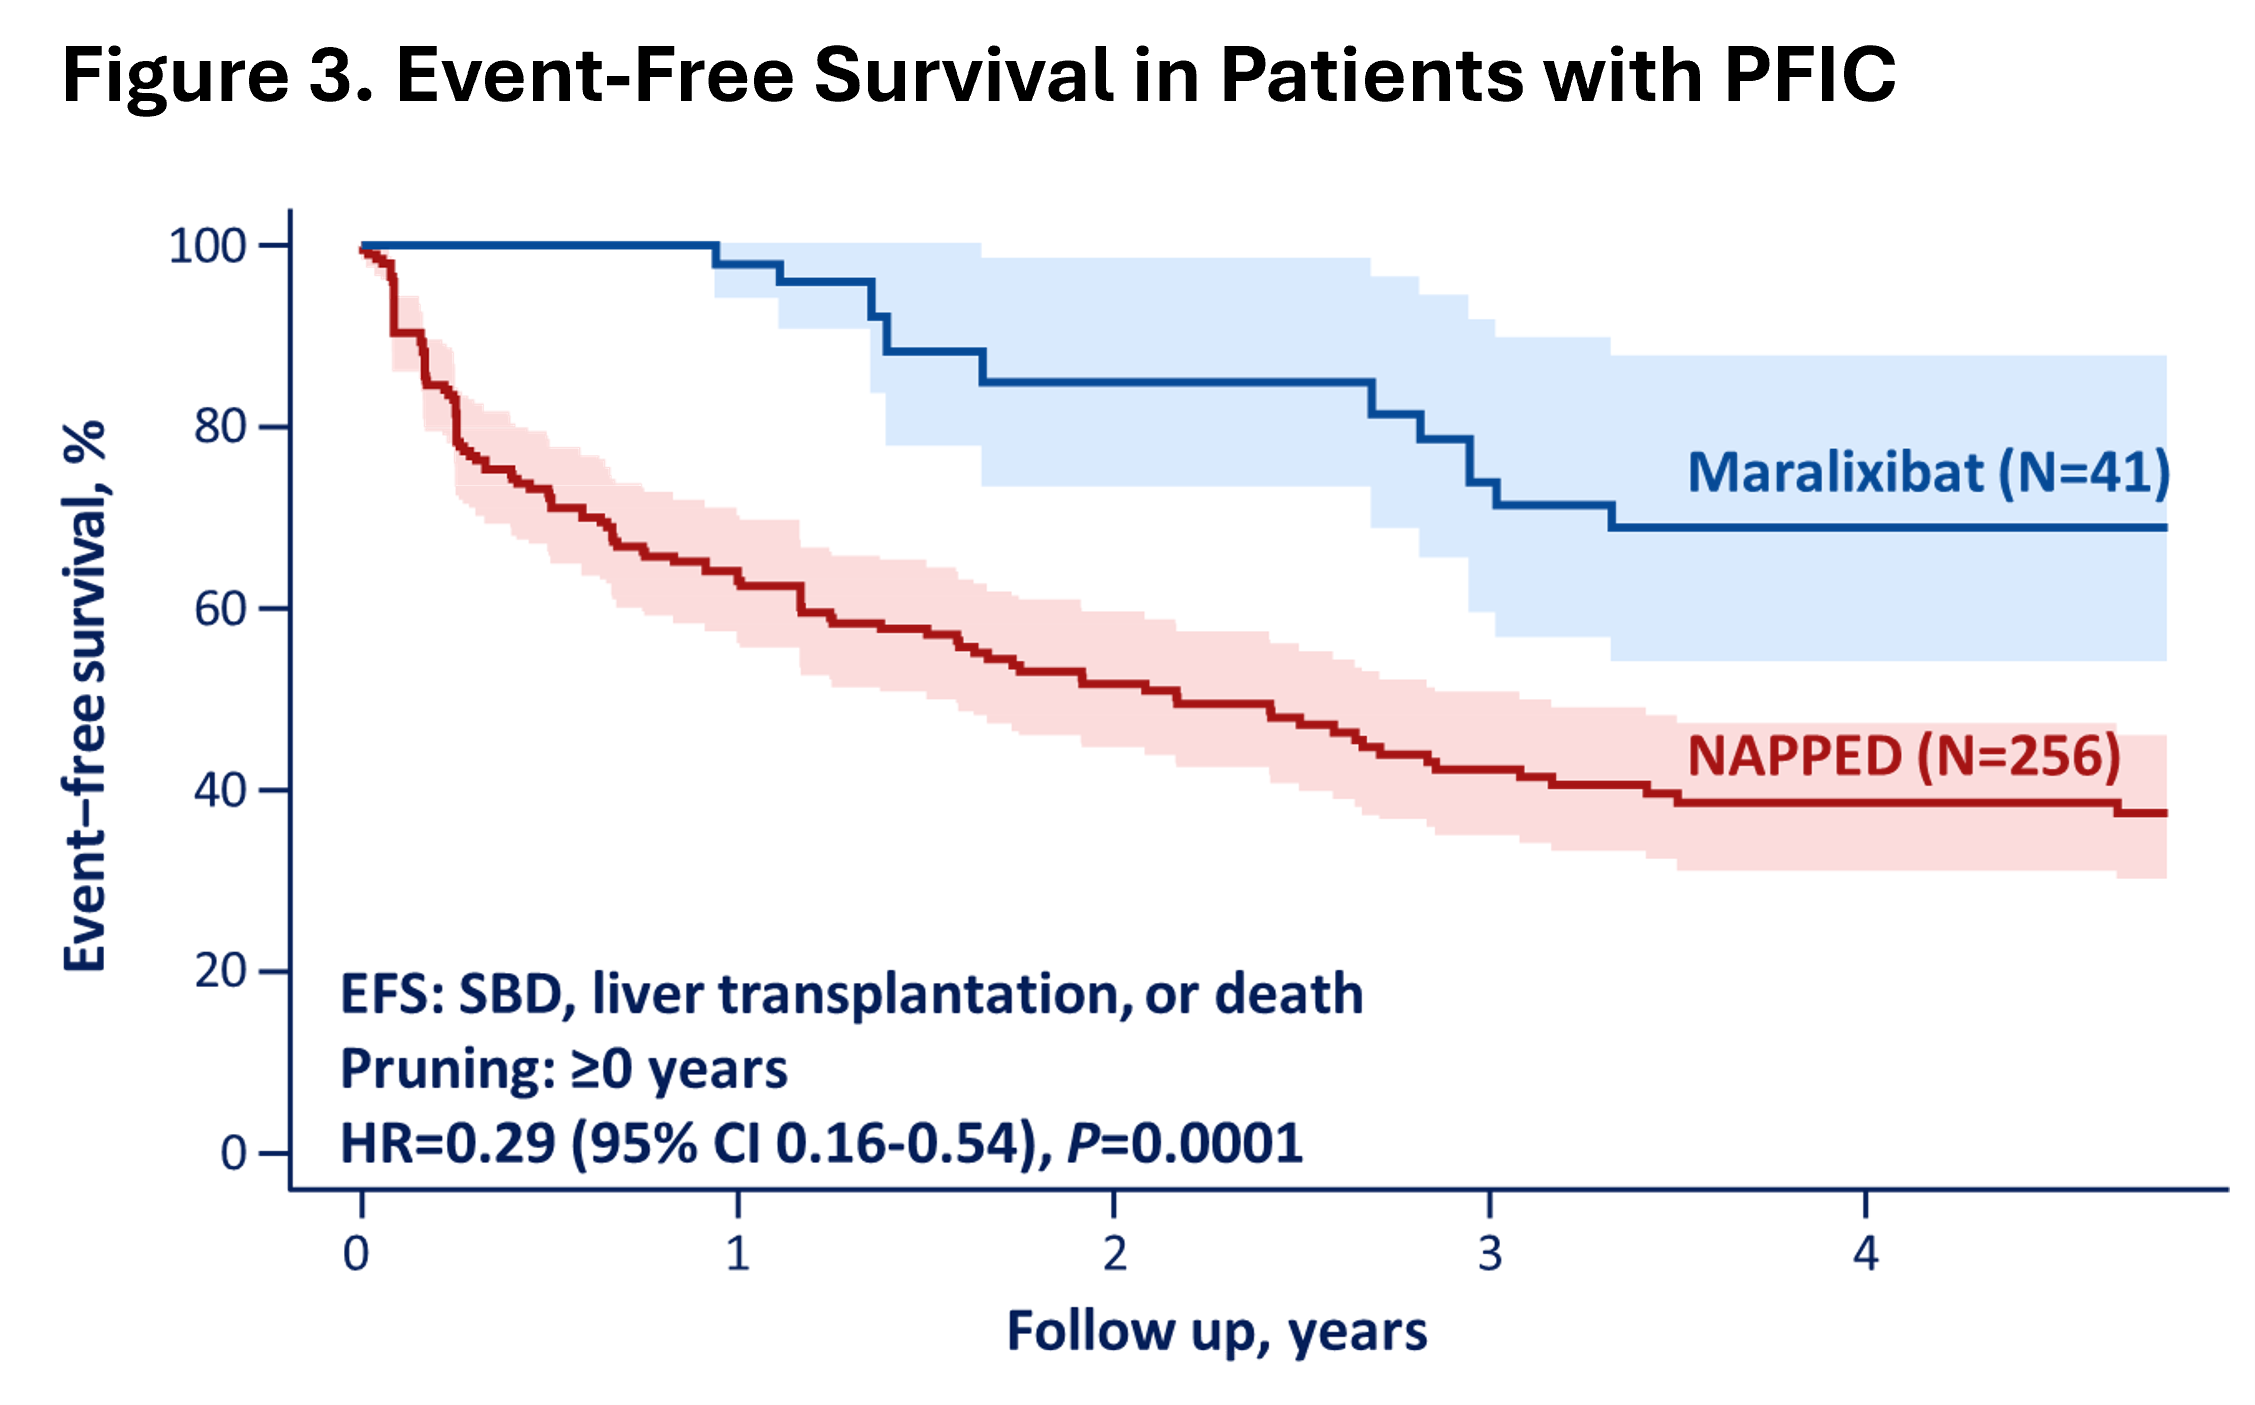
LIVMARLI® (maralixibat) is an orally administered, ileal bile acid transporter (IBAT) inhibitor approved by the U.S. Food and Drug Administration for two pediatric cholestatic liver diseases. It is approved for the treatment of cholestatic pruritus in patients with Alagille syndrome (ALGS) in the U.S. three months of age and older and in Europe for patients two months of age and older. It is also approved in the U.S. for the treatment of cholestatic pruritus in patients with progressive familial intrahepatic cholestasis (PFIC) 12 months of age and older and in Europe for the treatment of PFIC in patients three months of age and older. For more information for U.S. residents, please visit LIVMARLI.com
.
LIVMARLI has received Breakthrough Therapy designation for ALGS and PFIC type 2 and orphan designation for the treatment of ALGS and PFIC. LIVMARLI is currently being evaluated in the Phase 3 EXPAND study in additional settings of cholestatic pruritus. To learn more about ongoing clinical trials with LIVMARLI, please visit Mirum’s clinical trials section
on the company’s website.
IMPORTANT SAFETY INFORMATION
Limitation of Use: LIVMARLI is not for use in PFIC type 2 patients who have a severe defect in the bile salt export pump (BSEP) protein.
LIVMARLI can cause side effects, including:
Liver injury. Changes in certain liver tests are common in patients with ALGS and PFIC but can worsen during treatment. These changes may be a sign of liver injury. In PFIC, this can be serious or may lead to liver transplant or death. Your healthcare provider should do blood tests and physical exams before starting and during treatment to check your liver function. Tell your healthcare provider right away if you get any signs or symptoms of liver problems, including nausea or vomiting, skin or the white part of the eye turns yellow, dark or brown urine, pain on the right side of the stomach (abdomen), bloating in your stomach area, loss of appetite or bleeding or bruising more easily than normal.
Stomach and intestinal (gastrointestinal) problems. LIVMARLI can cause stomach and intestinal problems, including diarrhea and stomach pain. Your healthcare provider may advise you to monitor for new or worsening stomach problems including stomach pain, diarrhea, blood in your stool or vomiting. Tell your healthcare provider right away if you have any of these symptoms more often or more severely than normal for you.
A condition called Fat Soluble Vitamin (FSV) Deficiency caused by low levels of certain vitamins (vitamin A, D, E, and K) stored in body fat is common in patients with ALGS and PFIC but may worsen during treatment. Your healthcare provider should do blood tests before starting and during treatment and may monitor for bone fractures and bleeding which have been reported as common side effects.
US Prescribing Information
EU SmPC
Canadian Product Monograph
About CHOLBAM® (cholic acid) capsules
The FDA approved CHOLBAM® (cholic acid) capsules in March 2015, the first FDA-approved treatment for pediatric and adult patients with bile acid synthesis disorders due to single enzyme defects, and for adjunctive treatment of patients with peroxisome biogenesis disorder-Zellweger spectrum disorder. The effectiveness of CHOLBAM has been demonstrated in clinical trials for bile acid synthesis disorders and the adjunctive treatment of peroxisomal disorders. An estimated 200 to 300 patients are current candidates for therapy.
CHOLBAM (cholic acid) Indication
CHOLBAM is a bile acid indicated for
- Treatment of bile acid synthesis disorders due to single enzyme defects.
- Adjunctive treatment of peroxisomal disorders, including Zellweger spectrum disorders, in patients who exhibit manifestations of liver disease, steatorrhea, or complications from decreased fat-soluble vitamin absorption.
LIMITATIONS OF USE
The safety and effectiveness of CHOLBAM on extrahepatic manifestations of bile acid synthesis disorders due to single enzyme defects or peroxisomal disorders, including Zellweger spectrum disorders, have not been established.
IMPORTANT SAFETY INFORMATION
WARNINGS AND PRECAUTIONS – Exacerbation of liver impairment
Monitor liver function and discontinue CHOLBAM in patients who develop worsening of liver function while on treatment.
Concurrent elevations of serum gamma glutamyltransferase (GGT) and alanine aminotransferase (ALT) may indicate CHOLBAM overdose.
Discontinue treatment with CHOLBAM at any time if there are clinical or laboratory indicators of worsening liver function or cholestasis.
ADVERSE REACTIONS
The most common adverse reactions (≥1%) are diarrhea, reflux esophagitis, malaise, jaundice, skin lesion, nausea, abdominal pain, intestinal polyp, urinary tract infection, and peripheral neuropathy. Please see full Prescribing Information
for additional Important Safety Information.
About CTEXLI® (chenodiol) tablets
CTEXLI**®** (chenodiol) tablets is FDA-approved for the treatment of adults with cerebrotendinous xanthomatosis (CTX). Chenodiol is another name for chenodeoxycholic acid (CDCA). CDCA is a naturally occurring bile acid that was originally approved for the treatment of people with radiolucent stones in the gallbladder. CTEXLI was evaluated as part of the Phase 3 RESTORE study, the first and only clinical trial for CTX. CTX is a rare progressive disease that can affect the brain, spinal cord, tendons, eyes and arteries.
IMPORTANT SAFETY INFORMATION
CTEXLI can cause side effects, including:
Liver Injury: You will need to undergo laboratory testing before starting and while taking CTEXLI to check your liver function. Changes in certain liver tests may occur during treatment and may be a sign of liver injury. This can be serious. Stop taking CTEXLI immediately and tell your healthcare provider right away if you get any signs or symptoms of liver problems, including, stomach (abdomen) pain, bruising, dark-colored urine, feeling tired (fatigue), bleeding, yellowing of the skin and eyes, nausea, and itching.
Most Common Side Effects: Diarrhea, headache, stomach pain, constipation, high blood pressure, muscular weakness, and upper respiratory tract infection.
Tell your healthcare provider about all the medications that you take, as CTEXLI may interact with other medicines.
US Prescribing Information
About Volixibat
Volixibat is an investigational oral, minimally absorbed agent designed to selectively inhibit the ileal bile acid transporter (IBAT). Volixibat may offer a novel approach in the treatment of adult cholestatic diseases by blocking the recycling of bile acids through inhibition of IBAT, thereby reducing bile acids systemically and in the liver. Volixibat is currently being evaluated in Phase 2b studies for primary sclerosing cholangitis (PSC) (VISTAS study), and primary biliary cholangitis (PBC) (VANTAGE study).
In 2026, Mirum shared that the Phase 2b VISTAS study of volixibat in PSC met its primary endpoint, with statistically significant and clinically meaningful reductions in pruritus observed in patients treated with volixibat. Volixibat’s safety profile in the study was generally consistent with the known effects of IBAT inhibition. Volixibat has been granted FDA Breakthrough Therapy designation for the treatment of cholestatic pruritus due to PSC.
In 2024, Mirum announced positive interim results from the Phase 2b VANTAGE study of volixibat in PBC. No new safety signals were observed in the study. Volixibat has been granted FDA Breakthrough Therapy designation for the treatment of cholestatic pruritus due to PBC.
About Brelovitug
Brelovitug is an investigational, highly potent, pan-genotypic, fully human immunoglobulin G1 (IgG1) monoclonal antibody (mAb) that targets the surface antigen (anti-HBsAg) on both the hepatitis delta virus (HDV) and the hepatitis B virus (HBV). Brelovitug is designed to neutralize and remove hepatitis B and hepatitis D virions and deplete HBsAg-containing subviral particles. Brelovitug has FDA Breakthrough Therapy designation for the treatment of chronic HDV infection and PRIME and Orphan designations from the European Medicines Agency.
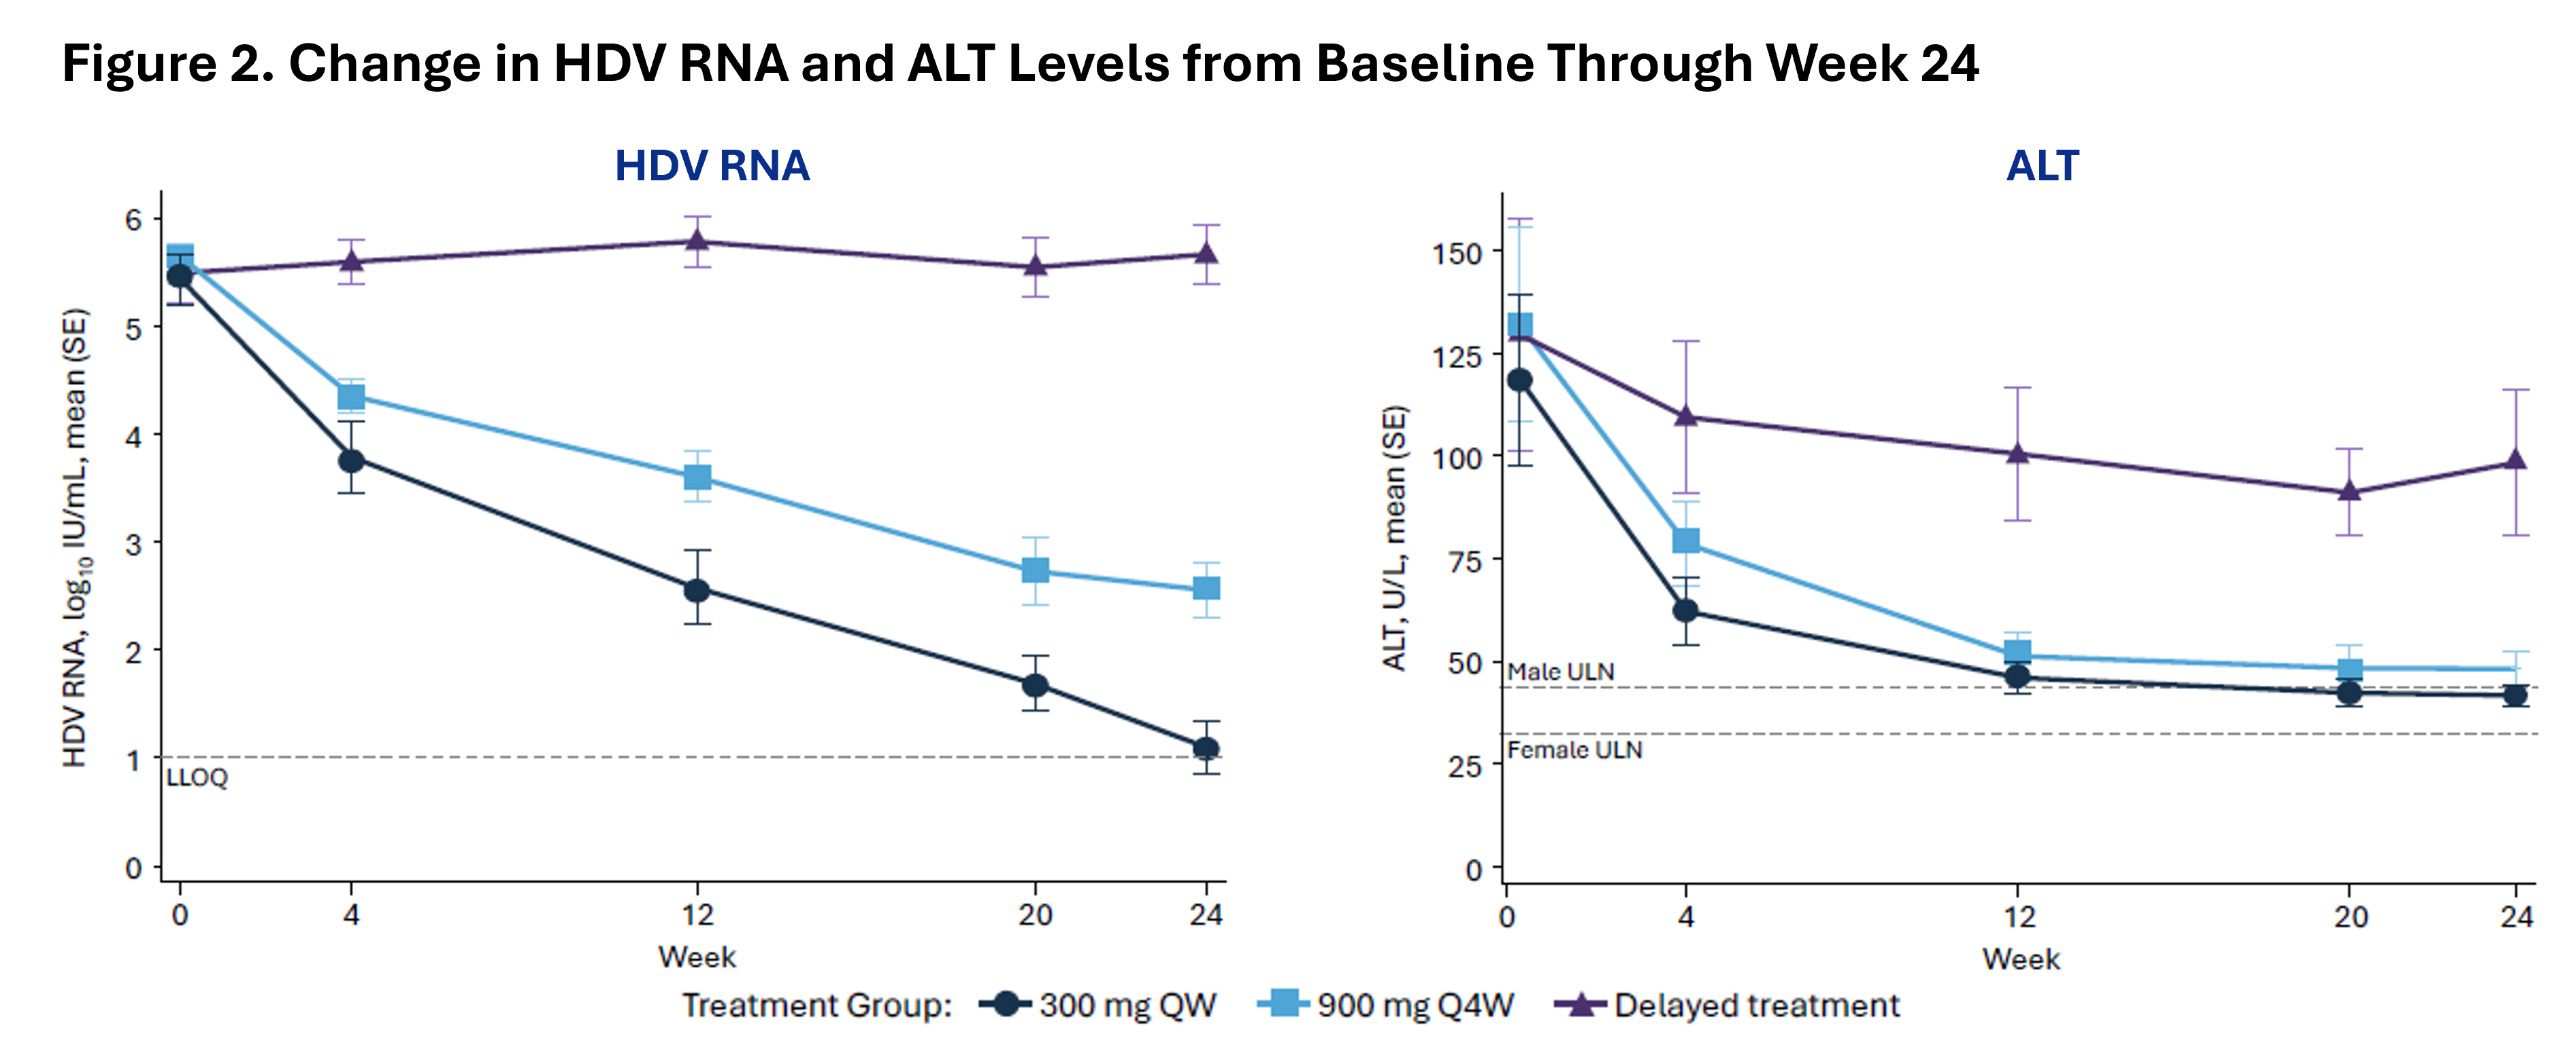
In 2026, Mirum announced that in the Phase 2b portion of the AZURE-1 study in HDV, treatment with brelovitug demonstrated strong antiviral activity in HDV and achieved the primary composite endpoint of virologic response and alanine aminotransferase (ALT) normalization at Week 24 in both brelovitug dose arms as compared to the delayed treatment arm. Favorable safety and tolerability profiles were observed. Brelovitug is currently being evaluated in the global Phase 3 AZURE clinical program. Mirum owns worldwide rights to brelovitug.
About Zilurgisertib
Zilurgisertib is an investigational, oral, small molecule, activin receptor-like kinase 2 (ALK2) inhibitor in development for the treatment of Fibrodysplasia Ossificans Progressiva (FOP). Zilurgisertib is designed to inhibit the ALK2 receptor, which is abnormally active in most patients with FOP and leads to bone formation in soft tissues, a process known as heterotopic ossification (HO). FOP is an ultra-rare genetic disease that affects approximately 300 patients in the U.S. and 900 worldwide, with diagnosis typically occurring in early childhood. Zilurgisertib was evaluated in the PROGRESS pivotal Phase 2 study, which formed the basis of a new drug application (NDA). The FDA has accepted the NDA for zilurgisertib in FOP under Priority Review with a Prescription Drug User Fee Act (PDUFA) date of September 26, 2026.
Mirum Pharmaceuticals, Inc. licensed zilurgisertib from Incyte for worldwide development and commercialization.
About MRM-3379
MRM-3379 is an in-licensed investigational oral therapy being evaluated for the treatment of Fragile X syndrome (FXS). It is a selective phosphodiesterase-4D (PDE4D) inhibitor designed to enhance cAMP signaling. MRM-3379 may offer a novel approach to improving cognition, language, and daily function in individuals with FXS. MRM-3379 has been granted FDA Fast Track designation for the treatment of FXS.
The BLOOM Phase 2 clinical study of MRM-3379 is currently underway in FXS. Males ages 16 to 45 will be randomly assigned to receive one of three dose levels of MRM-3379 or placebo for 12 weeks. An open-label cohort of boys ages 13 to 16 will receive the lowest dose, in order to explore effects of treatment in younger boys, closer to the age of diagnosis. The study’s primary endpoint is safety and tolerability, the key secondary endpoint is the NIH Toolbox Crystallized Cognition Composite (CCC), and several exploratory endpoints will assess potential effects on mood, behavior, and other symptoms that are relevant to this population. Mirum owns worldwide rights to MRM-3379.
About Mirum Pharmaceuticals
Mirum Pharmaceuticals (NASDAQ: MIRM) is a leading rare disease company with a global footprint of approved products and a broad pipeline of investigational medicines. Purpose-built to bring forward breakthrough medicines for people with overlooked conditions, Mirum focuses on rare liver and rare genetic diseases, where it has built deep expertise and strong connections to patient communities. The company’s commercial portfolio includes LIVMARLI® (maralixibat) for Alagille syndrome (ALGS) and progressive familial intrahepatic cholestasis (PFIC), CHOLBAM® (cholic acid) for bile-acid synthesis disorders, and CTEXLI® (chenodiol) for cerebrotendinous xanthomatosis (CTX).
Mirum’s clinical-stage pipeline includes volixibat, an IBAT inhibitor in late-stage development for primary sclerosing cholangitis (PSC) and primary biliary cholangitis (PBC), brelovitug, a fully human monoclonal antibody in late-stage development for chronic hepatitis delta virus (HDV), zilurgisertib, an ALK2 inhibitor under regulatory review with the FDA for fibrodysplasia ossificans progressiva (FOP), and MRM-3379, a PDE4D inhibitor being evaluated for Fragile X syndrome (FXS).
Mirum’s success is driven by a team dedicated to advancing high impact medicines through strategic development, disciplined execution and purposeful collaboration across the rare disease ecosystem. Learn more at www.mirumpharma.com
and follow Mirum on Facebook
, LinkedIn
, Instagram
and X
.
Forward-Looking Statements
Statements contained in this press release regarding matters that are not historical facts are “forward-looking statements” within the meaning of the Private Securities Litigation Reform Act of 1995. Such forward-looking statements include statements regarding, among other things, commercial results for our approved products, including continued growth in year-over-year net product sales, achievement of our 2026 financial guidance, our anticipated successes in 2026, including continued commercial momentum, the results, enrollment, conduct and progress of our ongoing and planned studies for our product candidates, including the timing and results of interim and topline analyses of our ongoing studies, the occurrence, timing and results of our discussions with the FDA regarding volixibat, potential submission and approval of NDA filings, the timing of any submissions and approvals of NDA filings and the potential commercial launch of our product candidates. Because such statements are subject to risks and uncertainties, actual results may differ materially from those expressed or implied by such forward-looking statements. Words such as “anticipate,” “expected,” “will,” “could,” “would,” “guidance,” “target,” “intend,” “plan,” “potential” and similar expressions are intended to identify forward-looking statements. These forward-looking statements are based upon Mirum’s current expectations and involve assumptions that may never materialize or may prove to be incorrect. Actual results could differ materially from those anticipated in such forward-looking statements as a result of various risks and uncertainties, which include, without limitation, risks and uncertainties associated with Mirum’s business in general, risks and uncertainties associated with pharmaceutical development and commercialization in general, the impact of geopolitical and macroeconomic events, and the other risks described in Mirum’s Annual Report on Form 10-K for the year ended December 31, 2025 and subsequent filings with the Securities and Exchange Commission. All forward-looking statements contained in this press release speak only as of the date on which they were made and are based on management’s assumptions and estimates as of such date. Mirum undertakes no obligation to update such statements to reflect events that occur or circumstances that exist after the date on which they were made, except as required by law.
Mirum and the Mirum logo are trademarks of Mirum Pharmaceuticals, Inc.
|
|
|
|
|
|
|
|
|
|
|
|
|
|
|
|
|
|
|
|
|
|
|
|
|
|
|
|
|
|
|
|
| Mirum Pharmaceuticals, Inc.Condensed Consolidated Statement of Operations Data(in thousands, except share and per share amounts)(Unaudited) |
|
|
|
|
|
|
|
|
|
|
|
|
|
|
|
|
|
|
|
|
|
|
|
|
|
|
|
|
|
|
|
|
Three Months Ended June 30, |
|
|
|
|
|
|
|
Six Months Ended June 30, |
|
|
|
|
|
|
|
|
2026 |
|
|
|
2025 |
|
|
|
2026 |
|
|
|
2025 |
|
|
|
|
|
|
|
|
|
|
|
|
|
|
|
|
|
| Revenue: |
|
|
|
|
|
|
|
|
|
|
|
|
|
|
|
| Product sales, net |
$ |
176,243 |
|
|
$ |
127,785 |
|
|
$ |
336,125 |
|
|
$ |
239,370 |
|
| Operating expenses: |
|
|
|
|
|
|
|
|
|
|
|
|
|
|
|
| Cost of sales (1) |
|
30,348 |
|
|
|
23,421 |
|
|
|
59,153 |
|
|
|
46,439 |
|
| Research and development |
|
90,528 |
|
|
|
46,067 |
|
|
|
188,438 |
|
|
|
87,111 |
|
| Acquired in-process research and development |
|
16,435 |
|
|
|
— |
|
|
|
742,737 |
|
|
|
5,000 |
|
| Selling, general and administrative |
|
81,469 |
|
|
|
63,286 |
|
|
|
177,799 |
|
|
|
120,992 |
|
| Total operating expenses (2) |
|
218,780 |
|
|
|
132,774 |
|
|
|
1,168,127 |
|
|
|
259,542 |
|
| Loss from operations |
|
(42,537 |
) |
|
|
(4,989 |
) |
|
|
(832,002 |
) |
|
|
(20,172 |
) |
| Other income (expense): |
|
|
|
|
|
|
|
|
|
|
|
|
|
|
|
| Interest income |
|
3,851 |
|
|
|
3,033 |
|
|
|
7,252 |
|
|
|
6,056 |
|
| Interest expense |
|
(2,618 |
) |
|
|
(3,589 |
) |
|
|
(6,234 |
) |
|
|
(7,185 |
) |
| Other (expense) income, net |
|
(24,234 |
) |
|
|
86 |
|
|
|
(24,234 |
) |
|
|
2,194 |
|
| Net loss before provision for income taxes |
|
(65,538 |
) |
|
|
(5,459 |
) |
|
|
(855,218 |
) |
|
|
(19,107 |
) |
| Provision for income taxes |
|
1,689 |
|
|
|
402 |
|
|
|
2,164 |
|
|
|
1,431 |
|
| Net loss |
$ |
(67,227 |
) |
|
$ |
(5,861 |
) |
|
$ |
(857,382 |
) |
|
$ |
(20,538 |
) |
|
|
|
|
|
|
|
|
|
|
|
|
|
|
|
|
| Net loss per share, basic and diluted |
$ |
(1.06 |
) |
|
$ |
(0.12 |
) |
|
$ |
(14.03 |
) |
|
$ |
(0.42 |
) |
| Weighted-average shares of common stock used to compute net loss per share, basic and diluted |
|
63,374,183 |
|
|
|
49,726,823 |
|
|
|
61,125,097 |
|
|
|
49,310,255 |
|
|
|
|
|
|
|
|
|
|
|
|
|
|
|
|
|
|
|
|
|
|
|
|
|
|
|
|
|
|
|
|
|
| (1) Amounts include intangible amortization expense as follows: |
|
|
|
|
|
|
|
|
|
|
|
|
|
|
|
|
|
|
|
|
|
|
|
|
|
|
|
|
|
|
|
| Intangible amortization |
$ |
6,685 |
|
|
$ |
5,894 |
|
|
$ |
13,370 |
|
|
$ |
11,788 |
|
|
|
|
|
|
|
|
|
|
|
|
|
|
|
|
|
| (2) Amounts include stock-based compensation expense as follows: |
|
|
|
|
|
|
|
|
|
|
|
|
|
|
|
|
|
|
|
|
|
|
|
|
|
|
|
|
|
|
|
| Cost of sales |
$ |
461 |
|
|
$ |
238 |
|
|
$ |
809 |
|
|
$ |
569 |
|
| Research and development |
|
14,227 |
|
|
|
7,624 |
|
|
|
38,416 |
|
|
|
12,853 |
|
| Selling, general and administrative |
|
15,887 |
|
|
|
10,606 |
|
|
|
48,824 |
|
|
|
20,849 |
|
| Total stock-based compensation |
$ |
30,575 |
|
|
$ |
18,468 |
|
|
$ |
88,049 |
|
|
$ |
34,271 |
|
|
|
|
|
|
|
|
|
|
|
|
|
|
|
|
|
|
|
|
|
|
|
|
|
| Mirum Pharmaceuticals, Inc.Condensed Consolidated Balance Sheet Data(in thousands)(Unaudited) |
|
|
|
|
|
|
|
|
|
|
|
|
|
|
|
|
June 30, 2026 |
|
|
|
December 31, 2025 |
|
|
|
|
|
|
|
|
|
|
| Assets |
|
|
|
|
|
|
|
| Current assets: |
|
|
|
|
|
|
|
| Cash and cash equivalents |
$ |
330,728 |
|
|
$ |
296,683 |
|
| Short-term investments |
|
107,563 |
|
|
|
86,644 |
|
| Accounts receivable |
|
145,360 |
|
|
|
123,330 |
|
| Inventory |
|
25,769 |
|
|
|
24,887 |
|
| Prepaid expenses and other current assets |
|
26,890 |
|
|
|
18,140 |
|
| Total current assets |
|
636,310 |
|
|
|
549,684 |
|
| Restricted cash |
|
1,734 |
|
|
|
1,482 |
|
| Long-term investments |
|
123,030 |
|
|
|
8,105 |
|
| Intangible assets, net |
|
247,388 |
|
|
|
260,921 |
|
| Other noncurrent assets |
|
36,519 |
|
|
|
22,621 |
|
| Total assets |
$ |
1,044,981 |
|
|
$ |
842,813 |
|
| Liabilities and Stockholders’ (Deficit) Equity |
|
|
|
|
|
|
|
| Current liabilities: |
|
|
|
|
|
|
|
| Accounts payable |
$ |
23,427 |
|
|
$ |
9,614 |
|
| Holdback liabilities, current |
|
24,800 |
|
|
|
— |
|
| Accrued expenses and other current liabilities |
|
174,561 |
|
|
|
196,185 |
|
| Total current liabilities |
|
222,788 |
|
|
|
205,799 |
|
| Operating lease liabilities, noncurrent |
|
10,465 |
|
|
|
7,516 |
|
| Convertible notes payable, net, noncurrent |
|
750,079 |
|
|
|
309,797 |
|
| Holdback liabilities, noncurrent |
|
61,154 |
|
|
|
— |
|
| Other liabilities |
|
10,917 |
|
|
|
5,011 |
|
| Total liabilities |
|
1,055,403 |
|
|
|
528,123 |
|
| Commitments and contingencies |
|
|
|
|
|
|
|
| Stockholders’ (deficit) equity: |
|
|
|
|
|
|
|
| Preferred stock |
|
— |
|
|
|
— |
|
| Common stock |
|
6 |
|
|
|
5 |
|
| Additional paid-in capital |
|
1,515,172 |
|
|
|
981,878 |
|
| Accumulated deficit |
|
(1,524,926 |
) |
|
|
(667,544 |
) |
| Accumulated other comprehensive (loss) income |
|
(674 |
) |
|
|
351 |
|
| Total stockholders’ (deficit) equity |
|
(10,422 |
) |
|
|
314,690 |
|
| Total liabilities and stockholders’ (deficit) equity |
$ |
1,044,981 |
|
|
$ |
842,813 |
|
Investor Contact:
Andrew McKibben
[email protected]
Media Contact:
Meredith Kiernan
[email protected]
Source: Mirum Pharmaceuticals, Inc.
View All News
Investor Contacts
Andrew McKibben
[email protected]
Media Contact
Meredith Kiernan
Investor Email Alerts
Personal Information.
Email Address *Required Email Address is required. Email Address is invalid.
Investor Alert Options *
- News
- Quarterly Reports
- Annual Reports
- SEC Filings
- End of Day Stock Quote
- Events & Presentations
Investor Alert Options is required.
The captcha test has failed. Please try again.
Submit
Unsubscribe




© 2026 Mirum Pharmaceuticals, Inc. - All rights reserved
Powered By Q4 Inc. 5.190.1.9 (opens in new window)