Skip to main content Skip to header Skip to main menu Skip to main content Skip to footer Investors MGE search x What can we help you find?: Invest Purchase Stock Performance Dividends SEC Reports Investor Relations Investor Presentations News News…
Skip to main content
search
x
What can we help you find?:

2023 Annual Report
2023 Annual Report
Form 10-K
Proxy

Our grid is becoming more dynamic, more integrated with new technologies that touch our customers in innovative ways and help advance sustainability for our shared energy future. MGE Energy's 2023 Annual Report explores some of the ways in which your community energy company is connecting with those we serve to achieve our goals together.
MGE Energy, Inc.
MGE Energy is an investor-owned public utility holding company headquartered in the state capital of Madison, Wis. MGE Energy is the parent company of Madison Gas and Electric Co. The utility provides natural gas and electric service in south-central and western Wisconsin. Assets total approximately $2.7 billion. In 2023, revenue was approximately $690 million. See the Corporate Profile
.
MGE Energy (MGEE)
|
|
|
|
|
| Year at a Glance (Thousands, except per-share amounts and shares outstanding) |
2023 |
2022 |
Increase / (Decrease) |
% Change |
| Total Market Value (Dec. 31) |
$ 2,614,973 |
$ 2,545,901 |
$ 69,072 |
2.7% |
| Market Price Per Share (Dec. 31) |
$ 72.31 |
$ 70.40 |
$ 1.91 |
2.7% |
| Book Value Per Share |
$ 31.53 |
$ 29.91 |
$ 1.62 |
5.4% |
| Average Shares Outstanding |
36,163,370 |
36,163,370 |
- |
0.0% |
| Shares Outstanding at Year-End |
36,163,370 |
36,163,370 |
- |
0.0% |
| Operating Revenues |
$ 690,431 |
$ 714,519 |
$ (24,088) |
(3.4%) |
| Net Income |
$ 117,699 |
$ 110,952 |
$ 6,747 |
6.1% |
| Basic and Diluted Earnings Per Share |
$ 3.25 |
$ 3.07 |
$ 0.18 |
5.9% |
| Dividends Declared Per Share |
$ 1.67 |
$ 1.59 |
$ 0.08 |
5.0% |
| Dividend Payout Ratio |
51.4% |
51.8% |
(0.4%) |
(0.8%) |
| Total Assets |
$ 2,675,458 |
$ 2,517,600 |
$ 157,858 |
6.3% |
| Total Retail Electric Sales (kWh) |
3,158,967 |
3,190,820 |
(31,853) |
(1.0%) |
| Total Gas Deliveries (therms) |
265,560 |
300,039 |
(34,479) |
(11.5%) |
For detailed information, see the 2023 MGE Energy Form 10-K
.
"Our vision for greater sustainability connects us to our fundamentals and to new opportunities for shaping our future and enhancing our relationships with those we serve."
—Jeff Keebler, Chairman, President and CEO
To our Shareholders
A smarter grid for a more connected world

Chairman, President and CEO Jeff Keebler at MGE headquarters in Madison, Wis. In early 2023, MGE introduced a newly renovated space for employees at its main office building. Known as The Hub, the vibrant space offers all employees an inviting place to focus, collaborate or socialize.
We live in an increasingly connected world with energy at the core of those relationships—our global and local economies, our communities and critical services, our households and businesses.
Your community energy company has a responsibility to provide safe, reliable, affordable and sustainable energy. Increasingly, we have new opportunities to fulfill our mission and to engage our customers in innovative ways.
Responsibility. Opportunity. Sustainability.
To meet our obligation today and into the future, we are seizing cost-effective opportunities to invest in our systems, our people and our communities. More than ever, our customers are active participants in our shared energy future. As we decarbonize our energy supply, we are working with customers to advance energy efficiency and electrification, two other key strategies for reducing carbon emissions.
Madison Gas and Electric (MGE) is building a more advanced grid—with more assets and resources interconnected, from large-scale solar and battery storage to managed smart thermostats and electric vehicle charging. This report explores some of the ways MGE is engaging customers in clean energy, energy efficiency and electric vehicles to manage efficiently and cost-effectively an evolving, more integrated and dynamic grid for the benefit of all customers.
Connected together
A foundational objective in our Energy 2030 framework for a more sustainable future, introduced in November 2015, is ensuring all our customers benefit from our ongoing transition toward cleaner energy and a smarter grid. As an industry leader and community partner, our utility subsidiary, MGE, is committed to working together—to connecting—with all of those we serve to meet our responsibility, seize opportunities that provide value and achieve our sustainability goals.
Industry-leading goals
MGE continues to work toward its industry-leading carbon reduction goals, consistent with global climate science. As we work toward net-zero carbon electricity by 2050, MGE is targeting carbon emissions reductions of at least 80% by 2030, from 2005 levels.
Under our commitment, by 2030, every MGE electric customer will have 80% fewer carbon emissions from their electricity use simply by being an MGE customer. By 2050, MGE will have eliminated the carbon footprint associated with each customer's electricity use under our net-zero carbon goal.
Maintaining energy affordability remains important to MGE. Since announcing our Energy 2030 framework, we have made significant investments in cleaner energy generation and grown the company while managing impacts to electric rates. Our most recent rate case, decided in 2023, set rates for 2024 and 2025. The average annual electric rate increase from 2016 through 2025 is approximately 1.2%. Renewable energy carries no fuel costs, which helps to reduce rate volatility and manage long-term costs into the future.
Elimination of coal
MGE expects to cut its use of coal substantially by the end of 2030 and to eliminate it from the company's generation portfolio by the end of 2032.
Both units at the coal-fired Columbia Energy Center are expected to be retired by mid-2026, more than 10 years ahead of schedule. By 2027, with the planned retirement of Columbia, MGE expects to have eliminated approximately two-thirds of the company's current coal-fired generation capacity.
By the end of 2030, MGE expects coal to be used only as a backup fuel at the Elm Road Generating Station, which is transitioning to natural gas by the end of 2032.
Asset growth
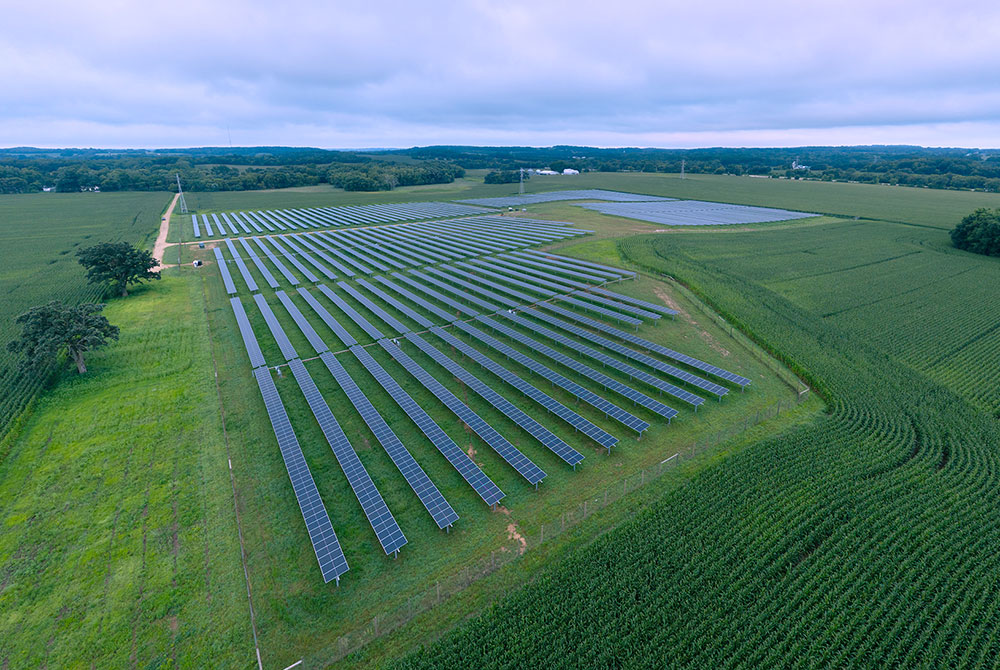
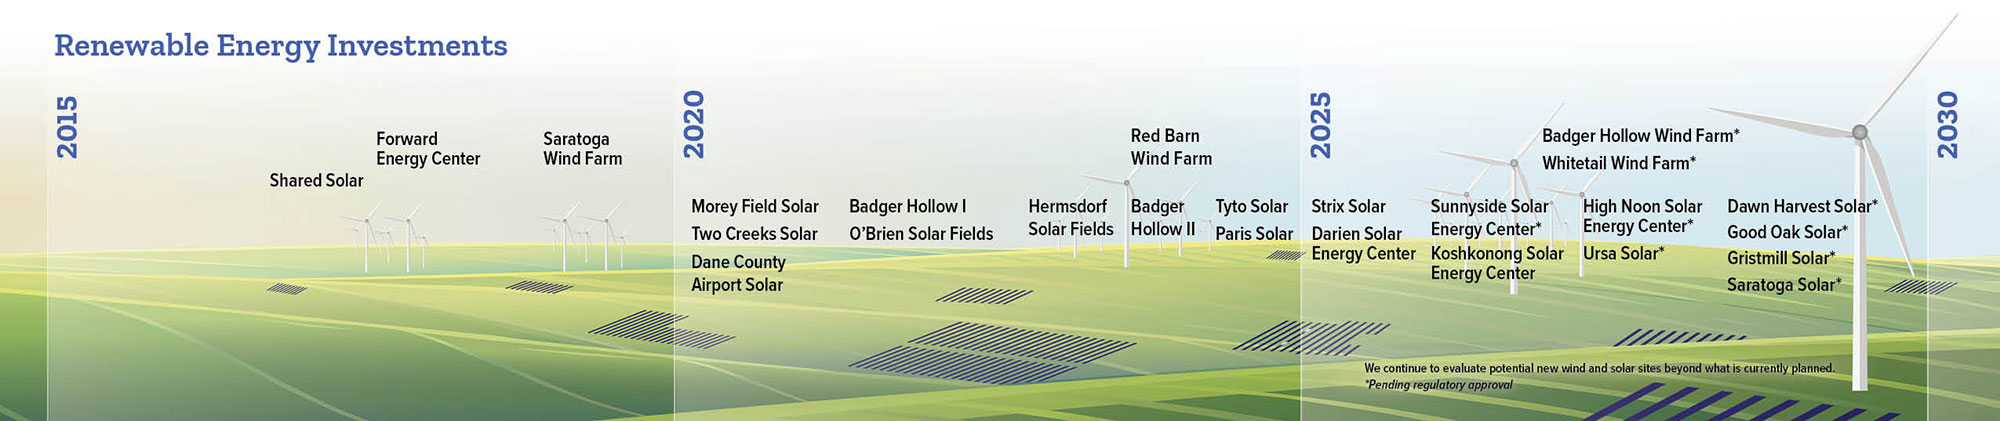
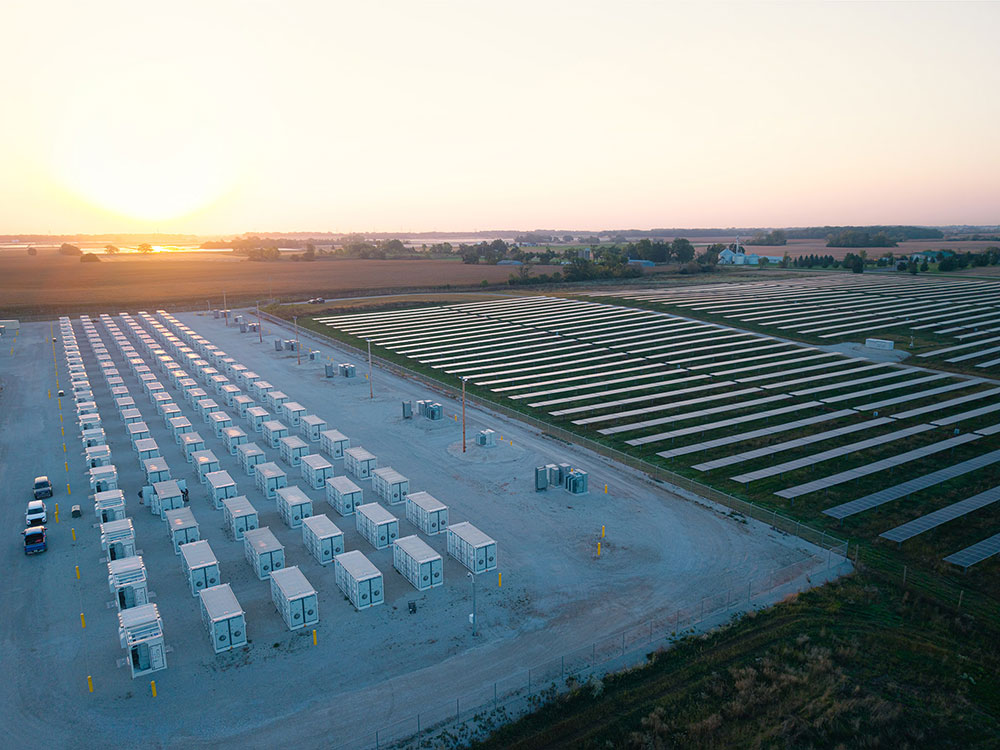
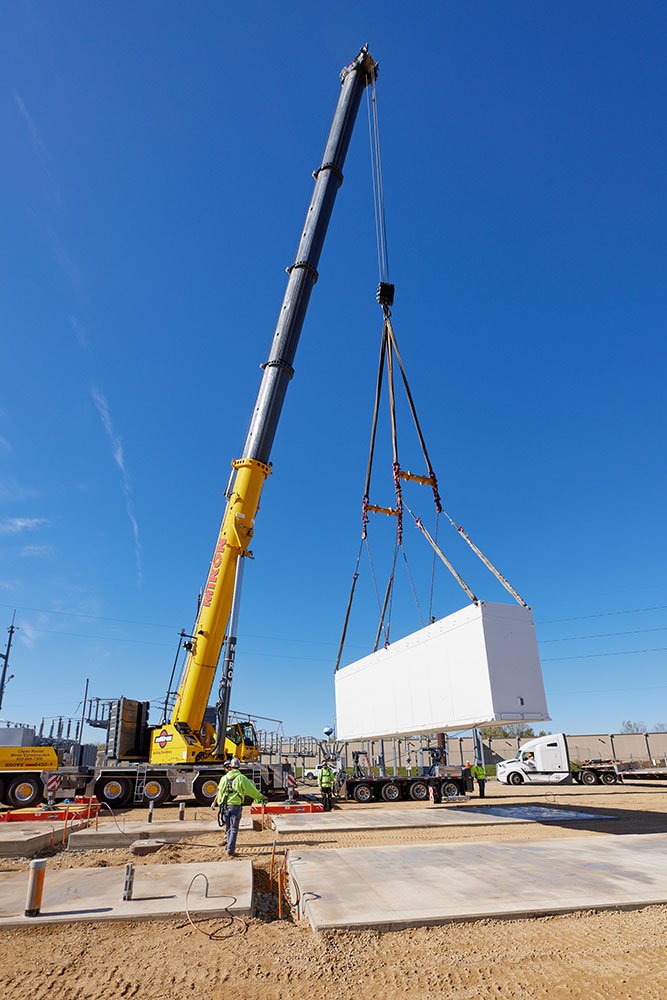
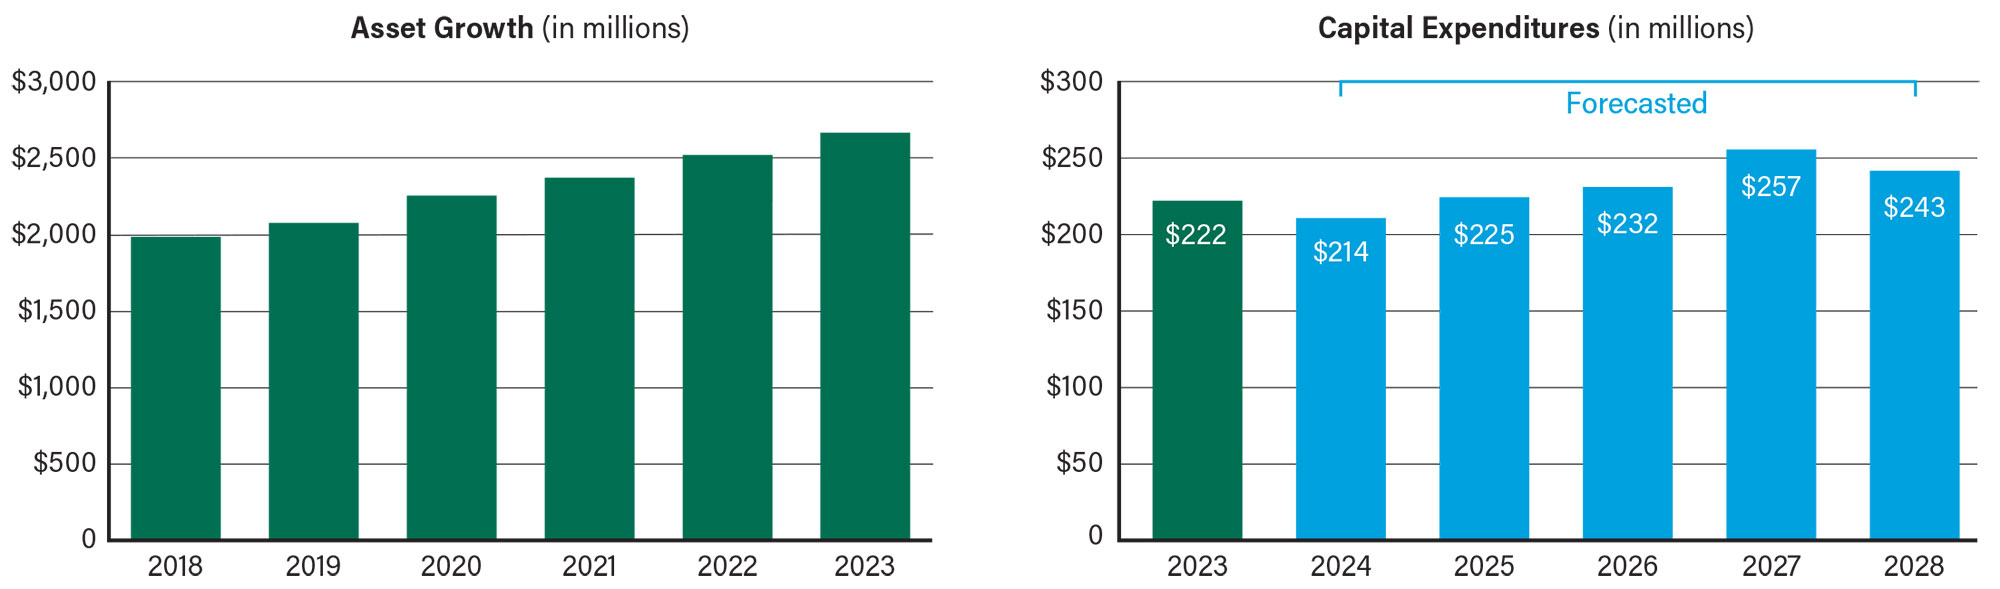
Our recent and planned investments in cost-effective generation are enabling the decarbonization of our energy supply while ensuring ongoing energy reliability. In 2023, MGE received State regulatory approval to purchase 10% of the 300-megawatt (MW) Koshkonong Solar Energy Center, one of three major solar projects underway. MGE also has approval to purchase 10% shares of the 200-MW Paris Solar-Battery Park and the 250-MW Darien Solar Energy Center, both of which are under construction. MGE also will own a 10% share of a 110-MW battery storage facility at the Paris project.
In early 2024, MGE filed for State regulatory approval to purchase a 10% share of the 300-MW High Noon Solar Energy Center to be built in Columbia County. The High Noon Solar Energy Center is expected to start serving customers by the end of 2026.
While we are replacing much of the coal-fired generation to be retired from the Columbia Energy Center with investments in renewable generation, in early 2023, MGE purchased 25 MW from the state-of-the-art West Riverside Energy Center. In early 2024, the company obtained preliminary approval from State regulators to purchase an additional 25 MW. The highly efficient, natural gas-fired facility will help ensure continued top-ranked electric reliability as MGE continues to transition to greater use of renewables.
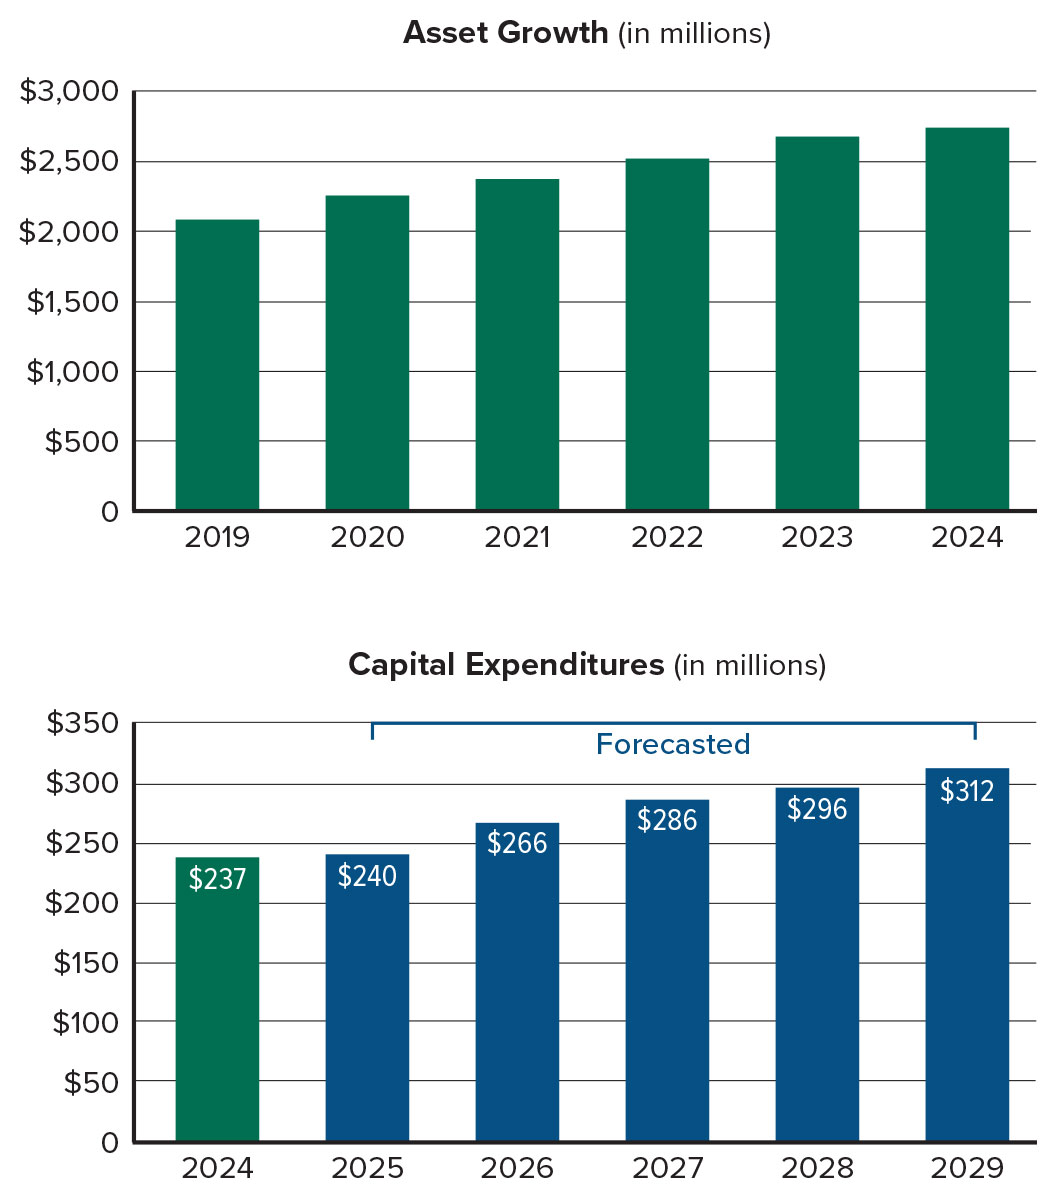
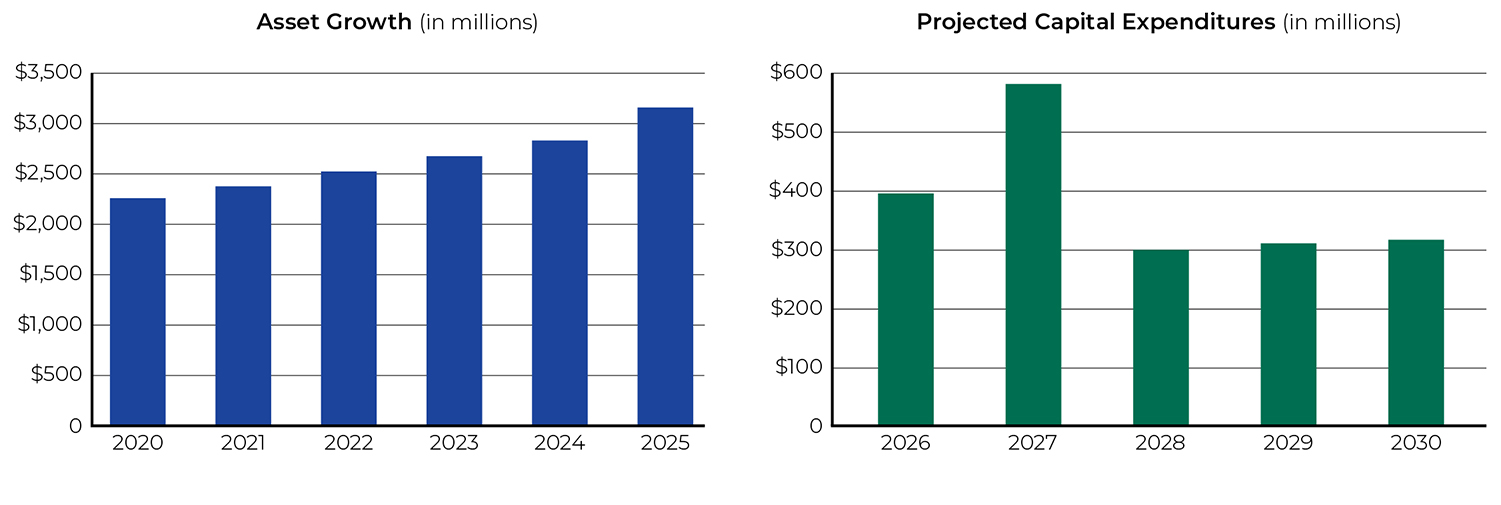
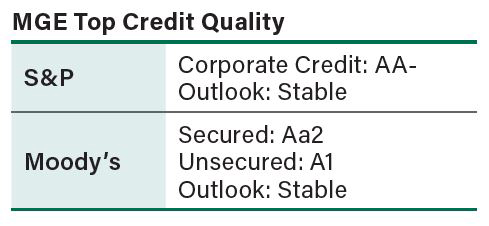
In the last five years, MGE Energy has grown its asset base from nearly $2 billion to almost $2.7 billion, resulting in a compound annual growth rate in assets of 6%. MGE continues to maintain the highest credit ratings of any investor-owned combination utility in the nation from Standard & Poor's (S&P) and Moody's, helping enable its robust investment in a cleaner energy future.
Strong financial performance
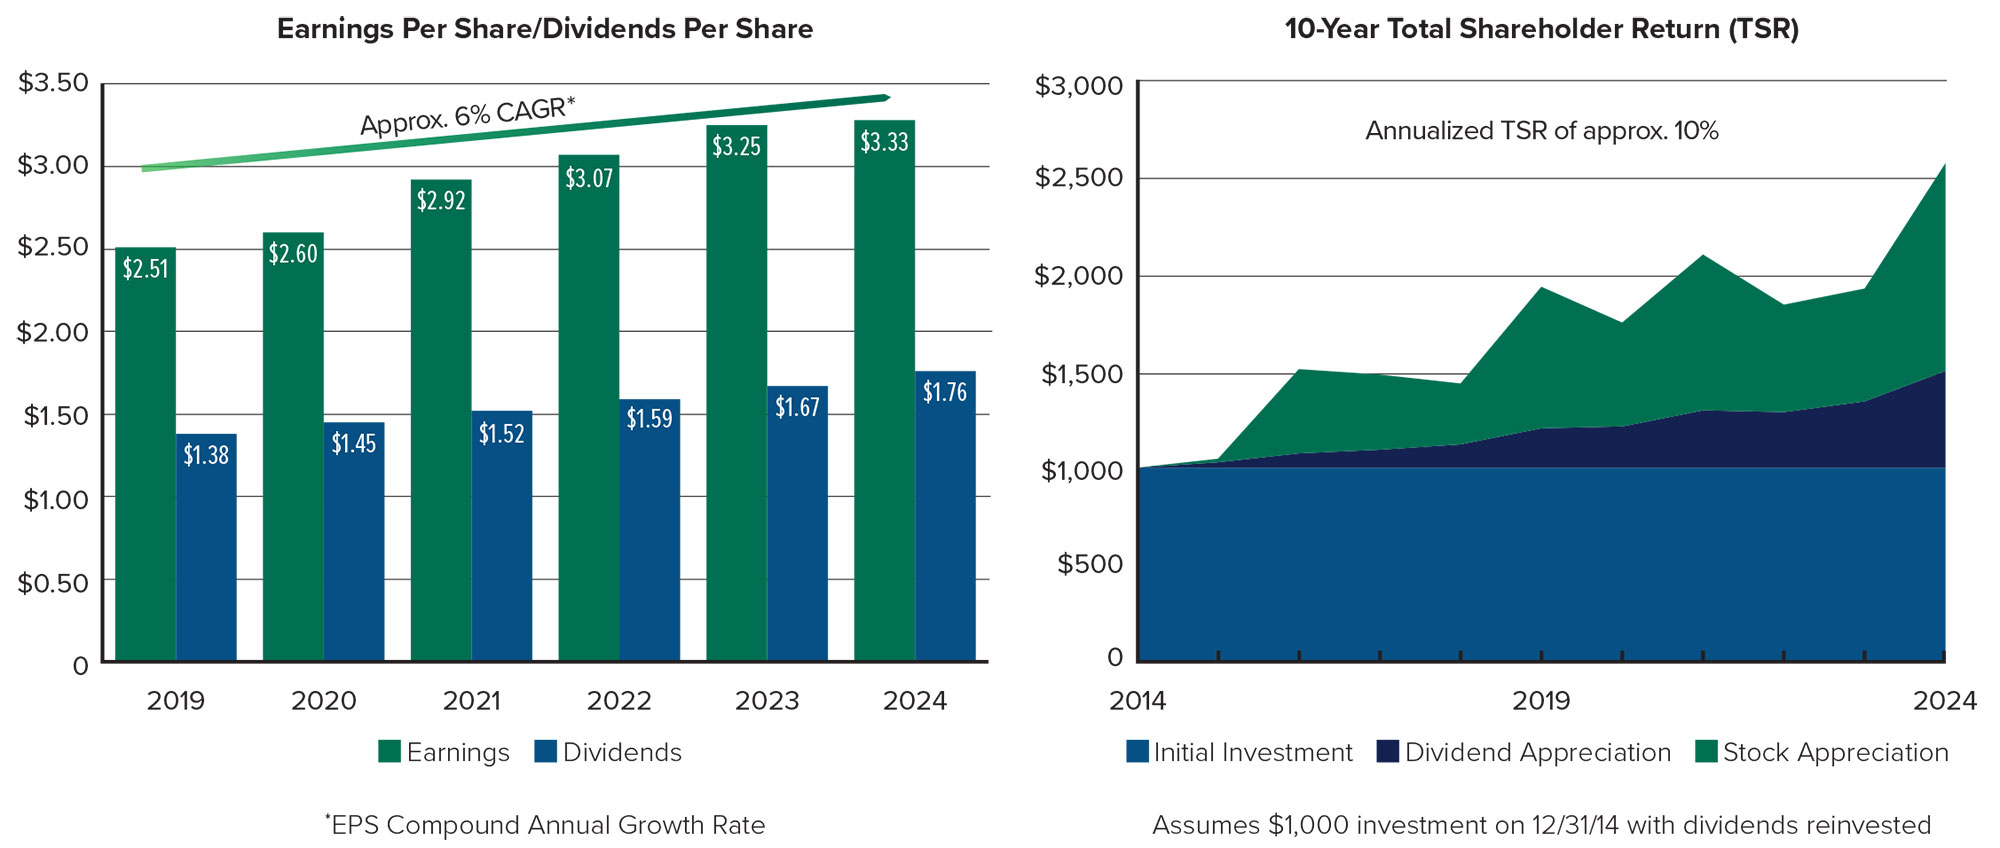
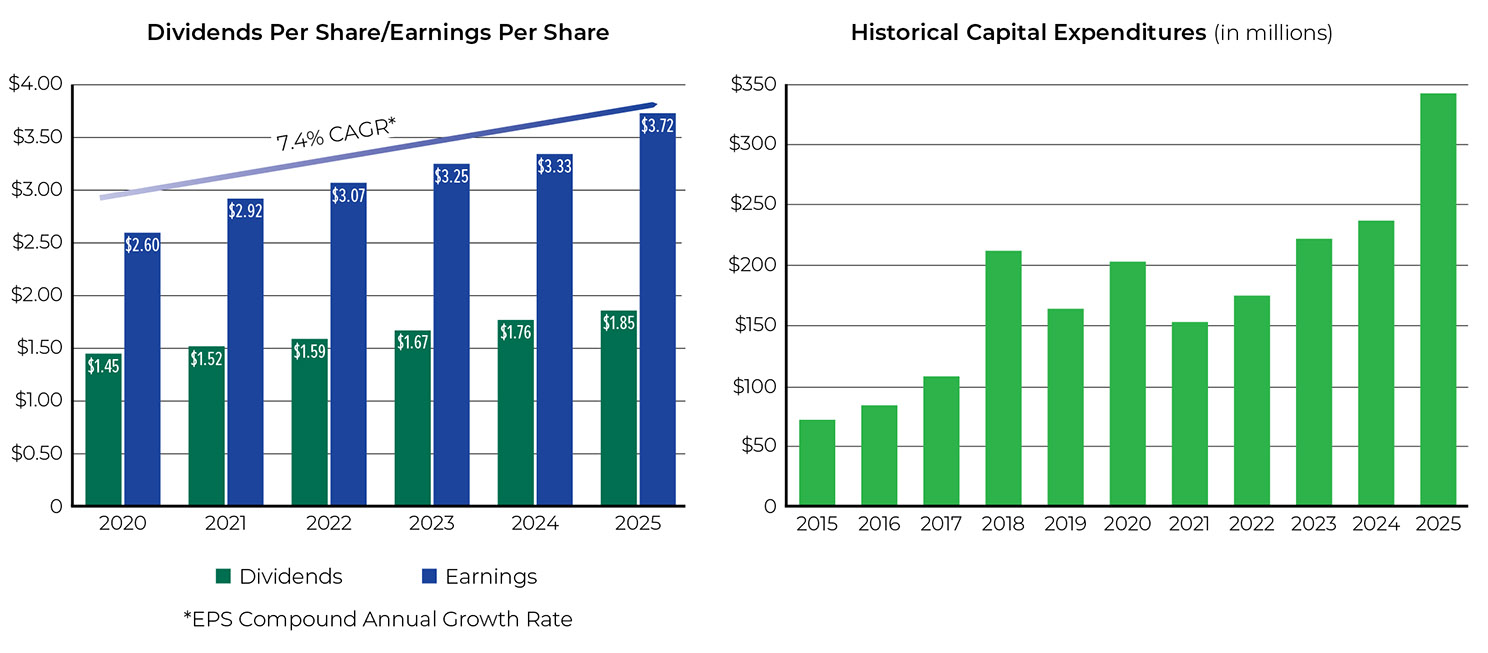
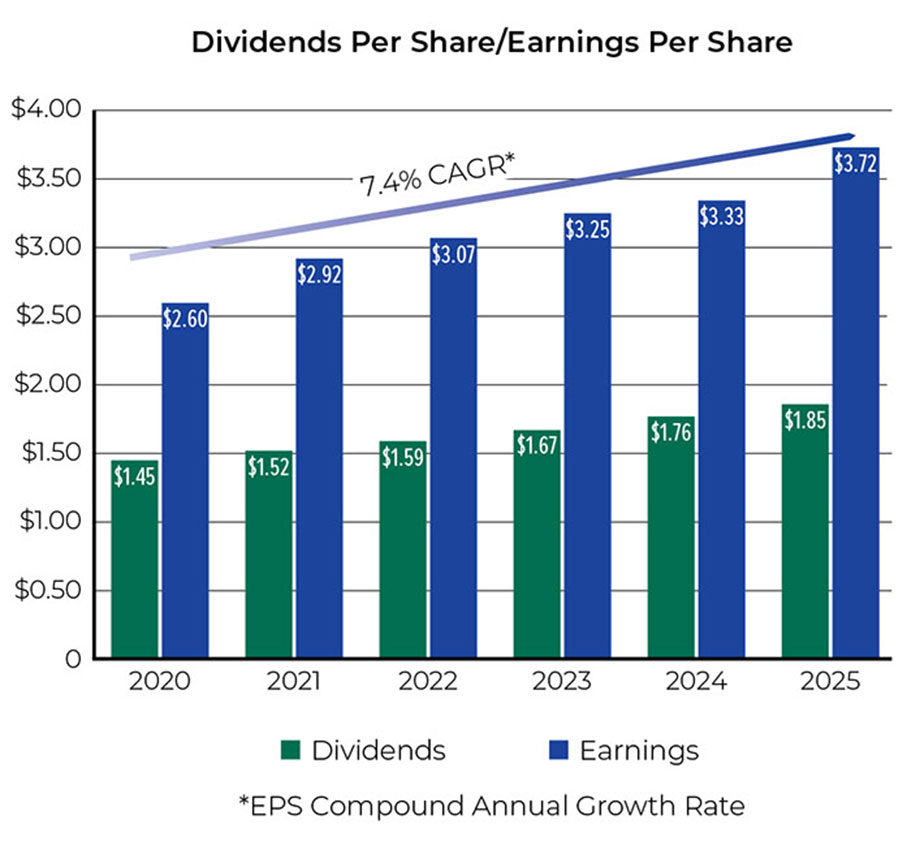
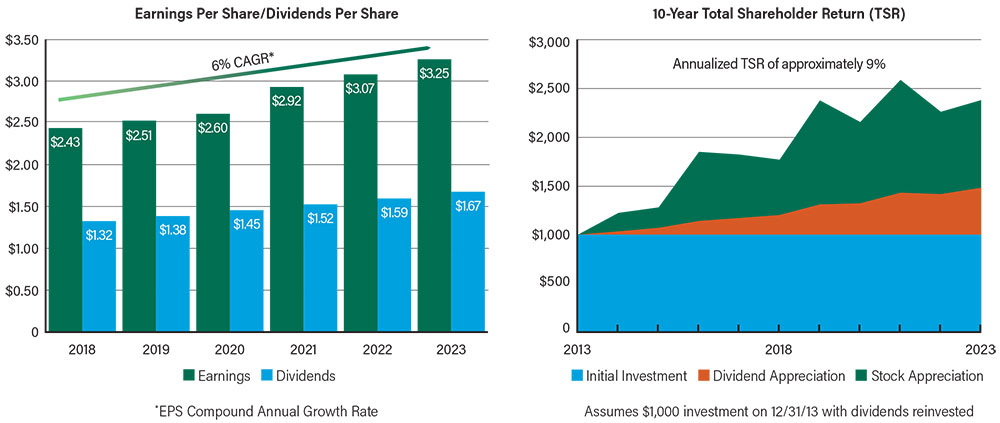
In 2023, we reported GAAP (Generally Accepted Accounting Principles) earnings of $3.25 per share, compared to $3.07 per share in 2022. Earnings for 2023 were positively impacted by an increase in electric investments included in rate base, including completion of the Red Barn Wind Farm and the second phase of the Badger Hollow Solar Farm.
Our board understands the importance of dividend growth and stock price appreciation for our investors. MGE Energy has increased the dividend for 48 consecutive years and paid dividends for more than 110 years. No other Wisconsin utility or utility holding company matches our history of dividend increases. The financial publisher Mergent consistently recognizes MGE Energy as a "Dividend Achiever."
In 2023, the board increased the annualized dividend rate by approximately 5% to $1.71 per share. In the last five years, shareholders have seen a compound annual growth rate in dividends of nearly 5%.
First-of-its-kind energy storage
In fall 2023, the Columbia Energy Storage Project was selected for a grant from the U.S. Department of Energy to support the construction of a compressed carbon dioxide long-duration energy storage system at the site of the Columbia Energy Center. If the project is approved by State regulators, it would be the first of its kind in the United States. MGE is a partner on this project with the co-owners of the Columbia plant.
The 20-MW facility would be capable of providing more than 10 hours of energy storage, enhancing reliability and dispatchability on the grid by storing energy to help meet peak demand. Located near the existing Columbia plant, the site allows for the use of existing electrical infrastructure.
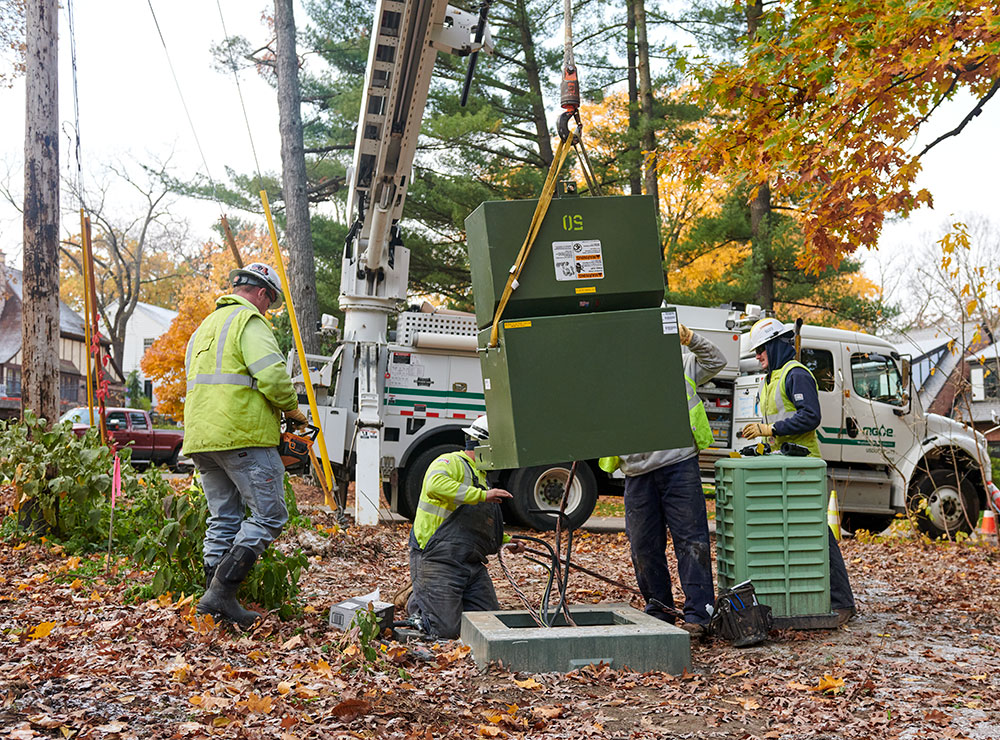
MGE's distribution system is evolving with our grid and our community. In addition to investing in renewable resources, MGE is working to upgrade its distribution system through our grid modernization projects to bring enhanced reliability and grid monitoring and control technologies to better serve customers.
Grid modernization and security
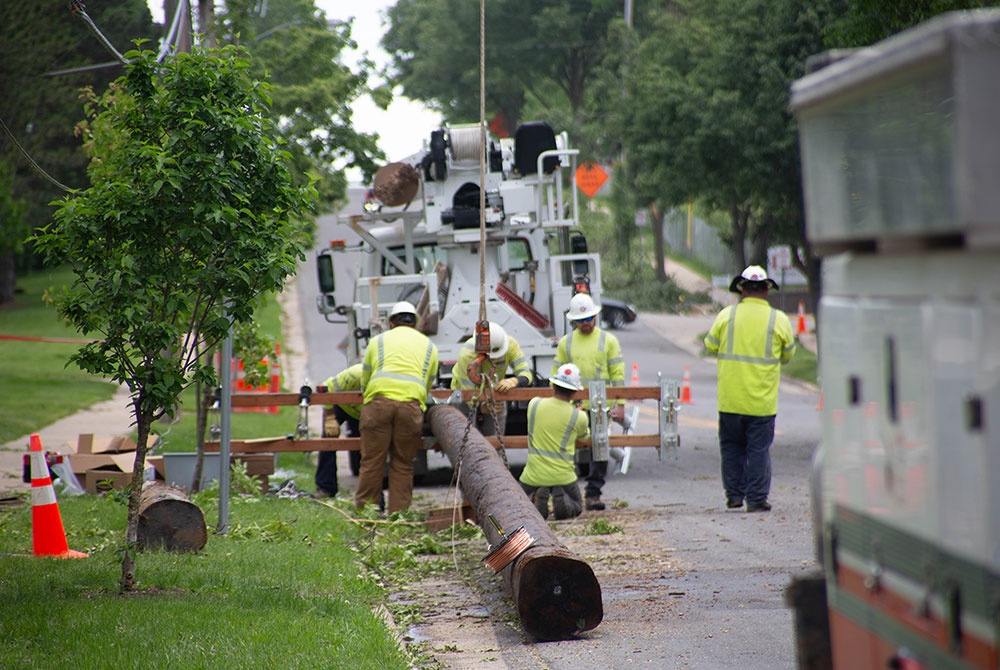
Closer to home, a multiyear grid modernization effort is underway across the Madison area to underground distribution lines, where possible, and install new grid monitoring and control technology to reduce the duration of storm-related outages. These voltage upgrade projects enhance reliability for customers but also allow for the more efficient delivery of electricity as our grid continues to evolve.
Safety, security and reliability are top priorities at MGE, where we embrace a philosophy of continuous improvement. Our grid is vital to our safety and daily life.

With a background in state law enforcement, Chris DeRemer, MGE's Security and Resiliency Planning Manager – Electric Construction and Operations, brings knowledge and expertise to MGE's ongoing efforts to secure our electric generation and electric and natural gas distribution systems.
In keeping with our commitment, we added in 2023 a new position at MGE to augment our efforts at identifying and prioritizing risk and ensuring the security and resiliency of our critical assets and other infrastructure. Chris DeRemer, MGE's Security and Resiliency Planning Manager – Electric Construction and Operations, works with our teams, including IT Security and Enterprise Systems, to protect our distribution systems as threats emerge and evolve and the number of network-connected devices on the grid continues to grow. MGE works with local, state and federal partners and with industry stakeholders to assess, strengthen and defend our physical and cyber security and to exercise coordinated response plans.
Employee engagement
"We power safety. Work safe. Home safe." That is familiar to our community at work.
Our employee-led Safety Steering Team guides our journey to safety excellence. The team examines safety topics and collaborates to identify and to prioritize continuous improvement opportunities.
In 2023, MGE's 10th Continuous Improvement Safety Team introduced an at-home safety campaign, Bring Safety Home. It features at-home safety information, tips, training, checklists and more, including videos from employees sharing their safety experiences and a safety cabinet with PPE (personal protective equipment) for employees to use at home.
Our journey to safety excellence mirrors in many ways the path of our employee-led Green Team, which celebrated its 30-year anniversary in 2023. The original Green Team initiated a successful company-wide employee effort to make environmentally responsible choices at work, including establishing a vehicle idling policy and expanding recycling efforts, among other initiatives. Today, the Green Team has grown into MGE's Sustainability Steering Team that also prioritizes engagement, improvement and benchmarking through Continuous Improvement Sustainability Teams.
Responsibility. Opportunity. Sustainability. They all are interconnected as we work to provide continued value and industry leadership and work toward our goals by connecting with our customers in new and meaningful ways, consistent with serving as your community energy company.
On behalf of our board, thank you for your investment in MGE Energy.

Jeffrey M. Keebler
Chairman, President and Chief Executive Officer

MGE serves parts of Wisconsin's fastest-growing county, Dane County. In 2023, Dane County Regional Airport, which partners with MGE on a 10-MW solar array at the airport, added a new terminal to allow for future growth. The 90,000-square-foot terminal features the Madison area’s celebrated chain of lakes in its terrazzo floor. The lakes are a recreational attraction for visitors and residents alike.
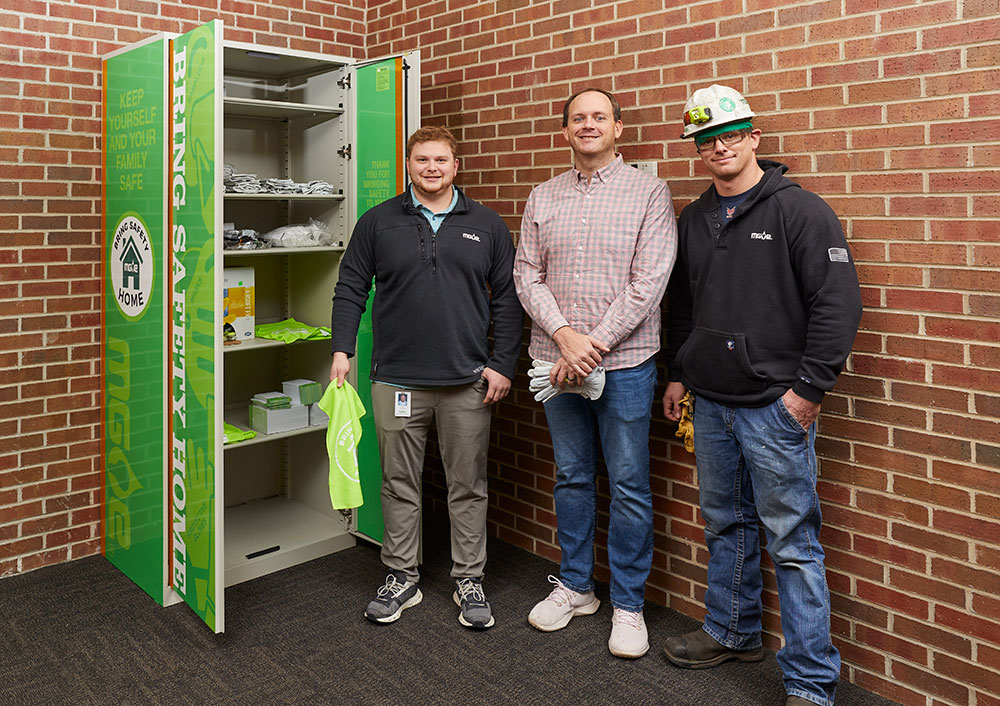
MGE's 10th Continuous Improvement Safety Team created a safety cabinet for office employees to retrieve PPE as part of the company-wide campaign to "bring safety home." (Below, from left to right) Derek Provenzano, Safety Specialist II – Safety; Dustin Joseph, Senior Financial Reporting Analyst - Financial Reporting; and Erik Nelson, Maintenance Mechanic Millwright Journeyman - Blount Operations and Maintenance; are members of the 10-person Bring Safety Home team.
A Cleaner Grid
Cost-effective renewable energy to meet the needs of all customers

Brittany Graber, Owner and President of Ulla Eyewear, powers her optical shop with renewable energy through MGE's Green Power Tomorrow (GPT) program. GPT is undergoing an update to account for MGE's growing use of renewable energy as part of the company's overall energy mix.
On Madison's West side, Brittany Graber owns and operates an optical shop, Ulla Eyewear. Originally started by her father, the family business has a commitment to customer service, community and sustainability.
Founded more than 25 years ago, the shop is focused on its future and its impact. Graber supports renewable energy from MGE. Ulla Eyewear is one of more than 10,000 MGE electric residential and business customers enrolled in the company's long-standing Green Power Tomorrow (GPT) program.
Participating customers pay about a penny more per kilowatt-hour to support clean energy. Customers select either a fixed amount of kilowatt-hours per month or a fixed percentage of their monthly energy usage for participation under GPT. The program offers a way to support clean energy that's flexible and affordable.
In 2024, GPT is undergoing an update to reflect MGE's growing use of renewable energy as part of the company's overall energy supply mix. The new option automatically tailors a customer's percentage participation to account for the percentage of MGE's energy mix served by renewable resources. As the company's use of renewables continues to grow, customers who are subscribed to receive 100% of their electricity under GPT will see their percentage participation decrease over time.
MGE continues to grow its use of renewable resources to serve all customers. Under our 2030 commitment, every MGE electric customer will have 80% fewer carbon emissions from their electricity use simply by being an MGE customer. By 2050, MGE will have eliminated the carbon footprint associated with each customer’s electricity use under our net-zero carbon goal. MGE continues to offer options to serve customers who want 100% renewable energy today. GPT is one of those programs.
Innovative customer options
MGE's New Product Development team collaborates with others across the company to introduce new programs, products and services that provide customers value and help enable MGE's transition toward net-zero carbon electricity. Our customers are active participants in our clean energy transition and shared energy future.
GPT and the company's related Renewable Flat Bill offering make it easy for customers who want to support renewable energy. MGE's Renewable Flat Bill option offers eligible residential customers renewable energy and a fixed monthly electric bill based on their expected energy usage. It is another way MGE meets customers’ needs and preferences by providing renewable energy at an affordable cost.
Local generation investments
The company's newest local project, Tyto Solar, is a 6-megawatt (MW) solar array in Fitchburg, Wis. It is part of approximately a billion dollars in investment in clean energy and battery storage expected from 2015—when MGE announced its Energy 2030 framework—through 2028.
Cost-effective renewable energy will play a significant role in helping MGE achieve our industry-leading clean energy goals of at least an 80% reduction in carbon emissions by 2030 (from 2005 levels) and net-zero carbon electricity by 2050.
Tyto Solar is connected directly to MGE's distribution grid. MGE has invested in a total of more than 50 MWs of local solar energy on our community grid.
Our community solar projects serve our Renewable Energy Rider and Shared Solar programs. With Shared Solar fully subscribed, MGE expects to seek approval in 2024 for an additional Shared Solar option. Both voluntary programs offer customers the opportunity to grow clean energy generated in our communities.
West of Tyto Solar is MGE's 22-MW O'Brien Solar Fields. The array came online in 2021 as the largest solar project in Dane County. Through Renewable Energy Rider agreements, the O'Brien Solar Fields serves several large customers, including the University of Wisconsin-Madison, the State of Wisconsin Department of Administration, the City of Fitchburg and other major customers. The O'Brien project is one of four local solar facilities serving Renewable Energy Rider customers, which also include Dane County, the City of Madison, the Madison Metropolitan School District, the City of Middleton and the Middleton-Cross Plains Area School District.

Zach Billings, Manager New Product Development - Customer Experience and Energy Services (second from right), facilitates discussion with MGE’s New Product Development team. The team works to identify ways to provide customer value. Pictured from left to right: Nicole Mosteller, Associate Product Manager; Brendon Fanning, Customer Insight Analyst; and Tarek Salameh, Product Manager.
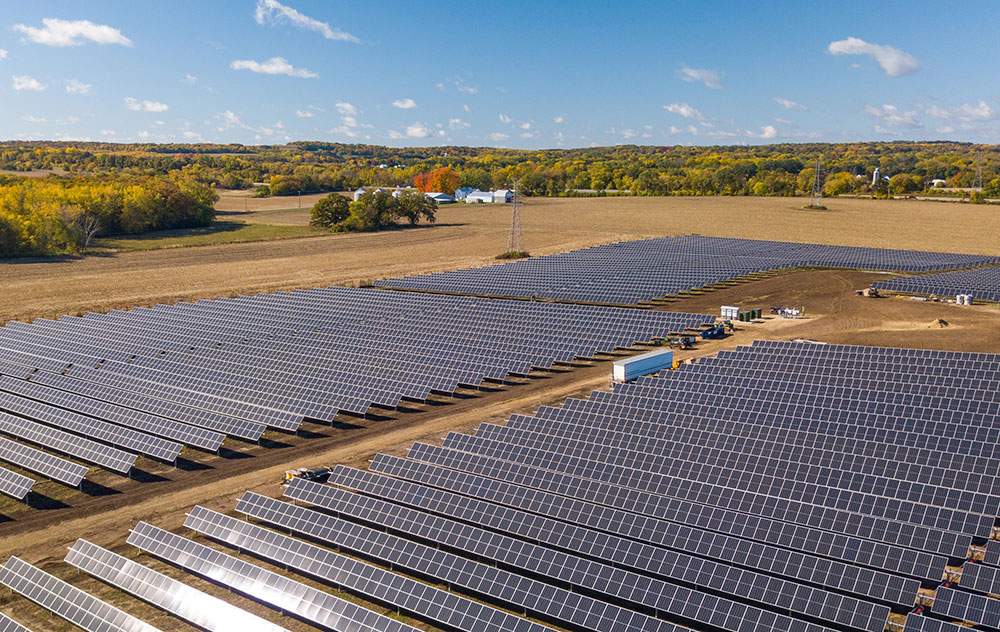
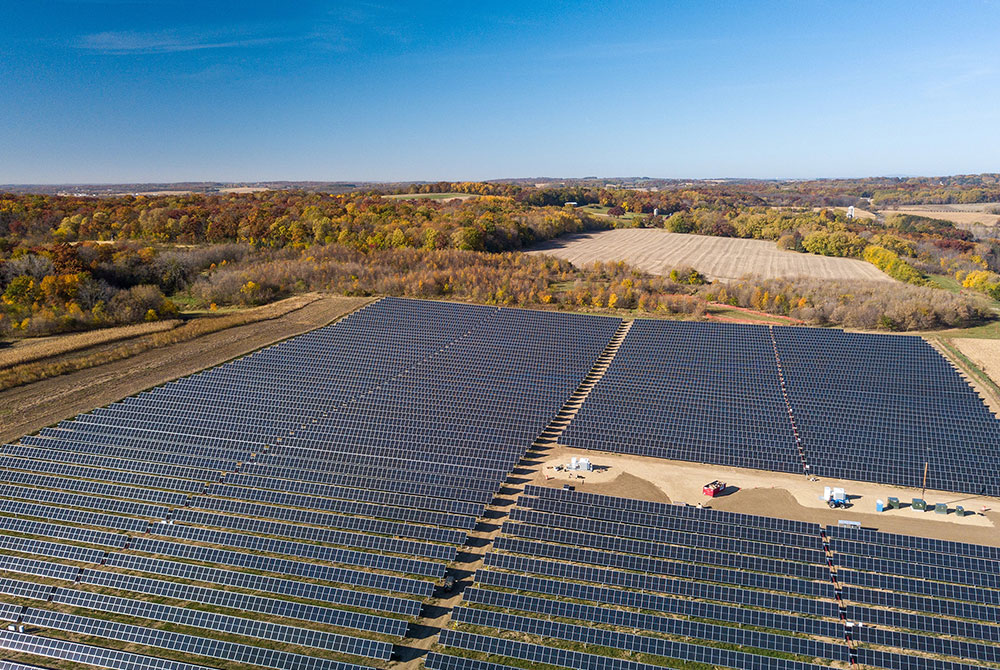
The 6-MW Tyto Solar project (above) in Fitchburg, Wis., came online in early 2024. It joins MGE's growing use of solar energy, which includes the Badger Hollow Solar Farm. The second phase of the Badger Hollow project became operational in late 2023.
An Efficient Grid
Smart solutions to help customers manage their energy use
A modern, more integrated grid is efficient, connected and smart. MGE serves as conductor of an increasingly digitally connected grid, balancing energy supply resources and customer demand. Resources, tools and programs to help customers manage their use and to help MGE manage the grid more efficiently serve to ensure the grid operates safely, reliably and cost-effectively.
MGE is part of a collaboration with the energy nonprofit Slipstream Group, Inc., the City of Madison and others to convert several City facilities to "grid-interactive" efficient buildings to manage on-site electric usage with cutting-edge software controls and platforms. As MGE invests in a cleaner grid on behalf of all customers, collaborations like this one help advance energy efficiency and electrification—two other key strategies for working together with customers to achieve shared energy goals.
The multiyear Connected Communities demonstration project explores the use of smart technologies as well as data analytics to facilitate energy and cost savings and demand flexibility to manage when buildings use energy. By better managing how and when buildings use energy, MGE can enable a more sustainable, cost-effective grid for the benefit of all customers.

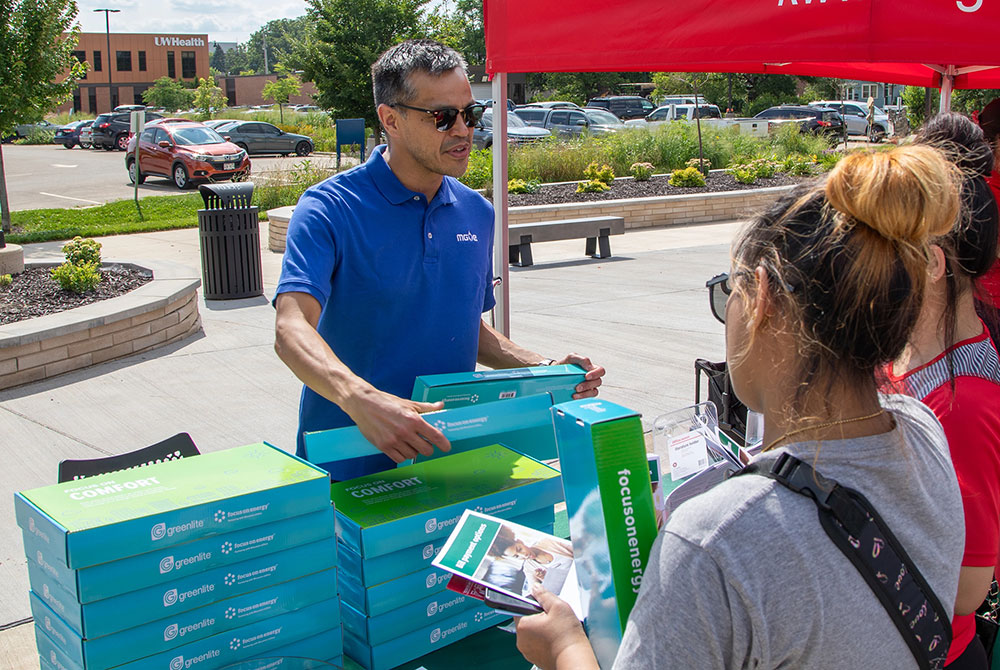
Dale Rhodes (left), Facilities Services Coordinator at Middleton-Cross Plains Area School District, and Todd Duquette, Operations Supervisor in Facility Services, help manage energy use at district facilities. A new program through MGE's partnership with FOCUS ON ENERGY® combines data analytics with guidance on low- and no-cost strategies to reduce their facilities' energy use and to find cost savings.
Partnerships to advance energy efficiency
Kromrey Middle School in the Middleton-Cross Plains Area School District (MCPASD) has a history of embracing sustainability. The school is powered by renewable energy through the district's partnership with MGE on the Morey Field Solar project at the Middleton Municipal Airport. A share of MGE's 6-megawatt (MW) array serves the district and the City of Middleton under Renewable Energy Rider agreements with MGE.
MCPASD facilities staff also prioritize energy conservation. The district is participating in a Virtual Commissioning™ (VCx™) Energy Efficiency Program through MGE's partner in energy efficiency, FOCUS ON ENERGY®. The program builds on the use of smart technology to engage customers in energy usage analytics to improve their operations. According to Focus on Energy, the program averages an annual energy use reduction of 14% for participants.
Facilities Manager Dale Rhodes receives energy data and analysis and guidance on low- and no-cost strategies for energy savings, such as fine-tuning when Kromrey's HVAC units start up. Programs like VCx make it easier for customers to manage their energy use to reduce their carbon footprint and their costs.

The Mullins Group, a real estate development and property management company, uses MGE’s MyMeter dashboard for energy benchmarking. In 2024, a new City of Madison benchmarking ordinance for some commercial buildings, including the Park Hotel on the Capitol Square, took effect. Pictured from left to right: Luis Abrajan, Susan Springman and Jay Mullins of the Mullins Group.
New tool to streamline energy benchmarking for businesses
More than a decade before electric utility service came to downtown Madison, the Park Hotel opened in 1871. The large corner building bills itself as the only hotel on the Capitol Square to this day. The hotel is one of a number of commercial and residential properties operated by the family-owned Mullins Group, a local real estate development and management company. With each property comes the demand for efficient—and effective—energy management.
MGE's new online resource, MyMeter®, provides business customers the capability to view their energy usage in as short as 15-minute intervals to help them control their usage during on-peak periods. MGE then works with customers to develop energy-saving strategies that fit their business and budget.

The Park Hotel, located on the Capitol Square in downtown Madison.
The hotel is among the Mullins Group's properties required to benchmark its energy use under a new City of Madison ordinance. MyMeter helps businesses with compliance and with their own sustainability goals.
When customers manage their use, especially during peak, MGE is able to manage demand on the grid more effectively, which helps maintain energy affordability for all customers.
Technologies to enable a more integrated grid
Households served by MGE also are having an impact by participating in the company's smart thermostat program, MGE Connect®. Residential electric customers who enroll allow MGE to manage their Wi-Fi-enabled thermostats remotely on the hottest days of the summer to help reduce peak demand.
MGE is partnering with the local nonprofit Project Home to bring smart thermostats to households that qualify for energy assistance. The collaboration brings convenient, energy-saving smart technology to more households to reduce our collective use of energy—a key objective under MGE's Energy 2030 framework.
"With oversight of dozens of properties, energy management is a sizable task. MyMeter will make compliance with the new benchmarking ordinance easier to navigate."
—Sue Springman, Mullins Group

MGE is partnering with the City of Madison and others in a multiyear demonstration project, Connected Communities, to facilitate "grid-interactive" efficient buildings to manage on-site electric usage with cutting-edge software controls and platforms.
A Reliable Grid
Top-ranked reliability to help enable a transition in transportation
Your community energy company's fundamental obligation is to provide customers with safe and reliable energy. As MGE pursues cost-effective, sustainable energy to serve all customers safely and reliably, the company continues to help fuel a transition toward cleaner transportation.
The electrification of transportation is a key strategy for reducing carbon emissions and an opportunity for generating market growth. With a consistent record of top-ranked electric reliability, MGE is prepared to meet the demands of electric transportation.
In 2022, the most recent data year available, MGE's electric service reliability ranked second for the fewest number of outages per customer, according to an annual industry survey of more than 75 investor-owned electric utilities nationwide. MGE has ranked in the top three utilities in the country for the fewest number of outages for more than 15 years.

Matt Parks (foreground), Master Electrician, and Mathias Kranz, Journeyman Electrician, both with the City of Madison Engineering Division, finish installation of a charging station provided by MGE to power the City's first electric refuse trucks, expected in 2024.
Partners in electrification
Safe, reliable, affordable and sustainable energy powers the essential services of our first responders and others who provide for the quality of life throughout our communities.
The City of Madison's Fleet Service has an ambitious goal—zero gas-powered vehicles in its fleet by 2030. The City is working to lead the charge toward electrification—with help from MGE.
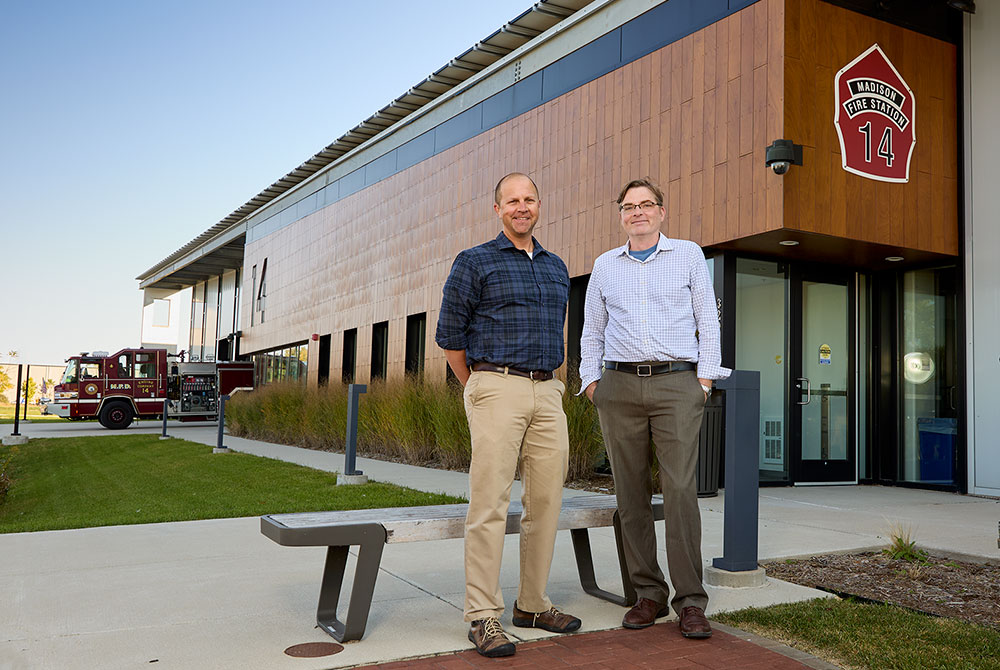
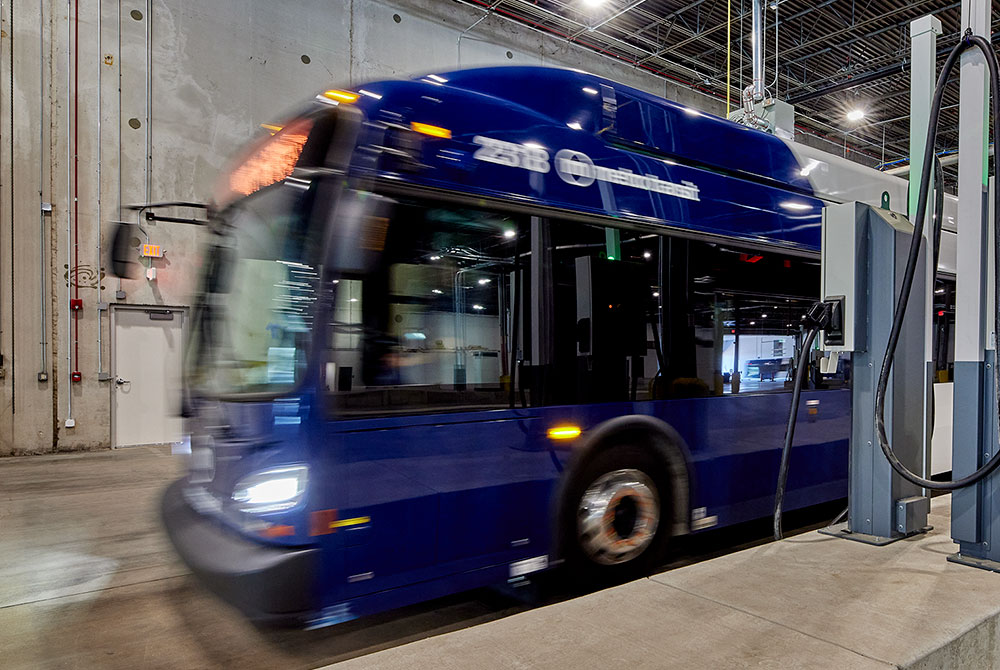
MGE has provided charging infrastructure for the City's first three all-electric buses serving Metro Transit, a plug-in hybrid engine at the Madison Fire Department and the City's new electric refuse trucks. In 2024, the City's Fleet Service expects to put its first two electric refuse trucks to work doing pickups. The electric truck for a typical residential route is expected to handle more than 700 pickups per day.
Transportation is the leading contributor of greenhouse gas emissions in the country. Beyond the environmental benefits, fleet officials say electric light- and heavy-duty vehicles offer fuel and maintenance cost savings.
Accessible charging key to electric vehicle (EV) growth
Another collaboration with the City of Madison is helping to facilitate access to convenient new curbside charging.
A first of its kind in the Madison area, MGE's newest public charger is attached to an existing MGE utility pole to offer curbside charging on the city's East side. Drivers use an app to lower the charging cord to their vehicle.
MGE, in partnership with the City, is exploring the use of pole-mounted charging stations in neighborhoods lacking access to charging. About 80% of EV charging happens at home. MGE's curbside charger gives drivers, who may live in a multifamily dwelling without a garage or dedicated parking, a convenient way to power their vehicle—and to do it sustainably.
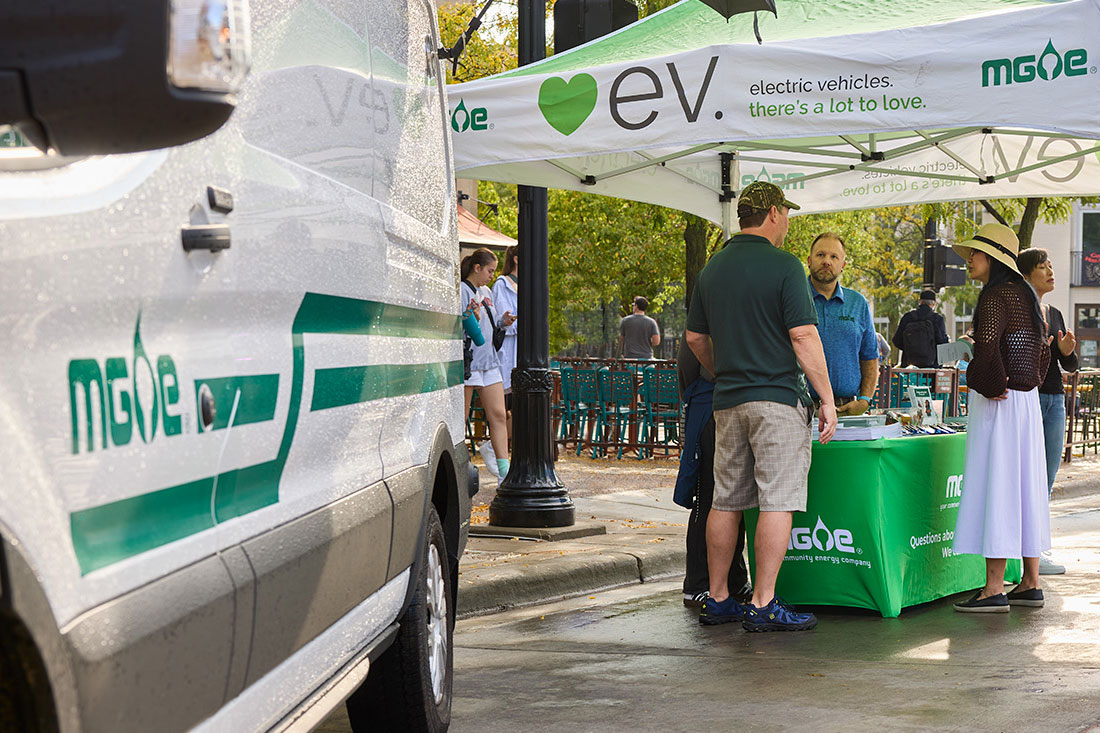
MGE's more than 50 public charging stations throughout the greater Madison area are powered by renewable energy. That includes MGE's Fast-Charging Hub in downtown Madison. Home to eight fast-charger stalls, the Hub offers some of the most powerful chargers in the Midwest.

Dipesh Navsaria participates in MGE's Charge Ahead, a managed charging program for residential customers with EVs. MGE also is working with business and fleet customers to expand managed charging, which gives MGE the opportunity to manage demand for electricity to charge EVs and, in turn, long-term costs for all customers
Managed charging to help manage costs
As more drivers and fleets transition to EVs, MGE is working with business and residential customers, employers and multifamily property owners to facilitate managed charging.
Drivers charge when it is convenient, which makes demand for electricity for charging unpredictable. MGE customer Dipesh Navsaria says he prefers to charge his EV at home overnight.
Navsaria participates in MGE's Charge Ahead for residential customers. Charge Ahead uses a software platform to communicate with his vehicle, allowing MGE to manage when the vehicle is charging. Navsaria uses the app to set when he needs his vehicle fully charged, and MGE handles the rest.
By working with customers to manage charging to correspond to the needs of the electric grid, MGE is able to shift charging to lower-cost periods, when demand for electricity is lower—and typically lower cost. This helps manage costs for all customers long-term by reducing the need for electric system upgrades and new generation facilities to meet peak demand. MGE is seizing new opportunities to provide value to customers while advancing shared sustainability goals.
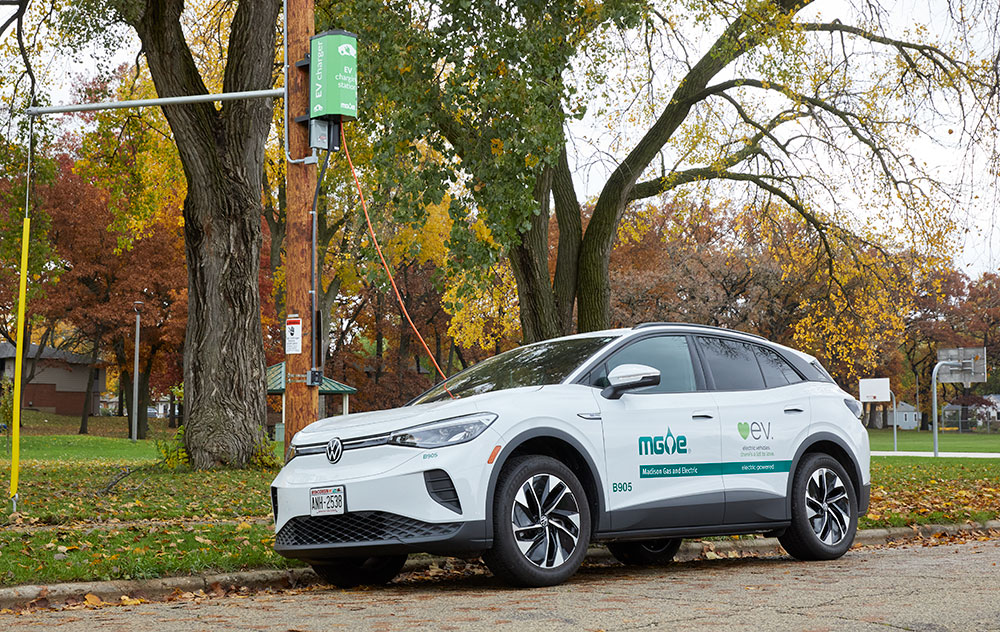
MGE's newest public charging station is attached to an existing utility pole to offer convenient curbside charging. In partnership with the City of Madison, MGE is adding pole-mounted chargers in areas without easy access to charging, like the Darbo - Worthington neighborhood on the city's East side.
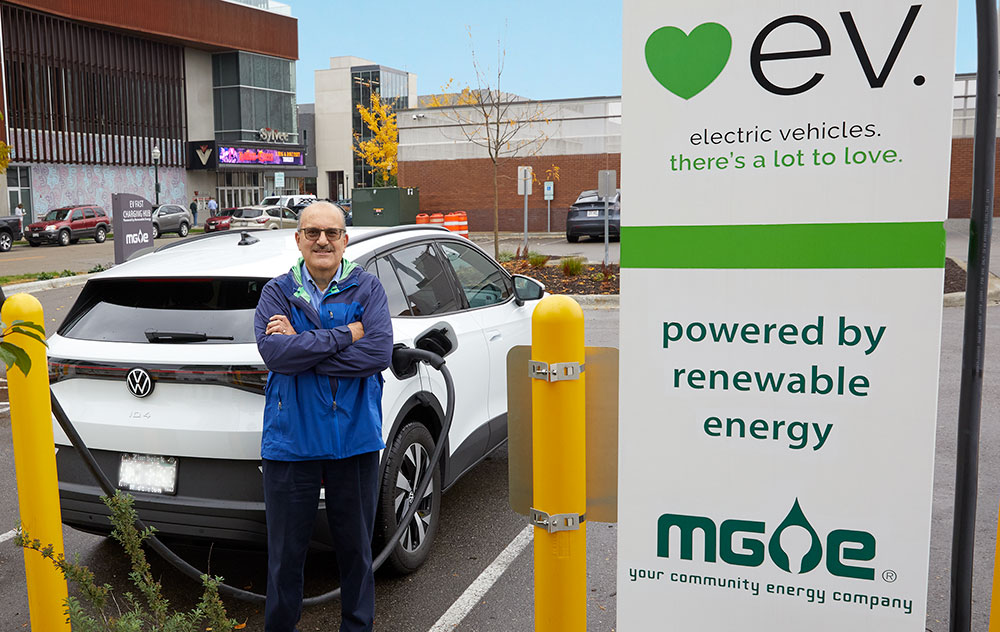
MGE Senior Community Services Manager Dave Benforado helps educate customers about EV charging options, including MGE's Fast-Charging Hub in downtown Madison, which features some of the most powerful chargers in the region.
A Modern Grid
For an engaged community

Executive Director Dr. Karen Menéndez Coller, PhD (above right), is overseeing Centro Hispano's expansion to a new building to better serve its thousands of clients annually. MGE works with staff at the nonprofit to help connect with MGE's growing base of Latino customers.
On a sunny fall morning, the front door at Centro Hispano (Centro) on Madison's South side sees plenty of traffic. Clients come and go as staff huddle for a midweek team update.
The nonprofit provides various youth, adult workforce and family support programs to more than 7,000 people each year. It serves Dane County’s growing Latino population in Wisconsin's most rapidly growing county. In the last 10 years, Centro has doubled its number of programs.

Centro Hispano's new, expanded space in Madison offers increased accessibility, sustainability and support for Dane County's growing Latino population.
MGE partners with Centro and other local organizations to meet customers where they are. Whether around energy safety, energy efficiency and conservation, energy assistance, or new programs, products and services, MGE's Residential and Community Services team works to engage our communities in meaningful ways to understand and to meet our customers' unique needs and to develop culturally competent initiatives and communications. Evolving with our community is how MGE will continue to ensure all customers experience MGE as their community energy company into the future.
With support from the MGE Foundation and others, Centro continues to build on its 40-year legacy with a new, expanded space. Located around the corner from the existing facility, Centro's new home will offer increased accessibility, sustainability and support for generations to come.

MGE Residential Energy Engineer Laura Paprocki talks to customer Laura Bodine about Bodine's dual-fuel heat pump at her Fitchburg home while video producer Phil Levin records for MGE's Green View video series. The series is one of the many ways in which MGE connects with customers to help them use energy wisely, become familiar with new technologies and advance shared goals.
Expertise to share new sustainable technologies
As an MGE energy expert, Residential Energy Engineer Laura Paprocki engages with hundreds of customers each year either by phone, by email or in person. From HVAC to solar power to energy efficiency and beyond, Paprocki fields questions about energy technologies, old and new.
That's how she met Laura Bodine who contacted MGE with questions about how to run her new heat pump most efficiently at her family's Fitchburg home. Bodine replaced the aging furnace in her family's 1970s home with a dual-fuel heat pump, which combines a heat pump fueled by electricity with a gas-powered furnace. The heat pump handles summer cooling and fall and spring heating. The furnace kicks in during the coldest days of the year.
With many customers seeking answers to questions about new, sustainable technologies, Paprocki answers their questions directly as well as through MGE's long-running Green View video series. For one installment, Paprocki asked Bodine to share her experience to help inform other customers who may be interested but unfamiliar with the benefits of heat pump technology.
MGE's Green View series features electric vehicles and charging, smart home technologies, renewable energy and more. It is one of the many ways in which MGE seeks to connect with our community to meet customers where they are and to work together toward shared goals.
"We all interact with energy every day. We all have the opportunity to be active participants in how we manage our collective energy use. I appreciate the opportunity to engage our customers in meaningful ways to build relationships around energy and our shared future."
—Laura Paprocki, MGE Residential Energy Engineer
Community education a cornerstone of your community energy company
Another way in which Paprocki connects is through MGE's youth programming.
One late September afternoon, Paprocki and fellow MGE Residential Energy Engineer Leah Samson unloaded their equipment at Sherman Middle School on Madison's North side. The two were invited by eighth grade teacher Mary Shampo for a presentation about renewable energy.
With help from MGE's mobile solar oven and Pedal Power bicycle, Samson and Paprocki used hands-on—and legs-on—tools to keep the students focused on energy. By pedaling, the students used their own physical energy to power the bicycle, which produces electricity for a variety of different loads, including incandescent, LED and CFL light bulbs—and, in this case, a blender to make salsa for the class.
Energy efficiency is one of MGE's key strategies for achieving its carbon reduction goals. By working together with our customers—and future generations—to use energy wisely and to advance energy efficiency and the electrification of transportation, we can help create a more sustainable future.
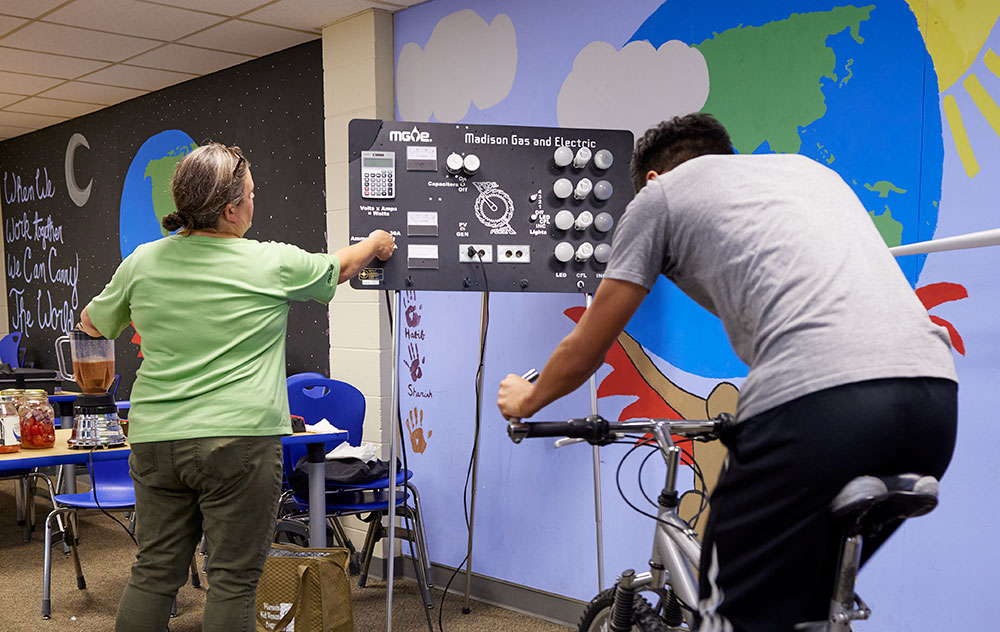
Leah Samson, who also serves as a Residential Energy Engineer, engages with our community's youngest energy users with help from MGE's Pedal Power bicycle at Sherman Middle School in Madison.
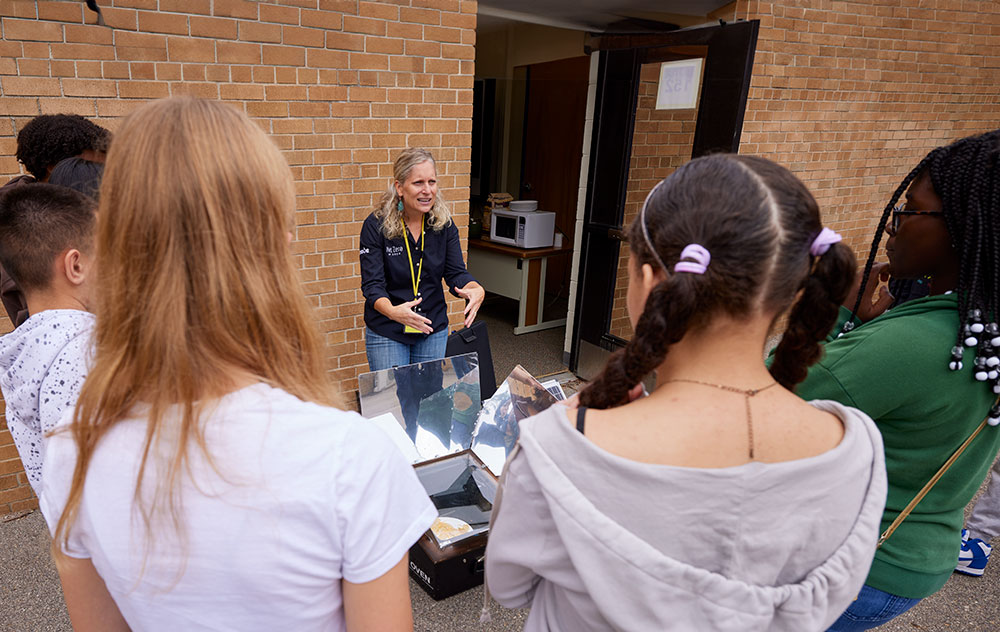
Laura Paprocki discusses renewable energy at Sherman Middle School in Madison with the help of MGE's mobile solar oven.
Corporate leadership
Directors of MGE Energy and MGE

Patricia K. Ackerman*
Retired Senior Vice President, Investor Relations, Corporate Responsibility and Sustainability and Treasurer at A.O. Smith
Age 66
MGEE Director since 2024

Marcia M. Anderson
Retired Clerk of Court of U.S. Bankruptcy Court - Western District of Wis., retired Major General in the U.S. Army
Age 68
MGEE Director since 2018

James G. Berbee
Former Chairman and CEO of Berbee Information Networks Corp., physician and Chair of the Wisconsin Alumni Research Foundation
Age 63
MGEE Director since 2018

Mark D. Bugher
Retired Director of University Research Park, University of Wisconsin-Madison
Age 78
MGEE Director since 2010

Londa J. Dewey
Chief Executive Officer of QTI Management Services, Inc., a human resources and staffing company
Age 66
MGEE Director since 2008

Jeffrey M. Keebler
Chairman, President and Chief Executive Officer of MGE Energy, Inc., and Madison Gas and Electric Co.
Age 54
MGEE Director since 2017

Daniel J. Kelly*
Retired Chief Underwriting Officer and former Chief Financial Officer at American Family Insurance, CPA
Age 64
MGEE Director since 2024

James L. Possin
Certified Public Accountant and tax consultant with James L. Possin CPA, LLC. Former partner at Grant Thornton LLP
Age 75
MGEE Director since 2009

Angela S. Rieger*
Executive Vice President, Chief Transformation Officer at Lands’ End, board member of Thrivent, American Family Children’s Hospital Development Partners Advisory Board
Age 59
MGEE Director since 2024

Thomas R. Stolper
Former Executive Vice President and Director of ProActive Solutions USA LLC, management consultant at Purple Cow Organics and formerly at Deibel Laboratories
Age 78
MGEE Director since 2008

Gary J. Wolter
Former Chairman, President and Chief Executive Officer of MGE Energy, Inc., and Madison Gas and Electric Co.
Age 72
MGEE Director since 2000

Noble L. Wray
Retired Chief of Police, City of Madison Police Department, Governor's Pardon Advisory Board member
Age 65
MGEE Director since 2021
*Appointments effective March 1, 2024.
Note: Ages as of Dec. 31, 2023.
For detailed information on board members, see the MGE Energy Proxy Statement
.
Officers of MGE Energy and MGE
Jeffrey M. Keebler*
Chairman, President and Chief Executive Officer
Age 54
Service since 1995

Lynn K. Hobbie
Executive Vice President - Marketing and Communications
Age 68
Service since 1985

Cari Anne Renlund*
Vice President – General Counsel and Secretary
Age 53
Service since 2015

Jared J. Bushek*
Vice President – Chief Financial Officer and Treasurer
Age 45
Service since 2010

Tamara J. Johnson*
Vice President - Chief Accounting Officer and Controller
Age 61
Service since 1993

James J. Lorenz
Vice President - Energy Operations
Age 60
Service since 1987

Scott R. Smith
Vice President - Business and Regulatory Strategy
Age 54
Service since 2017

Melissa T. Garner
Assistant Vice President - Human Resources
Age 45
Service since 2013

John A. Jicha
Assistant Vice President - Energy Supply
Age 53
Service since 2005

Bryan R. Sullivan
Assistant Vice President - Chief Information Officer
Age 54
Service since 2018

Ted L. Wadzinski
Assistant Vice President - Gas Operations, Measurement and Operations Support
Age 62
Service since 2011
*Officers of MGE Energy and MGE. All others are MGE officers.
Note: Ages as of Dec. 31, 2023.
Shareholder information
2024 Annual Shareholder Meeting
Tuesday, May 21, 2024
Please see the Proxy Statement
for annual meeting information.
Stock Listing
- MGE Energy common stock trades on The Nasdaq Stock Market®
- Stock symbol: MGEE
- Listed in newspaper stock tables as MGE
Shareholder Account Information
Please notify us promptly if:
- A stock certificate is lost or stolen.
- A dividend check or statement is not received within 10 days of the scheduled payment date.
- Your name or address changes.
Online Account Access
MGE Energy's transfer agent, Computershare, provides registered shareholders with secure online account access. Shareholders may view share balances, manage their portfolio, access tax forms, update personal information and more.
Visit computershare.com