LITE
Fiscal year ends June Quarters are offset from the calendar — Q1 is Jul–Sep

Lumentum Holdings Inc. is a provider of optical and photonic technologies serving cloud, artificial intelligence, telecommunications, consumer, and industrial markets. The company operates in a single reportable segment, offering Components such as semiconductor laser chips, laser sub-assemblies, and wavelength management systems, as well as Systems including optical modules, optical circuit switches, and industrial lasers like short-pulse solid-state and kilowatt-class fiber lasers. These products enable high-capacity optical links for data center interconnect, AI/ML workloads, and communications networks spanning access, metro, long-haul, and submarine infrastructure. Lumentum also supplies laser emitters for 3D sensing in consumer electronics and precision material processing solutions for semiconductor fabrication, electric vehicle production, and metal cutting. Incorporated in 2015 as a subsidiary of JDS Uniphase Corporation, the company became independent through a spin-off in August 2015. Since then, it has expanded its portfolio through acquisitions of Oclaro, NeoPhotonics, IPG Photonics’ telecom transmission product lines, and Cloud Light Technology Limited. Lumentum serves customers including cloud and network service providers, AI infrastructure providers, and network equipment manufacturers, with manufacturing capabilities in North America, Asia-Pacific, and Europe.

Summarised from the company's own disclosures, fiscal year ended Aug 2026

Industry Electronic Components Homepage lumentum.com
Sector Technology IR page investor.lumentum.com/overview/default.aspx
Tags
optical transceivers, industrial lasers, 3d sensing, data center interconnect, photonic integrated circuits, fiber lasers, solid-state lasers, wavelength management, ai infrastructure, telecommunications equipment, Oclaro, NeoPhotonics, Cloud Light Technology Limited, IPG Photonics, JDS Uniphase, Viavi Solutions, Astera Labs, Corning, Qualcomm
Press page lumentum.com/en/newsroom

Metrics

Valuation  
Market cap $ 51.314B
Market cap (USD) $ 51.314B
P/E -6.33
PEG —
P/BV 11.22
P/S 17.03
P/OCF 68.29
P/FCF 170.99
Dividend yield —
Turnover / mcap —
Returns  
ROE -240.0%
ROI -110.4%
ROIC 6.3%
Profit margin -230.1%
Growth  
Revenue growing Yes
Profits growing No
Revenue up 3y No
Revenue up 5y No
Earnings growth 3y (net profit CAGR) —
Quality  
Profitable No
Margin expanding Yes
Buying back stock No
Diluting (TTM) Yes
Debt/Equity 30.6%
Podcast bulls (TTM) Sign up
Podcast bears (TTM) Sign up
Podcast sentiment (TTM) Sign up
Podcast sentiment % (TTM) Sign up
News sentiment (TTM) 38
Quality score -50.0%
Insiders  
Buys, 1w Sign up
Buys, 1m Sign up
Buys, 1y Sign up
Sells, 1w Sign up
Sells, 1m Sign up
Sells, 1y Sign up

Sign up to see this company's insider trades

Figure FY 2026 FY 2025 FY 2024 FY 2023 FY 2022 FY 2021 FY 2020 FY 2019 FY 2018 FY 2017 FY 2016 FY 2015 FY 2014
Revenue 3.014B 1.645B 1.359B 1.767B 1.713B 1.743B 1.679B 1.565B 1.248B 1.002B 903M 837.1M 817.9M
Net profit -6.935B 25.9M -546.5M -131.6M 198.9M 397.3M 135.5M -36.4M 248.1M -102.5M 9.3M -3.4M 10.7M
Free cash flow 300.1M -104.7M -108.3M 51.3M 368.1M 653.9M 438.3M 164.1M 154.3M -53.1M 4.6M -44.4M -1.4M

Figure FY 2026 FY 2025 FY 2024 FY 2023 FY 2022 FY 2021 FY 2020 FY 2019 FY 2018 FY 2017 FY 2016 FY 2015 FY 2014
Share price 858.06 95.06 50.92 56.73 79.42 82.03 81.43 53.41 57.9 57.05 24.2 — —
Price performance 12m 8.03 0.87 -0.1 -0.29 -0.03 0.01 0.52 -0.08 0.01 1.36 — — —

Filed figures

Figure Jun 2017 Jun 2018 Jun 2019 Jun 2020 Jun 2021 Jun 2022 Jun 2023 Jun 2024 Jun 2025 Jun 2026
Balance sheet detail
Trade receivables (USD) 166M 197M — — — — — — — 0.00
↳ YoY growth -2.5% +18.5%
Borrowings, current (USD) — — — — — 410M — 0.00 21.2M 3.19B
Borrowings, non-current (USD) — — — — — 1.47B — 2.5B 2.56B 40.5M
Lease liabilities (USD) — — 400,000 69M 59.4M 60M 62.1M 56.4M 35M 33.8M
Cash and deposits (USD) 273M 397M 433M 298M 774M 1.29B 859M 437M 521M 2.04B
Intangible assets (USD) 10.1M 7M 395M 317M 241M 156M 459M 618M 465M 327M
Right-of-use assets (USD) — — 91.5M 78.7M 67.4M 73.6M 77.3M 72.8M 27.9M 29.2M
Net debt (borrowings + leases - cash) (USD) — — — — — 646M — 2.12B 2.1B 1.22B
Cash flow detail
Operating cash flow (USD) 85M 248M 330M 524M 739M 459M 180M 24.7M 126M 751M
Purchases of property, plant and equipment (USD) -138M -93.2M -166M -86M -84.8M -91.2M -129M -133M -231M -451M
Purchases of intangible assets (USD) — — — — — 0.00 0.00 -4M 0.00 0.00
Change in receivables (cash effect) (USD) 4.2M -30.8M 27.7M 5M 20.2M -49.2M 83.2M 72.3M -58.7M -270M
Change in inventories (cash effect) (USD) -41.7M -7.7M 40.6M 32.7M -6.6M -51.8M -81.5M 73.8M -71.3M -228M
Change in payables (cash effect) (USD) -16.9M 4.8M -10.6M -11.7M -34M 47M -74M -89.7M 69.2M 222M
Share buybacks (cash effect) (USD) — 0.00 0.00 -200M -236M -544M -176M 0.00 0.00 —
Interest paid (cash effect) (USD) 0.00 -1.3M -15.1M -13.4M -6.4M -7.5M -10.8M -19.7M -19.1M -15.7M
Income taxes paid (cash effect) (USD) -9.5M -12.7M -8.7M -7.6M -50M -57M -67.3M -61.2M -20.6M -46.7M
Share-based compensation (USD) 32.7M 46.8M 60.7M 73.2M 92.9M 103M 148M 129M 177M 170M
Operating cash flow before change in receivables (USD) 80.8M 278M 302M 519M 719M 509M 96.6M -47.6M 185M 1.02B
Free cash flow (OCF - PPE - intangibles) (USD) -53.1M 154M 164M 438M 654M 368M 51.3M -112M -105M 300M
Income detail
Research and development expense (USD) 148M 157M 185M 199M 215M 221M 308M 302M 304M 357M
↳ 5y CAGR +6.6% +6.5% +7.1% +8.7% +8.3% +14.4% +10.4% +8.9% +10.7%
Total comprehensive income (USD) -105M 247M -35.7M 136M 398M 191M -128M -541M 25.6M -6.93B
Comprehensive income to owners (USD) -105M 247M -35.7M 136M 398M 191M -128M -541M 25.6M -6.93B
Provision for credit losses (USD) — — — — — — 0.00 0.00 3.4M 100,000
Reported Aug 28, 2018 Aug 25, 2020 Aug 31, 2021 Aug 25, 2020 Aug 31, 2021 Aug 21, 2024 Aug 19, 2025 Aug 19, 2025 Aug 19, 2025 Nov 3, 2026

Sign up to see institutional holdings

Sign Up

Podcast Mentions

Sign up to see podcast mentions and sentiment

Sign Up

In The News
Browse the latest business and industry media coverage and highlights.

[/images/section/BannerFifthlevel/newsroom-news-image.jpg

Latest NewsNovember 6, 2026
\

CEO Michael Hurlston explains how the shift from electrical to optical technology is fueling Lumentum’s growth\


Watch Video](https://www.cnbc.com/video/2026/11/06/lumentum-ceo-michael-hurlston-our-demand-couldnt-be-stronger-but-were-seeing-a-massive-sell-off.html)

Select Year:

  • All Years

[Global Semiconductor Alliance (GSA)
\

Lumentum Nominated for Most Respected Public Semiconductor Company Award\


November 05, 2026

Read More](https://bit.ly/3Ulzd6G)

[Gazettabyte
\

Lumentum’s CEO on the colliding worlds of chips and optics\


October 30, 2026

Read More](https://gazettabyte.com/the-colliding-worlds-of-chips-and-optics/)

[ECOC TV
\

Loukas Paraschis on the growing importance of laser technologies in AI-driven photonics\


October 29, 2026

Watch Video](https://lnkd.in/p/e9Wt_Z68)

[The Cube + NYSE Wired
\

Interview with Michael Hurlston from The CEO Summit 2026\


October 27, 2026

Watch Video](https://youtu.be/IQoFYt2jGAY?si=wnp1Wj0lPJdNpGQw)

[Optica
\

Global Photonics Economic Forum: Keynote with Michael Hurlston\


October 22, 2026

Watch Video](https://youtu.be/gQR-sw-D9-s?si=1Fj5AzsUdNOhcH-e)

[Converge! Network Digest
\

PECC Summit: Lumentum Puts Lasers at the Center of AI Interconnect Design\


October 21, 2026

Read More](https://convergedigest.com/pecc-summit-lumentum-lasers-ai-interconnect-design/)

[NextGenInfra
\

OCPSummit26: Slow and Wide Optical PCIe\


October 20, 2026

Watch Video](https://youtu.be/e7qmY65dnyk?si=gJbXgETr-lqp2Yqq)

[Nation Online
\

As AI grows rapidly, what increasing role will Thailand play?\


October 19, 2026

Watch Video](https://www.youtube.com/watch?v=SZHsLvFMEts)

[Claman's Power Players
\

Lumentum CEO discusses company's growth amid technology boom\


October 16, 2026

Watch Video](https://www.foxbusiness.com/video/6406988639112)

1

2

12

Lumentum-Dark-Gray-logo

© 2026 Lumentum Operations LLC

November 2, 2026

  • Download (opens in new window)

  • Net revenue of $1.26 billion

  • GAAP gross margin of 51.0%; Non-GAAP gross margin of 53.2%

  • GAAP operating margin of 28.5%; Non-GAAP operating margin of 42.3%

  • Forecasting second quarter of fiscal year 2027 revenue of $1.575 billion to $1.625 billion; non-GAAP operating margin of 45.0% to 46.0%; and non-GAAP diluted net income per share of $5.90 to $6.20.

SAN JOSE, Calif.--(BUSINESS WIRE)-- Lumentum Holdings Inc. (“Lumentum” or the “Company”) today reported results for its fiscal first quarter ended September 26, 2026.

“Lumentum built on its strong momentum in the first fiscal quarter of 2027, delivering growth across all our businesses, with pump lasers and optical circuit switches (OCS) being the leading contributors. During the quarter, we secured our second major NPO/CPO win, backed by purchase commitments exceeding $5 billion. Additionally, our OCS demand visibility has expanded significantly in recent months, positioning optical switching to become a multi-billion-dollar annual revenue stream. Finally, we continue to see strength in our cloud modules business which is showing improvement on the gross margin line,” said President and CEO Michael Hurlston.

"Looking ahead, we anticipate adding approximately $350 million in sequential growth in our second quarter, a figure greater than the quarterly revenue of the whole company just two years ago. Furthermore, we project our second quarter operating margin to exceed 45 percent.”

Fiscal First Quarter Highlights:

Net revenue for the first quarter of fiscal year 2027 was $1.26 billion, with GAAP net income of $360.3 million, or $3.54 per diluted share. Net revenue for the fourth quarter of fiscal year 2026 was $1.01 billion, with GAAP net loss of $7.2 billion, or $84.65 per diluted share. Net revenue for the first quarter of fiscal year 2026 was $533.8 million, with GAAP net income of $4.2 million, or $0.05 per diluted share.

Non-GAAP net income for the first quarter of fiscal year 2027 was $461.1 million, or $4.57 per diluted share. Non-GAAP net income for the fourth quarter of fiscal year 2026 was $326.3 million, or $3.23 per diluted share. Non-GAAP net income for the first quarter of fiscal year 2026 was $86.4 million, or $1.10 per diluted share.

The Company held $2.0 billion in total cash, cash equivalents, and short-term investments at the end of the first quarter of fiscal year 2027, a decrease of $758.8 million from the end of the fourth quarter of fiscal year 2026.

Financial Overview – Fiscal First Quarter Ended September 26, 2026

GAAP Results ($ in millions)
Q1 Q4 Q1 Change
FY 2027 FY 2026 FY 2026 Q/Q Y/Y
Net revenue $ 1,262.6 $ 1,006.3 $ 533.8 25.5 % 136.5 %
GAAP gross margin 51.0 % 47.4 % 34.0 % 360 bps 1,700 bps
GAAP operating margin 28.5 % 27.8 % 1.3 % 70 bps 2,720 bps
Non-GAAP Results ($ in millions)
Q1 Q4 Q1 Change
FY 2027 FY 2026 FY 2026 Q/Q Y/Y
Net revenue $ 1,262.6 $ 1,006.3 $ 533.8 25.5 % 136.5 %
Non-GAAP gross margin 53.2 % 50.4 % 39.4 % 280 bps 1,380 bps
Non-GAAP operating margin 42.3 % 36.6 % 18.7 % 570 bps 2,360 bps
Net Revenue by Product Type ($ in millions)
Q1 % of Q4 Q1 Change
FY 2027 Net Revenue FY 2026 FY 2026 Q/Q Y/Y
Components $ 754.2 59.7 % $ 649.4 $ 379.2 16.1 % 98.9 %
Systems 508.4 40.3 % 356.9 154.6 42.4 % 228.8 %
Total $ 1,262.6 100.0 % $ 1,006.3 $ 533.8 25.5 % 136.5 %

The tables above provide comparisons of quarterly results to prior periods, including sequential quarterly and year-over-year changes. A reconciliation between GAAP and non-GAAP measures is contained in this release under the section titled “Use of Non-GAAP Financial Measures.”

Business Outlook

Lumentum expects the following for the second quarter of fiscal year 2027:

  • Net revenue in the range of $1.575 billion to $1.625 billion
  • Non-GAAP operating margin of 45.0% to 46.0%
  • Non-GAAP diluted earnings per share of $5.90 to $6.20

We have not provided reconciliations from GAAP to non-GAAP financial measures or the equivalent GAAP measure for non-GAAP financial measures in our outlook, as they cannot be provided without unreasonable effort. A large portion of non-GAAP adjustments, such as stock-based compensation and related payroll taxes, acquisition related costs, net, integration related costs, restructuring and related charges, foreign exchange losses (gains), net, non-GAAP income tax reconciling adjustments, and other non-GAAP adjustments are by their nature highly volatile and we have low visibility as to the range that may be incurred in the future.

About Lumentum

Lumentum (NASDAQ: LITE) is a global leader in optical and photonic technologies that power the networks and infrastructure behind AI, cloud computing, and next-generation communications. Built on decades of photonics innovation, Lumentum delivers high-performance lasers, modules, and optical subsystems that enable scalable, energy-efficient data center connectivity, advanced telecom networks, industrial manufacturing, and sensing applications. Headquartered in San Jose, California, the company operates R&D, manufacturing, and sales facilities worldwide. Learn more at www.lumentum.com .

Forward-Looking Statements

This press release contains forward-looking statements within the meaning of Section 27A of the Securities Act of 1933 and Section 21E of the Securities Exchange Act of 1934. These include statements regarding: demand in our markets (including accelerating AI demand) and for our products, revenue growth and opportunities, growth drivers, our total addressable market, and our guidance with respect to future net revenue, non-GAAP diluted earnings per share, and non-GAAP operating margin, and related assumptions. These forward-looking statements involve risks and uncertainties that could cause actual results to differ materially from those projected. Among the factors that could cause actual results to differ from those contemplated are: (a) uncertainty and volatility in the global markets, including uncertainty and volatility in the macroeconomic environment, volatility and uncertainty with respect to economic growth, inflationary pressures, changes in the political or economic environment, such as geopolitical conflicts, war, international trade regulation and restrictions (including tariffs, duties and export controls to be implemented by the U.S. and other countries), including for certain rare earth minerals, and the effect of such market disruptions on demand for our products, technology spending by our customers, our costs and expenses and our ability to obtain components for our products; (b) quarter-over-quarter product mix fluctuations, which can materially impact profitability measures due to the broad gross margin ranges across our portfolio; (c) decline of average selling prices across our businesses or increase in costs, either of which will also decrease our margins; (d) effects of seasonality; (e) our ability to increase our manufacturing capacity and our ability and the ability of our suppliers and contract manufacturers to meet production, quality, and delivery requirements for our forecasted demand; (f) changes in customer demand, including due to changes in inventory practices and end-customer demand, and potential order cancellations, reductions or delays and their effects; (g) our ability to attract and retain new customers, particularly in the cloud photonics and imaging and sensing markets; (h) the risk that our markets will not grow or develop as expected or that our strategies and ability to compete in those markets are not successful, (i) the risk that Lumentum’s financing or operating strategies will not be successful; (j) risks related to our restructuring initiatives and changes to our operations; (k) failure to successfully integrate acquisitions into our business or that we will not achieve the expected benefits; (l) risks related to servicing our current and future debt and compliance with the covenants under our revolving credit facility and term loans. A detailed discussion of these and other risks and uncertainties that could cause actual results and events to differ materially from such forward-looking statements is included in the Company’s Annual Report on Form 10-K for the fiscal year ended June 27, 2026 filed with the Securities and Exchange Commission (the “SEC) and the Company’s other filings with the SEC, including the Quarterly Report on Form 10-Q for the fiscal quarter ended September 26, 2026 which will be filed with the SEC, available at www.sec.gov , under the "Risk Factors" section and elsewhere. The forward-looking statements contained in this press release are made as of the date hereof and the Company assumes no obligation to update such statements, except as required by applicable law.

Category: Financial

The following financial tables are presented in accordance with GAAP, unless otherwise specified.

LUMENTUM HOLDINGS INC.CONDENSED CONSOLIDATED STATEMENTS OF OPERATIONS(in millions, except per share data)(unaudited)
Three Months Ended
September 26, 2026 September 27, 2025
Net revenue $ 1,262.6 $ 533.8
Cost of sales 599.5 332.8
Amortization of acquired developed intangibles 19.1 19.5
Gross profit 644.0 181.5
Operating expenses:
Research and development 191.8 81.4
Selling, general and administrative 99.3 85.1
Restructuring and related charges — 8.3
Gain on sale of business, net (6.9 ) —
Total operating expenses 284.2 174.8
Income from operations 359.8 6.7
Other income (expense), net:
Interest expense (2.4 ) (5.7 )
Interest and other income, net 12.9 4.2
Total other income (expense), net 10.5 (1.5 )
Income before income taxes 370.3 5.2
Income tax provision 10.0 1.0
Net income $ 360.3 $ 4.2
Net income per share:
Basic $ 3.90 $ 0.06
Diluted $ 3.54 $ 0.05
Shares used to compute net income per share - common stock and preferred stock assuming conversion:
Basic 92.5 70.3
Diluted 101.7 78.3
LUMENTUM HOLDINGS INC.CONDENSED CONSOLIDATED BALANCE SHEETS(in millions, except per share data)(unaudited)
September 26, 2026 June 27, 2026
ASSETS
Current assets:
Cash and cash equivalents $ 1,272.2 $ 2,043.5
Short-term investments 707.4 694.9
Accounts receivable, net 625.7 520.3
Accrued accounts receivable 100.0 —
Inventories 807.7 691.6
Prepayments and other current assets 340.0 211.6
Total current assets 3,853.0 4,161.9
Property, plant and equipment, net 1,410.4 1,159.1
Operating lease right-of-use assets, net 26.5 29.2
Goodwill 1,069.9 1,069.3
Other intangible assets, net 294.1 326.9
Deferred tax asset 557.3 530.9
Other non-current assets 62.8 30.2
Total assets $ 7,274.0 $ 7,307.5
LIABILITIES AND STOCKHOLDERS’ EQUITY
Current liabilities:
Accounts payable $ 737.1 $ 567.4
Accrued payroll and related expenses 132.7 146.3
Accrued expenses 58.0 64.9
Current portion of long-term debt 1,360.3 1,596.9
Operating lease liabilities, current 13.8 13.5
Other current liabilities 89.7 91.5
Total current liabilities 2,391.6 2,480.5
Long-term debt 39.3 40.5
Operating lease liabilities, non-current 16.8 20.3
Deferred tax liability 7.3 7.1
Other non-current liabilities 246.4 115.2
Total liabilities 2,701.4 2,663.6
Stockholders’ equity:
Preferred stock, $0.001 par value, 10 authorized shares, 2.9 shares and 2.9 shares issued and outstanding as of September 26, 2026 and June 27, 2026, respectively 0.0 0.0
Common stock, $0.001 par value, 990 authorized shares, 90.6 shares and 88.6 shares issued and outstanding as of September 26, 2026 and June 27, 2026, respectively 0.1 0.1
Additional paid-in capital 12,002.0 12,430.1
Accumulated deficit (7,436.0 ) (7,796.3 )
Accumulated other comprehensive income 6.5 10.0
Total stockholders’ equity 4,572.6 4,643.9
Total liabilities and stockholders’ equity $ 7,274.0 $ 7,307.5

Use of Non-GAAP Financial Measures

In this press release, Lumentum provides investors with certain non-GAAP financial measures: gross profit, gross margin, research and development expense, selling, general and administrative expense, operating margin, income from operations, total other income (expense), net, income before income taxes, provision for income taxes, net income, shares used in per share calculation, and net income (loss) per share on a non-GAAP basis, as well as the non-GAAP measures of EBITDA and Adjusted EBITDA. Lumentum believes this non-GAAP financial information provides additional insight into the Company’s on-going business operations and results, and has therefore chosen to provide this information to investors for a more consistent basis of comparison and to help them evaluate the results of the Company’s on-going operations and enable more meaningful period to period comparisons. In addition, the Company believes that providing certain of these measures allows investors to better understand the Company’s operating performance and, importantly, to evaluate the methodology and information used by management to monitor, manage, evaluate and measure the Company’s business and results of operations. However, investors are cautioned that there are material limitations associated with the use of non-GAAP financial measures as an analytical tool. In particular, many of the adjustments to our GAAP financial measures reflect the exclusion of items that are recurring and will be reflected in our financial results for the foreseeable future. Moreover, the non-GAAP financial measures we present may be different from non-GAAP financial measures used by other companies or may not be comparable to similarly titled measurements reported by other companies, limiting their usefulness for comparison purposes. We do not consider non-GAAP financial measures to be a substitute for, or superior to, the information provided by GAAP financial measures, and the non-GAAP financial measures used in this press release should not be considered in isolation from measures of financial performance prepared in accordance with GAAP.

Our non-GAAP measures used in this press release exclude (i) stock-based compensation and related payroll taxes, (ii) acquisition related costs, net (iii) integration related costs (income), net, (iv) amortization of acquired intangibles, (v) restructuring and related charges, (vi) intangible assets write-off, (vii) gain on sale of business, net (viii) foreign exchange losses (gains), net, (ix) loss on debt extinguishment, (x) inducement expense, (xi) non-cash interest expense, (xii) other charges or income related to non-recurring activities, and (xiii) non-GAAP income tax reconciling adjustments.

We utilize a long-term projected non-GAAP tax rate to compute our non-GAAP income tax provision. The long-term projected non-GAAP tax rate is based on a multi-year projection of our estimated annual GAAP income tax forecast, adjusted to account for the tax effect of non-GAAP pretax adjustments as well as the effects of significant non-recurring and period specific tax items. Our non-GAAP tax provision for fiscal year 2027 is based on a rate of 16.5%. The difference between our GAAP income tax provision and our non-GAAP income tax provision is presented as non-GAAP income tax reconciling adjustments.

A quantitative reconciliation between GAAP and non-GAAP financial data is included in the supplemental financial table attached to this press release.

LUMENTUM HOLDINGS INC.RECONCILIATION OF GAAP MEASURES TO NON-GAAP MEASURES(in millions, except per share data)(unaudited)
Three Months Ended
September 26, 2026 June 27, 2026 September 27, 2025
Gross profit on GAAP basis $ 644.0 $ 477.3 $ 181.5
Stock-based compensation and related payroll taxes(1) 8.9 10.5 9.7
Amortization of acquired intangibles 19.1 19.2 19.5
Other income, net(3) (0.8 ) (0.1 ) (0.4 )
Gross profit on non-GAAP basis $ 671.2 $ 506.9 $ 210.3
Gross margin on non-GAAP basis 53.2 % 50.4 % 39.4 %
Research and development on GAAP basis $ 191.8 $ 104.4 $ 81.4
Stock-based compensation and related payroll taxes(1) (105.2 ) (13.5 ) (12.0 )
Amortization of acquired intangibles (0.1 ) (0.4 ) (0.4 )
Intangible assets write-off — (2.5 ) —
Other charges, net(3) (1.2 ) (0.5 ) —
Research and development on non-GAAP basis $ 85.3 $ 87.5 $ 69.0
Selling, general and administrative on GAAP basis $ 99.3 $ 91.2 $ 85.1
Stock-based compensation and related payroll taxes(1) (32.6 ) (26.1 ) (24.8 )
Amortization of acquired intangibles (13.6 ) (13.9 ) (14.5 )
Acquisition related costs, net — — (1.3 )
Integration related (costs) income, net (0.3 ) (0.5 ) 0.8
Other charges, net(3) (1.3 ) (0.1 ) (3.8 )
Selling, general and administrative on non-GAAP basis $ 51.5 $ 50.6 $ 41.5
Income from operations on GAAP basis $ 359.8 $ 279.3 $ 6.7
Stock-based compensation and related payroll taxes(1) 146.7 50.1 46.5
Amortization of acquired intangibles 32.8 33.5 34.4
Acquisition related costs, net — — 1.3
Integration related costs (income), net 0.3 0.5 (0.8 )
Restructuring and related charges — 2.4 8.3
Intangible assets write-off — 2.5 —
Gain on sale of business, net(2) (6.9 ) — —
Other charges, net(3) 1.7 0.5 3.4
Income from operations on non-GAAP basis $ 534.4 $ 368.8 $ 99.8
Operating margin on non-GAAP basis 42.3 % 36.6 % 18.7 %
Total other income (expense), net on GAAP basis $ 10.5 $ (7,737.6 ) $ (1.5 )
Loss on debt extinguishment — 7,756.6 —
Inducement expense — — 5.9
Foreign exchange losses (gains), net 6.7 2.2 (1.5 )
Non-cash interest expense 0.6 0.8 0.8
Total other income, net on non-GAAP basis $ 17.8 $ 22.0 $ 3.7
Income (loss) before income taxes on GAAP basis $ 370.3 $ (7,458.3 ) $ 5.2
Stock-based compensation and related payroll taxes(1) 146.7 50.1 46.5
Amortization of acquired intangibles 32.8 33.5 34.4
Acquisition related costs, net — — 1.3
Integration related costs (income), net 0.3 0.5 (0.8 )
Intangible assets write-off — 2.5 —
Restructuring and related charges — 2.4 8.3
Gain on sale of business, net(2) (6.9 ) — —
Foreign exchange losses (gains), net 6.7 2.2 (1.5 )
Loss on debt extinguishment — 7,756.6 —
Inducement expense — — 5.9
Non-cash interest expense 0.6 0.8 0.8
Other charges, net(3) 1.7 0.5 3.4
Income before income taxes on non-GAAP basis $ 552.2 $ 390.8 $ 103.5
Income tax provision (benefit) on GAAP basis $ 10.0 $ (296.6 ) $ 1.0
Non-GAAP income tax reconciling adjustments 81.1 361.1 16.1
Income tax provision on non-GAAP basis $ 91.1 $ 64.5 $ 17.1
Net income (loss) on GAAP basis $ 360.3 $ (7,161.7 ) $ 4.2
Stock-based compensation and related payroll taxes(1) 146.7 50.1 46.5
Amortization of acquired intangibles 32.8 33.5 34.4
Acquisition related costs, net — — 1.3
Integration related costs (income), net 0.3 0.5 (0.8 )
Intangible assets write-off — 2.5 —
Restructuring and related charges — 2.4 8.3
Gain on sale of business, net(2) (6.9 ) — —
Loss on debt extinguishment — 7,756.6 —
Inducement expense — — 5.9
Foreign exchange losses (gains), net 6.7 2.2 (1.5 )
Non-cash interest expense 0.6 0.8 0.8
Other charges, net(3) 1.7 0.5 3.4
Non-GAAP income tax reconciling adjustments (81.1 ) (361.1 ) (16.1 )
Net income on non-GAAP basis $ 461.1 $ 326.3 $ 86.4
Net income per share on non-GAAP basis $ 4.57 $ 3.23 $ 1.10
Shares used in per share calculation - diluted on GAAP basis 101.7 84.6 78.3
Non-GAAP adjustment(4) (0.7 ) 16.5 —
Shares used in per share calculation - diluted on non-GAAP basis 101.0 101.1 78.3
(1) Stock-based compensation and related payroll taxes for the three months ended September 26, 2026 includes $89.4 million of equity award modification associated with the retirement of certain executive announced during the quarter and $14.2 million of payroll taxes on stock-based compensation.
(2) Gain on sale of business, net for the three months ended September 26, 2026 resulted from the sale of a certain product line for a total proceed of $12.3 million. The transaction comprised of assets with total book value of $5.1 million, together with associated license, supply, transition-service, and facility arrangements. We incurred selling costs of $0.3 million.
(3) Other charges (income), net for the three months ended September 26, 2026 primarily relates to $1.3 million of legal fees in selling and general and administrative expenses related to non-ordinary course legal matters and $1.2 million of certain process qualification costs in research and development expenses associated with the ramp of our Greensboro, North Carolina facility, offset in part by a $0.8 million credit related to units sold that were previously written down.
(4) The adjustment for the three months ended September 26, 2026 represents the impact of the capped call options. Our outstanding capped call options are anti-dilutive under GAAP as they are specifically designed to mitigate the dilutive impact of the 2032 Notes, such that no dilution will occur until the capped call price is exceeded. Therefore, we reduced 0.7 million shares from the capped call in the calculation of non-GAAP diluted shares in the three months ended September 26, 2026 to provide investors with useful information in evaluating our performance on a per share basis.

We calculate basic net income per share pursuant to the two-class method as a result of the issuance of the Series A Convertible Preferred Stock (the “Preferred Stock”) in March 2026. Our Preferred Stock represents a second class of common stock for purposes of computing net income per share under the two-class method as it is entitled to receive dividends on an as-converted basis in the same manner as holders of common stock and does not have any material preferential rights relative to our common stock.

As the Preferred Stock participates on an if-converted basis, and there are no dividends, the income allocated to the two classes of stock converge and the results are mathematically equal. Thus, basic and diluted net income per share is calculated assuming the Preferred Stock have been converted into common stock, and the related shares are included in the weighted average shares outstanding.

LUMENTUM HOLDINGS INC.RECONCILIATION OF GAAP NET INCOME TO ADJUSTED EBITDA(in millions, except per share data)(unaudited)
Three Months Ended
September 26, 2026 June 27, 2026 September 27, 2025
GAAP net income (loss) $ 360.3 $ (7,161.7 ) $ 4.2
Loss on debt extinguishment — 7,756.6 —
Interest expense 2.4 3.6 5.7
Interest and other income, net (12.9 ) (22.6 ) (4.2 )
Income tax provision (benefit) 10.0 (296.6 ) 1.0
Depreciation expense 43.6 37.6 27.8
Amortization of acquired intangibles 32.8 33.5 34.4
EBITDA 436.2 350.4 68.9
Restructuring and related charges — 2.4 8.3
Stock-based compensation and related payroll taxes 146.7 50.1 46.5
Acquisition related costs, net — — 1.3
Integration related costs (income), net 0.3 0.5 (0.8 )
Intangible asset write-off — 2.5 —
Gain on sale of business, net (6.9 ) — —
Other charges, net 1.7 0.5 3.4
Adjusted EBITDA $ 578.0 $ 406.4 $ 127.6

Investors: Kathy Ta, +1.408.750.3853; [email protected]

Media: Victoria McDonald, +1.408.404.0636; [email protected]

Source: Lumentum

View All News

November 2, 2026

  • Download (opens in new window)

  • Combines two of the fastest-growing enablers of AI, bringing together complementary electrical and optical technologies to address increasingly complex connectivity requirements across next-generation AI infrastructure

  • Expected to create a broad full-stack connectivity portfolio that is intended to enable end-to-end extreme co-design, high-volume production of fully-optimized, pre-validated optical solutions and faster time to market for customers

  • Expected to expand the combined company’s total addressable market to $550 billion

  • The transaction is expected to enhance the combined company’s long-term revenue growth, non-GAAP gross margin and non-GAAP operating margin profile, provide line of sight to more than $1 billion in annual run-rate cost synergies, and is expected to be accretive to Marvell non-GAAP earnings per share in year one post-close

SANTA CLARA, Calif. & SAN JOSE, Calif.--(BUSINESS WIRE)-- Marvell Technology, Inc. (NASDAQ: MRVL) and Lumentum (NASDAQ: LITE) today announced that they have entered into a definitive agreement for Marvell to acquire Lumentum in an all-stock transaction. Under the terms of the agreement, Lumentum stockholders will receive a fixed exchange ratio of 4.500 shares of Marvell common stock for each share of Lumentum common stock they own. The transaction has an implied enterprise value of $115 billion for Lumentum, representing approximately $1,132 per share of Lumentum common stock and a premium of approximately 23.9% based on each company’s unaffected closing share price as of October 28, 2026, the last trading day before market speculation regarding a potential transaction began. Post-closing, current Marvell stockholders will own approximately 67% of the combined company on a fully diluted basis, while Lumentum stockholders will own approximately 33%.

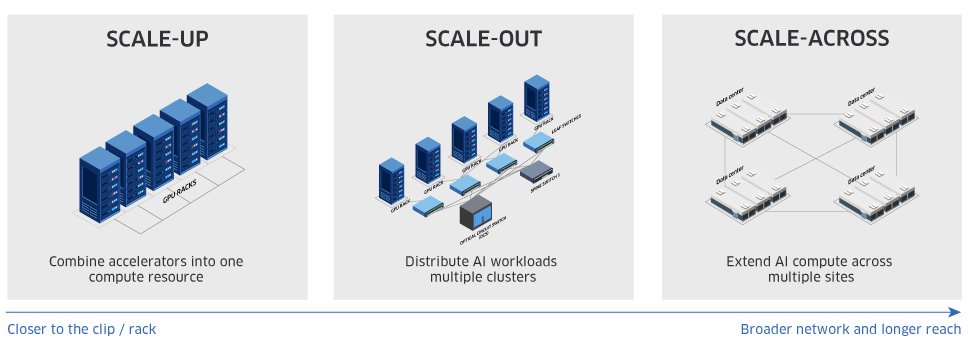
The AI infrastructure industry is at an inflection point. Rapidly growing bandwidth requirements and the physical limitations of copper-based connectivity are accelerating the transition toward optical technologies. As AI infrastructure scales to increasingly complex architectures, particularly scale-up and scale-in, the industry is shifting from discrete, modular components toward highly integrated optical solutions that require much closer co-design of electrical and optical technologies to deliver greater bandwidth, performance and energy efficiency.

The combination brings together best-in-breed technology to meet this need, joining Marvell's strengths in electrical and optical interconnect, network switching, custom XPU and XPU attach and advanced semiconductor technologies with Lumentum's expertise in high-performance lasers, optical transceivers, optical circuit switching (OCS) and specialized compound semiconductor manufacturing. Following closing, the combined company is expected to offer a highly complementary portfolio spanning leading-edge CMOS, silicon photonics, compound semiconductors, advanced packaging and manufacturing capabilities. The combination is intended to enable deeper integration and co-design across the electrical and optical signal chain, positioning Marvell to deliver highly optimized connectivity solutions across a wide range of distances, from distributed data centers to connections within advanced semiconductor packages.

“AI infrastructure is undergoing a fundamental architectural shift toward optical connectivity, creating an opportunity that comes along once in a generation,” said Matt Murphy, Chairman and CEO of Marvell. “The companies that move first and help define this transition will set the standard for decades to come. By bringing together two leaders with highly complementary technologies, exceptional talent and specialized manufacturing capabilities, we intend to help shape the next era of AI connectivity and create exceptional stockholder value.”

“Joining Marvell creates a company uniquely positioned to capitalize on a market opportunity of $550 billion and generate significant, sustainable stockholder value,” said Michael Hurlston, President and CEO of Lumentum. “Surging AI data traffic requires rapid hardware innovation, and this combination enhances our ability to deliver next-generation solutions at scale. Together with Marvell, we will meet our customers' complete interconnect needs, spanning scale-across and scale-out today to scale-up and scale-in domains tomorrow. By offering extreme co-design around our customers' demanding requirements, we will help them achieve faster time to market, accelerated innovation cycles and category-defining performance.”

Compelling Strategic and Financial Rationale

The combination is expected to deliver substantial strategic and financial benefits:

  • Creates a category leader in AI connectivity: Combining Marvell's electrical and optical interconnect, switching and custom silicon technologies with Lumentum's high-performance lasers, optical transceivers and OCS capabilities will create a comprehensive connectivity portfolio spanning scale-across, scale-out, scale-up and scale-in. Upon closing, the combined company anticipates being positioned to address customer connectivity requirements across a broad range of distances and topologies, from distributed data centers to advanced semiconductor packages.
  • Enables end-to-end extreme co-design and accelerates customer innovation: As AI infrastructure becomes increasingly complex, customers require higher levels of integration and optimization across digital, analog and optical technologies. By bringing together complementary technologies and engineering expertise across the signal chain, the combined company expects to be positioned to develop highly-optimized, pre-validated optical solutions designed to improve bandwidth, performance and power efficiency, accelerate customer time to market and support high-volume production.
  • Combines highly specialized manufacturing capabilities and enhances R&D resources: Lumentum brings advanced compound semiconductor manufacturing and process technologies, including indium phosphide (InP), as well as high-speed and high-power laser capabilities. After closing, the combined company plans to bring together leading-edge semiconductor design, advanced packaging and specialized manufacturing capabilities to enable deeper heterogeneous integration, strengthen strategic supply and accelerate the development of next-generation optical technologies.
  • Creates significant long-term stockholder value: The combination brings together two of the fastest-growing companies enabling AI infrastructure and expands the combined company’s total addressable market to $550 billion and enhances the combined company’s ability to serve customers in emerging scale-up and scale-in markets. The transaction is expected to enhance the combined company’s long-term revenue growth, non-GAAP gross margin and non-GAAP operating margin profile, provide line of sight to more than $1 billion in annual run-rate cost synergies and is expected to be accretive to Marvell non-GAAP earnings per share in year one post-close.

Transaction Structure and Terms

Under the terms of the agreement, which has been unanimously approved by the boards of directors of both companies, Lumentum stockholders will receive a fixed exchange ratio of 4.500 shares of Marvell common stock for each share of Lumentum common stock held at the time of closing, implying pro forma ownership of approximately 33% of the combined company for Lumentum stockholders on a fully diluted basis.

Following closing, Matt Murphy will continue as Chairman and CEO of the combined company. As part of the transaction, three members of Lumentum's Board of Directors, including Lumentum CEO Michael Hurlston, will join Marvell's Board, which currently consists of seven directors.

The transaction is expected to close in the first half of calendar year 2028, subject to approval by Marvell and Lumentum stockholders, receipt of regulatory approvals and other customary closing conditions.

Marvell Reports Preliminary Revenue for the Fiscal Third Quarter 2027 and Lumentum Issues Fiscal First Quarter 2027 Results

In connection with today's announcement, Marvell today reported preliminary revenue for the third quarter of fiscal 2027 consistent with previously provided guidance, maintaining the midpoint of its prior guidance while narrowing the expected range to plus or minus 2%, compared with the original range of plus or minus 5%.

Lumentum today separately reported financial results for its first fiscal quarter of 2027. Lumentum's financial results can be found on the Investors section of the Lumentum website at http://investor.Lumentum.com .

Conference Call Information

Marvell and Lumentum will host a joint conference call today at 5:00 a.m. Pacific Time (8:00 a.m. Eastern Time) to discuss the transaction. To participate, dial 800-579-2543 (U.S.) or 785-424-1789 (international) and reference conference ID 5554083. The call will be webcast on Marvell's Investor Relations website , where an accompanying investor presentation will also be posted shortly.

Advisors

Qatalyst Partners is serving as lead financial advisor and J.P. Morgan Securities LLC and Goldman Sachs & Co. LLC are serving as financial advisors to Marvell. Wilson Sonsini Goodrich & Rosati is serving as legal advisor to Marvell, and FGS Global is serving as strategic communications advisor. Citigroup Global Markets Inc. and Evercore are serving as financial advisors to Lumentum, Davis Polk & Wardwell LLP is serving as legal advisor and Joele Frank, Wilkinson Brimmer Katcher is serving as strategic communications advisor.

About Marvell

To deliver the data infrastructure technology that connects the world, we're building solutions on the most powerful foundation: our partnerships with our customers. Trusted by the world's leading technology companies for over 30 years, we move, store, process and secure the world's data with semiconductor solutions designed for our customers' current needs and future ambitions. Through a process of deep collaboration and transparency, we're ultimately changing the way tomorrow's enterprise, cloud and carrier architectures transform—for the better.

About Lumentum

Lumentum is a global leader in optical and photonic technologies that power the networks and infrastructure behind AI, cloud computing and next-generation communications. Built on decades of photonics innovation, Lumentum delivers high-performance lasers, modules and optical subsystems that enable scalable, energy-efficient data center connectivity, advanced telecom networks, industrial manufacturing and sensing applications. Headquartered in San Jose, California, the company operates R&D, manufacturing and sales facilities worldwide. Learn more at www.lumentum.com .

Additional Information About the Transaction and Where to Find It

This communication relates to a proposed transaction between Marvell Technology, Inc. (“Marvell”) and Lumentum Holdings Inc. (“Lumentum”) (the “Transaction”). In connection with the Transaction, Marvell intends to file with the SEC a registration statement on Form S-4 (the “Form S-4”) that will include a joint proxy statement for Marvell’s and Lumentum’s respective stockholders and that will also constitute a prospectus with respect to the shares of Marvell’s common stock to be issued in the Transaction (the “Joint Proxy Statement/Prospectus”). The definitive Joint Proxy Statement/Prospectus (if and when available) will be mailed to stockholders of Marvell and Lumentum after the Form S-4 is declared effective by the SEC. This communication is not a substitute for the Joint Proxy Statement/Prospectus or registration statement. INVESTORS AND SECURITY HOLDERS ARE URGED TO READ THE FORM S-4, JOINT PROXY STATEMENT/PROSPECTUS AND ANY OTHER RELEVANT DOCUMENTS THAT MAY BE FILED WITH THE SEC IN CONNECTION WITH THE TRANSACTION OR INCORPORATED BY REFERENCE INTO THE FORM S-4 AND THE JOINT PROXY STATEMENT/PROSPECTUS (AS WELL AS ANY AMENDMENTS OR SUPPLEMENTS THERETO), CAREFULLY AND IN THEIR ENTIRETY WHEN THEY BECOME AVAILABLE BECAUSE THEY WILL CONTAIN IMPORTANT INFORMATION ABOUT MARVELL, LUMENTUM, THE TRANSACTION AND RELATED MATTERS. Investors and security holders will be able to obtain free copies of the Form S-4 and Joint Proxy Statement/Prospectus and other documents containing important information about Marvell, Lumentum and the Transaction, once such documents are filed with the SEC through the website maintained by the SEC at _https://www.sec.gov _. Copies of the documents filed with the SEC by Marvell will be available online free of charge on Marvell’s website at https://investor.marvell.com or by contacting Marvell’s Investor Relations department at [email protected] . Copies of the documents filed with the SEC by Lumentum will be available online free of charge on Lumentum’s website at https://investor.lumentum.com or by contacting Lumentum’s Investor Relations department at [email protected] .

Participants in the Merger Solicitation

Marvell, Lumentum and certain of their respective directors and executive officers may be deemed to be participants in the solicitation of proxies in respect of the Transaction. Information about the directors and executive officers of Marvell, including a description of their direct or indirect interests, by security holdings or otherwise, is set forth in Marvell’s proxy statement for its 2026 Annual Meeting of Stockholders, which was filed with the SEC on May 13, 2026 and is available online at _https://www.sec.gov/Archives/edgar/data/0001835632/000110465926060253/tm261486-1_def14a.htm _, under the headings “Proposal No. 1 Election of Directors”, “Executive Officers of the Company”, “Security Ownership of Certain Beneficial Owners and Management”, “Executive Compensation” and “Certain Relationships and Related Party Transactions” and Marvell’s Annual Report on Form 10-K for the fiscal year ended January 31, 2026, which was filed with the SEC on March 11, 2026 and is available online at _https://www.sec.gov/Archives/edgar/data/0001835632/000183563226000011/mrvl-20260131.htm _, under the heading “Security Ownership of Certain Beneficial Owners and Management and Related Stockholder Matters”. To the extent holdings of Marvell’s securities by its directors or executive officers have changed since the amounts set forth in Marvell’s definitive proxy statement for its 2026 Annual Meeting of Stockholders, such changes have been or will be reflected on Initial Statement of Beneficial Ownership of Securities on Form 3, Statement of Changes in Beneficial Ownership on Form 4 or Annual Statement of Changes in Beneficial Ownership on Form 5 filed with the SEC, which are available online at _https://www.sec.gov/edgar/browse/?CIK=0001835632&owner=exclude _. Information about the directors and executive officers of Lumentum, including a description of their direct or indirect interests, by security holdings or otherwise, is set forth in Lumentum’s proxy statement for its 2026 Annual Meeting of Stockholders, which was filed with the SEC on October 6, 2026 and is available online at https://www.sec.gov/Archives/edgar/data/0001633978/000130817926000420/lite2026-def14a.htm , under the headings “Proposal No. 1 Election of Directors”, “Executive Officers”, “Compensation Discussion and Analysis”, “Security Ownership of Certain Beneficial Owners and Management” and “Related Person Transactions”. To the extent holdings of Lumentum’s securities by its directors or executive officers have changed since the amounts set forth in Lumentum’s definitive proxy statement for its 2026 Annual Meeting of Stockholders, such changes have been or will be reflected on Initial Statement of Beneficial Ownership of Securities on Form 3, Statement of Changes in Beneficial Ownership on Form 4, or Annual Statement of Changes in Beneficial Ownership on Form 5 filed with the SEC, which are available online at _https://www.sec.gov/edgar/browse/?CIK=0001633978&owner=exclude _. Other information regarding the participants in the proxy solicitations and a description of their direct and indirect interests, by security holdings or otherwise, will be contained in the Joint Proxy Statement/Prospectus and other relevant materials to be filed with the SEC regarding the Transaction when such materials become available. You may obtain free copies of these documents using the sources indicated above.

Cautionary Note Regarding Forward-Looking Statements

This communication contains “forward-looking statements” within the meaning of the federal securities laws, including Section 27A of the U.S. Securities Act of 1933, as amended, and Section 21E of the Securities Exchange Act of 1934, as amended. Any statements contained in this communication that are not statements of historical facts may be deemed to be forward-looking statements. In some cases, you can identify forward-looking statements by terms such as: “accelerate,” “anticipate,” “believe,” “can,” “continue,” “could,” “demand,” “design,” “estimate,” “expand,” “expect,” “intend,” “may,” “might,” “mission,” “need,” “objective,” “ongoing,” “outlook,” “plan,” “potential,” “predict,” “project,” “should,” “target,” “will,” “would,” or the negative of these terms, or other comparable terminology intended to identify statements about the future. All forward-looking statements by their nature address matters that involve risks and uncertainties, many of which are beyond our control and are not guarantees of future results, such as statements about the consummation of the proposed transaction and the anticipated benefits thereof. These forward-looking statements include, but are not limited to, statements regarding expected timing and benefits of the Transaction and the outlook for Marvell’s and Lumentum’s results of operations and financial condition, including potential synergies following the Transaction. It is uncertain whether any of the events anticipated by the forward-looking statements will transpire or occur, or if any of them do, what impact they will have on the results of operations and financial condition of the companies or the price of Marvell or Lumentum stock. These forward-looking statements involve known and unknown risks, uncertainties and other factors that may cause actual results, levels of activity, performance, benefits or achievements to be materially different from the information expressed or implied by these forward-looking statements. These risks and uncertainties include, but are not limited to, the following: general economic, market or business conditions, including competition and risks related to the semiconductor and optical networking industries generally; ongoing changes in the semiconductor and optical networking industries, including future growth rates, pricing trends in end-markets, or changes in customer capital spending patterns; risks related to the Transaction, including the effect of the announcement of the Transaction on the ability of Marvell or Lumentum to retain and hire key personnel and maintain relationships with customers, vendors and others with whom Marvell or Lumentum do business, or on Marvell’s or Lumentum’s operating results and business generally; risks that the Transaction disrupts current plans and operations and the potential difficulties in attracting and retaining qualified personnel as a result of the Transaction; the outcome of any legal proceedings related to the Transaction; the anticipated tax treatment of the transaction; the possible diversion of management’s time and attention from ongoing business operations and opportunities; the ability of the parties to consummate the Transaction on a timely basis or at all; the satisfaction of the conditions precedent to consummation of the Transaction, including the ability to secure stockholder and regulatory approvals on the terms expected, at all or in a timely manner; the occurrence of any event, change or other circumstance that could give rise to a right to terminate the Transaction; the ability to successfully integrate Marvell’s and Lumentum’s operations and business on a timely basis or otherwise; Marvell’s ability to implement the combined company’s plans, forecasts and other expectations with respect to its business after the completion of the Transaction and realize expected synergies and other benefits of the Transaction within the expected timeframe or at all; the amount of the costs, fees, expenses and charges related to the Transaction; the cash needs and availability of financing for Marvell and Lumentum in connection with, or following the completion of, the Transaction; fluctuations in the prices of Marvell or Lumentum stock; and potential business disruptions following the Transaction. These risks, as well as other risks related to the Transaction, will be included in the registration statement on Form S-4 and Joint Proxy Statement/Prospectus that will be filed with the SEC in connection with the Transaction. For additional information about other factors that could cause actual results to differ materially from those described in the forward-looking statements, please refer to Marvell’s and Lumentum’s respective periodic reports and other filings with the SEC, including the risk factors identified in Marvell’s and Lumentum’s most recent Quarterly Reports on Form 10-Q, Marvell’s most recent Annual Report on Form 10-K, which is available online at _https://www.sec.gov/Archives/edgar/data/1835632/000183563226000011/mrvl-20260131.htm _ and Lumentum’s most recent Annual Report on Form 10-K. which is available online at _https://www.sec.gov/Archives/edgar/data/0001633978/000162828026057358/lite-20260627.htm _, under the headings “Forward-Looking Statements” and “Risk Factors” in Part I, Item 1A (Annual Report) and in Part I, Item 2 and Part II, Item 1A (Quarterly Reports), all of which are available online free of charge on the SEC’s website at _https://www.sec.gov _. The forward-looking statements included in this communication are made only as of the date hereof and are based on the current beliefs of Marvell and Lumentum as well as assumptions made by and information currently available to them, which are subject to inherent uncertainties, risks and changes in circumstances that are difficult to predict. Neither Marvell nor Lumentum undertakes any obligation to update any forward-looking statements to reflect subsequent events or circumstances, except to the extent required by law. The information that can be accessed through hyperlinks or website addresses included in this communication is deemed not to be incorporated in or part of this communication. Marvell’s preliminary financial results presented in this press release are unaudited, represent management’s estimates based on information available as of the date of this release, and are subject to completion of Marvell’s quarter-end financial closing procedures and review by its independent registered public accounting firm. As a result, Marvell’s actual results for the quarter ended October 31, 2026 may differ materially from these preliminary estimates, including as a result of adjustments or changes in accounting estimates identified in the course of completing those procedures. Marvell undertakes no obligation to update or revise these preliminary results except as required by law. Complete results will be reported in Marvell’s Quarterly Report on Form 10-Q.

No Offer or Solicitation

This communication is not a proxy statement or solicitation of a proxy, consent or authorization with respect to any securities or in respect of the Transaction and does not constitute an offer to sell or the solicitation of an offer to buy any securities or a solicitation of any vote of approval, and there will not be any sale of securities in any jurisdiction in which such offer, solicitation or sale would be unlawful prior to registration or qualification under the securities laws of any such jurisdiction. No offering of securities will be made except by means of a prospectus meeting the requirements of Section 10 of the U.S. Securities Act of 1933, as amended, and otherwise in accordance with applicable law.

Category: Financial

View source version on businesswire.com: https://www.businesswire.com/news/home/20261102374788/en/

Marvell Investor Relations
Ross Seymore
Senior Vice President, Investor Relations
408-222-0777
[email protected]

Marvell Media
FGS Global
[email protected]

Lumentum Investor Relations
Kathy Ta
Vice President, Investor Relations
408-750-3853
[email protected]

Lumentum Media
Victoria McDonald
408-404-0636
[email protected]

Joele Frank, Wilkinson Brimmer Katcher
Eric Brielmann / Barrett Golden
(212) 355-4449
[email protected]

Source: Marvell Technology, Inc.

View All News

Prompts

Lumentum Holdings Inc. (ticker LITE), listed in United States.

Company History

Date Change Detail
Nov 8, 2018 Acquired Acquired Oclaro, Inc. (CIK 1110647). Its filings from before the deal are on its own company page, not shown here.

ETFs Holding Lumentum Holdings Inc.

ETF Weight in ETF Shares Market value As of
EGGQ 8.56% 9,234 $ 5.042M Nov 17, 2026
EGGY 6.85% 15,283 $ 8.345M Nov 17, 2026
MEME 4.73% 764 $ 427.817K Nov 17, 2026
EGGS 4.66% 4,091 $ 2.234M Nov 17, 2026
AIFD 4.35% 7,640 $ 5.455M Jul 31, 2026
JXX 3.38% 1,261 $ 900.278K Jul 31, 2026
SPRX 3.26% 11,080 $ 9.507M Jun 30, 2026
CBLS 2.64% 2,060 $ 1.471M Jul 31, 2026
CBSE 2.64% 1,913 $ 1.366M Jul 31, 2026
NBDS 2.61% 5,261 $ 4.813M Aug 31, 2026
HYP 2.59% 2,087 $ 1.791M Jun 30, 2026
ULTY 2.53% 23,500 $ 12.831M Nov 17, 2026
FEMG 2.34% 182 $ 156.167K Jun 30, 2026
JHAI 2.30% 754 $ 538.311K Jul 31, 2026
CHAT 2.19% 57,282 $ 31.276M Nov 17, 2026
TMAT 2.06% 6,854 $ 4.893M Jul 31, 2026
TCAI 1.88% 4,728 $ 4.325M Aug 31, 2026
JMID 1.88% 622 $ 444.071K Jul 31, 2026
CNAV 1.76% 1,278 $ 1.097M Jun 30, 2026
BAI 1.62% 335,460 $ 183.161M Nov 16, 2026
GTEK 1.59% 4,146 $ 3.793M Aug 31, 2026
TOLL 1.35% 866 $ 792.182K Aug 31, 2026
FFOG 1.35% 4,900 $ 4.204M Jun 30, 2026
BCTK 1.16% 2,773 $ 2.379M Jun 30, 2026
JTEK 1.14% 80,338 $ 44.987M Nov 17, 2026
FWD 1.10% 38,446 $ 35.169M Aug 31, 2026
TIME 1.09% 295 $ 161.07K Nov 17, 2026
WBIL 1.07% 379 $ 325.205K Jun 30, 2026
TEK 1.01% 683 $ 372.918K Nov 16, 2026
IQM 0.94% 1,293 $ 1.109M Jun 30, 2026
NUGO 0.84% 28,668 $ 20.467M Jul 31, 2026
XDAT 0.78% 34 $ 29.174K Jun 30, 2026
ALAI 0.75% 3,948 $ 3.388M Jun 30, 2026
ACGR 0.71% 82 $ 75.01K Aug 31, 2026
AIVL 0.61% 2,942 $ 2.524M Jun 30, 2026
LCAP 0.51% 10,905 $ 9.357M Jun 30, 2026
FEMV 0.49% 30 $ 25.742K Jun 30, 2026
SMIZ 0.49% 1,456 $ 1.332M Aug 31, 2026
FBCG 0.47% 45,311 $ 32.349M Jul 31, 2026
FCVT 0.42% 570 $ 311.22K Nov 16, 2026
UPSD 0.42% 684 $ 488.335K Jul 31, 2026
CLSE short -0.40% -3,922 $ -3.588M Aug 31, 2026
TCAF 0.37% 72,237 $ 39.441M Nov 17, 2026
HBTA 0.35% 937 $ 857.13K Aug 31, 2026
YNOT 0.33% 696 $ 636.673K Aug 31, 2026
FMDE 0.31% 26,975 $ 23.146M Jun 30, 2026
NBCR 0.30% 2,821 $ 2.581M Aug 31, 2026
TEC 0.30% 34 $ 20.285K Nov 13, 2026
EHLS 0.29% 283 $ 154.518K Nov 17, 2026
ESUM 0.27% 681 $ 486.193K Jul 31, 2026
VFMO 0.27% 5,591 $ 5.114M Aug 31, 2026
BAMG 0.25% 353 $ 322.91K Aug 31, 2026
FLCG 0.24% 1,632 $ 1.493M Aug 31, 2026
AIS 0.22% 2,894 $ 1.58M Nov 17, 2026
LQAI 0.20% 7 $ 4,372.55 Nov 12, 2026
GQQQ 0.20% 579 $ 320K Nov 18, 2026
FFLG 0.19% 1,531 $ 1.093M Jul 31, 2026
RUSC 0.18% 169 $ 145.012K Jun 30, 2026
SEIM 0.18% 3,174 $ 2.723M Jun 30, 2026
TRUT 0.18% 474 $ 460.377K Sep 30, 2026
AOTG 0.17% 192 $ 175.634K Aug 31, 2026
FLCC 0.16% 227 $ 207.651K Aug 31, 2026
DYNF 0.15% 112,231 $ 61.278M Nov 16, 2026
MCDS 0.15% 21 $ 11.759K Nov 17, 2026
PSTR 0.14% 100 $ 91.476K Aug 31, 2026
THRO 0.13% 24,867 $ 13.577M Nov 16, 2026
JGRO 0.13% 20,469 $ 11.462M Nov 17, 2026
MSLC 0.13% 5,686 $ 5.201M Aug 31, 2026
XMAG 0.12% 431 $ 269.224K Nov 13, 2026
HELO 0.12% 9,955 $ 5.575M Nov 17, 2026
INRO 0.11% 1,185 $ 647.01K Nov 16, 2026
DFAC 0.10% 143,660 $ 89.737M Nov 12, 2026
BDYN 0.10% 5,486 $ 2.939M Nov 16, 2026
ENHU 0.10% 17 $ 9,282.00 Nov 16, 2026
APUE 0.10% 2,710 $ 2.479M Aug 31, 2026
MODL 0.08% 985 $ 845.189K Jun 30, 2026
DFUS 0.08% 27,798 $ 17.364M Nov 12, 2026
AAUS 0.08% 767 $ 430K Nov 18, 2026
DCOR 0.07% 52,054 $ 32.516M Nov 12, 2026
BALI 0.07% 2,096 $ 1.144M Nov 16, 2026
JUSA 0.07% 1,154 $ 646.205K Nov 17, 2026
HCMT 0.07% 542 $ 386.955K Jul 31, 2026
DFAU 0.06% 12,798 $ 7.994M Nov 12, 2026
NTSX 0.06% 940 $ 806.576K Jun 30, 2026
GDE 0.06% 299 $ 273.513K Aug 31, 2026
NTSD 0.06% 23 $ 19.735K Jun 30, 2026
TACU 0.05% 18 $ 9,828.00 Nov 17, 2026
IQSZ 0.05% 131 $ 93.526K Jul 31, 2026
AVLC 0.05% 1,325 $ 723.45K Nov 16, 2026
RAA 0.05% 332 $ 284.876K Jun 30, 2026
LCTU 0.04% 821 $ 448.266K Nov 16, 2026
VOXP 0.04% 3 $ 2,141.82 Jul 31, 2026
MSSM 0.02% 174 $ 159.168K Aug 31, 2026
CSHP 0.02% 161 $ 87.906K Nov 16, 2026
GSPY 0.02% 283 $ 154.518K Nov 17, 2026
AVUS 0.01% 2,360 $ 1.289M Nov 16, 2026
AVSU 0.01% 83 $ 45.318K Nov 16, 2026
DFSU 0.01% 254 $ 158.661K Nov 12, 2026
FFSM 0.00% 90 $ 64.255K Jul 31, 2026
DXUV 0.00% 42 $ 26.235K Nov 12, 2026