August 6, 2026 PDF Version BRISTOL, R.I., Aug. 06, 2026 (GLOBE NEWSWIRE) -- KVH Industries, Inc. (Nasdaq: KVHI), reported financial results for the quarter ended June 30, 2026 today. The company will hold a conference call to discuss these results at…
August 6, 2026
PDF Version
BRISTOL, R.I., Aug. 06, 2026 (GLOBE NEWSWIRE) -- KVH Industries, Inc. (Nasdaq: KVHI), reported financial results for the quarter ended June 30, 2026 today. The company will hold a conference call to discuss these results at 9:00 a.m. ET today, which can be accessed at investors.kvh.com. Following the call, a replay of the webcast will be available through the company’s website.
SecondQuarter2026****Highlights
-
Total revenues in the second quarter of 2026 increased sequentially from the first quarter of 2026 by $1.4 million, or 4%, to $33.7 million. Total revenues increased by 27% in the second quarter of 2026 from $26.6 million in the second quarter of 2025, due to a $6.7 million increase in service sales and a $0.4 million increase in product sales.
-
Service revenue increased sequentially from the first quarter of 2026 by $1.6 million, or 6%, to $29.7 million in the second quarter of 2026. Service revenue increased by $6.7 million, or 29%, in the second quarter of 2026 compared to the second quarter of 2025.
-
Airtime revenue increased $1.4 million, or 5%, to $27.8 million in the second quarter of 2026 from $26.4 million in the first quarter of 2026. Airtime revenue increased $6.6 million, or 31%, in the second quarter of 2026 compared to the second quarter of 2025. The increase in airtime revenue was primarily due to an increase in subscribers for both Starlink and OneWeb.
-
Net income in the second quarter of 2026 was $0.2 million, or $0.01 per share, compared to a net income of $0.9 million, or $0.05 per share, in the second quarter of 2025.
-
Non-GAAP adjusted EBITDA was $3.0 million in the second quarter of 2026, compared to $2.7 million in the second quarter of 2025.
Commenting on the company’s second quarter results, Brent C. Bruun, KVH’s Chief Executive Officer, said, “Our second quarter results reflected the strength of our strategy—accelerating growth in LEO services, driven by Starlink, as we continue to outpace much of our industry through this transition. We are seeing growth in recurring service revenue, expansion of our subscriber base, and meaningful progress on strategic initiatives, including our new bundled multi-network service offerings. We remain focused on delivering innovative connectivity solutions for our customers while creating long-term value for our shareholders.”
| Financial Highlights -(in millions, except per share data) |
| |
| | | Three Months Ended | | Six Months Ended |
| | | June 30, | | June 30, |
| | | | 2026 | | | | 2025 | | | | 2026 | | | | 2025 | |
| GAAP Results | | | | | | | | |
| Revenue | | $ | 33.7 | | | $ | 26.6 | | | $ | 66.0 | | | $ | 52.0 | |
| Loss from operations | | $ | (0.1 | ) | | $ | (0.4 | ) | | $ | (0.2 | ) | | $ | (2.6 | ) |
| Net income (loss) | | $ | 0.2 | | | $ | 0.9 | | | $ | 0.8 | | | $ | (0.8 | ) |
| Net income (loss) per share | | $ | 0.01 | | | $ | 0.05 | | | $ | 0.04 | | | $ | (0.04 | ) |
| | | | | | | | | |
| Non-GAAP Adjusted EBITDA | | $ | 3.0 | | | $ | 2.7 | | | $ | 5.8 | | | $ | 3.7 | |
Second****Quarter Financial Summary
Revenue was $33.7 million for the second quarter of 2026, an increase of 27% compared to $26.6 million in the second quarter of 2025.
Service revenues for the second quarter were $29.7 million, an increase of $6.7 million compared to the second quarter of 2025. The increase in service sales was primarily due to a $6.6 million increase in our airtime service sales, which reflected a substantial increase in LEO service sales driven by an increase in subscribers for both Starlink and OneWeb. This increase in LEO service sales was partially offset by a substantial decrease in VSAT service sales, which was driven primarily by a decrease in VSAT subscribers. For the three months ended June 30, 2026, LEO service sales represented over 55% of airtime service sales, as compared to less than 32% for the three months ended June 30, 2025. The increase in LEO service sales as a percentage of total airtime sales resulted from both the substantial increase in LEO service sales and the substantial decrease in VSAT service sales.
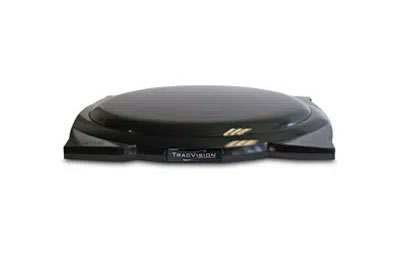
Product revenues for the second quarter were $4.0 million, an increase of 12% compared to the second quarter of 2025. The increase in product sales was primarily due to a $0.7 million increase in Starlink product sales and a $0.3 million increase in OneWeb product sales, partially offset by a $0.5 million decrease in TracVision product sales and a $0.2 million decrease in VSAT Broadband product sales. Competition from low-cost alternatives to VSAT, which include streaming capabilities, has had a significant impact on sales of our TracVision products.
Our operating expenses increased $0.9 million to $10.4 million for the second quarter of 2026, compared to $9.5 million in the second quarter of 2025. The increase was primarily due to a $0.4 million increase in salaries, benefits and taxes, a $0.3 million increase in professional fees, a $0.3 million increase in bad debt expense, a $0.1 million increase in amortization expense and a $0.1 million increase in computer expenses, partially offset by a $0.3 million decrease in warranty expense and a $0.1 million decrease in facilities expenses.
Six Months Ended June 30****Financial Summary
Revenue was $66.0 million for the six months ended June 30, 2026, an increase of 27% compared to $52.0 million for the six months ended June 30, 2025.
Service revenues for the six months ended June 30, 2026 were $57.9 million, an increase of 29% compared to the six months ended June 30, 2025. The increase in service sales was primarily due to an overall $12.7 million increase in our airtime service sales, which reflected a substantial increase in LEO service sales driven by an increase in subscribers for both Starlink and OneWeb, and a substantial decrease in VSAT subscribers. For the six months ended June 30, 2026, LEO service sales represented over 50% of airtime service sales, as compared to less than 30% for the six months ended June 30, 2025. The increase in LEO service sales as a percentage of total airtime sales resulted from both a substantial increase in LEO service sales and a substantial decrease in VSAT service sales. Competing LEO service providers have continued to expand their product and service offerings, further heightening competition in the global leisure segment and in commercial and government markets.
Product revenues for the six months ended June 30, 2026 were $8.2 million, an increase of 11% compared to the six months ended June 30, 2025. The increase in product sales was primarily due to a $1.0 million increase in Starlink product sales, a $0.9 million increase in OneWeb product sales, and a $0.4 million increase in accessory and service parts product sales, partially offset by a $1.0 million decrease in TracVision product sales and a $0.5 million decrease in VSAT Broadband product sales. Competition from low-cost alternatives to VSAT, which include streaming capabilities, has had a significant impact on sales of our TracVision products.
Our operating expenses increased $0.9 million to $20.1 million in the six months ended June 30, 2026, compared to $19.2 million in the six months ended June 30, 2025. This increase was primarily due to a $0.5 million increase in salaries, benefits and taxes, a $0.3 million increase in computer expenses, a $0.2 million increase in professional fees, a $0.2 million increase in bad debt expense and a $0.2 million increase in amortization expense, partially offset by a $0.4 million decrease in warranty expense and a $0.2 million decrease in dues and subscriptions.
Conference Call Details
KVH Industries will host a conference call today at 9:00 a.m. ET through the company’s website. The conference call can be accessed at investors.kvh.com and listeners are welcome to submit questions pertaining to the earnings release and conference call to [email protected]. The audio archive will be available on the company website within three hours of the completion of the call.
Non-GAAP Financial Measures
This release provides non-GAAP financial information as a supplement to our condensed consolidated financial statements, which are prepared in accordance with generally accepted accounting principles (“GAAP”). Management uses these non-GAAP financial measures internally in analyzing financial results to assess operational performance. The presentation of this financial information is not intended to be considered in isolation or as a substitute for the financial information prepared in accordance with GAAP. The non-GAAP financial measures used in this press release adjust for specified items that can be highly variable or difficult to predict. Management generally uses these non-GAAP financial measures to facilitate financial and operational decision-making, including evaluation of our historical operating results and comparison to competitors’ operating results. These non-GAAP financial measures reflect an additional way of viewing aspects of our operations that, when viewed with GAAP results and the reconciliations to corresponding GAAP financial measures, may provide a more complete understanding of factors and trends affecting our business.
Some limitations of non-GAAP adjusted EBITDA include the following: non-GAAP adjusted EBITDA represents net income (loss) before, as applicable, interest income, net, income tax expense (benefit), depreciation, amortization, stock-based compensation expense, goodwill impairment charges, long-lived assets impairment charges, charges for disposal of discontinued projects, loss on unfavorable future contracts, employee termination and other variable costs, executive separation costs, prior period tax settlements, transaction-related and other variable legal and advisory fees, certain inventory write-downs, excess purchase order obligations, gains on sales of real estate and other fixed assets, gains and losses on sale of subsidiaries, and foreign exchange transaction gains and losses.
Other companies, including companies in KVH’s industry, may calculate these non-GAAP financial measures differently or not at all, which will reduce their usefulness as a comparative measure.
Because non-GAAP financial measures exclude the effect of items that increase or decrease our reported results of operations, management strongly encourages investors to review our consolidated financial statements and publicly filed reports in their entirety. Reconciliations of the non-GAAP financial measures to the most directly comparable GAAP financial measures are included in the tables accompanying this release.
About KVH Industries, Inc.
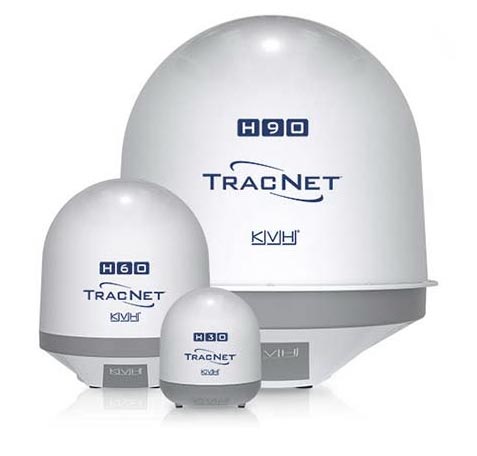
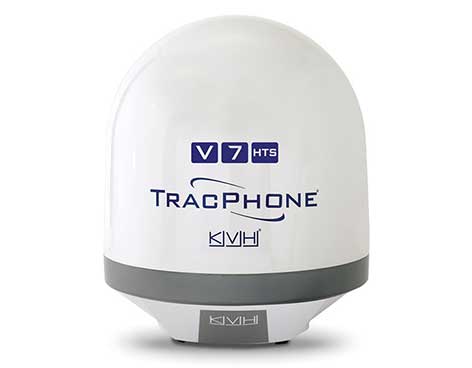
KVH Industries, Inc. is a global leader in maritime and mobile connectivity delivered via the KVH ONE network. The company, founded in 1982, is based in Bristol, RI, with more than a dozen offices around the globe. KVH provides connectivity solutions for commercial maritime, leisure marine, military/government, and land mobile applications on vessels and vehicles, including the TracNet, TracPhone, and TracVision product lines, the KVH ONE OpenNet Program for non-KVH antennas, AgilePlans Connectivity as a Service (CaaS), and the KVH Link crew wellbeing content service.
This press release contains forward-looking statements that involve risks and uncertainties. For example, forward-looking statements include statements regarding projected financial results, the anticipated benefits of our restructuring and other initiatives, demand for LEO-enabled connectivity, anticipated cost savings, our investment plans, our development goals, and the potential impact of our future initiatives on revenue, competitive positioning, profitability, and orders. In some cases, forward-looking statements can be identified by terminology such as “may,” “will,” “should,” “would,” “expects,” “plans,” “anticipates,” “believes,” “estimates,” “predicts,” “potential,” “continue,” or the negative of these terms or other comparable terminology. Actual results could differ materially from the results projected in or implied by the forward-looking statements made in this press release. Factors that might cause these differences include, but are not limited to: continued increasing competition, particularly from lower-cost providers, low earth orbit satellite systems and other telecommunications systems, especially in the global leisure market, which is significantly reducing demand for geosynchronous satellite services, including ours; generally lower product and service margins from reseller arrangements; increased financial dependence on reseller arrangements with a small number of airtime providers; the risk that sales of Starlink and OneWeb terminals will continue to slow down, decrease or become less profitable; the risk that we will be unable to consume the prepaid block of Starlink Mobile Priority data within the contract period, requiring us to expense the unused portion; potential hardware and software competition for our new CommBox product offerings; potential additional significant charges for excess and obsolete inventory; potential modification or discontinuation of customer and vendor contracts recently acquired from a third-party satellite service provider, which could result in material charges for impairment of acquired intangible assets; unanticipated obstacles to implementation of our manufacturing wind-down; unanticipated costs and expenses arising from the wind-down; unanticipated effects of the wind-down on our ongoing business; risks associated with the relocation of our operations, including potential disruptions; potential increases in LEO airtime expenses; potential reductions in gross margins arising from minimum purchase obligations to vendors in excess of our needs; risks associated with increased customer reliance on third-party hardware; the lack of future product differentiation; new service offerings from hardware providers; potential customer delays in selecting our services; the uncertain impact of continuing industry consolidation; the risk that companies that supply us with satellite network capacity, including Starlink, may vertically integrate, sell directly to end customers, expand their reseller networks or otherwise compete with us, or may cease providing capacity to us or do so on less favorable terms; the risk that our OpenNet program is leading to further reductions in sales of our satellite products; the risk that our current and future non-exclusive arrangements with Starlink and OneWeb will not provide material benefits; uncertainty regarding customer responses to new product and service introductions; challenges and potential additional expenses in retaining our employees, particularly in the current competitive labor market characterized by rising wages; the challenges of meeting customer expectations with a smaller employee base; uncertainties created by our new business strategy, which may impact customer recruitment and retention; the uncertain impact of ongoing disruptions in our supply chain and associated increases in our costs; the uncertain impact of inflation, particularly with respect to fuel costs, and fears of recession; potentially higher interest rates driven by increased government borrowing; the uncertain impact of the wars in Ukraine and the Middle East (including Iran) and international tensions in Asia, including the impact of dramatic shifts in U.S. geopolitical priorities; unanticipated changes or disruptions in our markets; technological breakthroughs by competitors; changes in customer priorities or preferences; increasing customer terminations; unanticipated liabilities, charges and write-offs; potential losses or expenses arising from cybersecurity breaches; the potential that competitors will design around or invalidate our intellectual property rights; a history of losses; continued fluctuations in quarterly results; the uncertain impact of recent and ongoing dramatic changes in both U.S. and foreign trade policy, including actual and potential new or higher tariffs and trade barriers, as well as trade wars with other countries; potentially inflationary impacts of tariffs and budget deficits; unanticipated obstacles in our product and service development, cost engineering and manufacturing efforts; adverse impacts of currency fluctuations, including potential further weakening of the U.S. dollar; our ability to successfully commercialize our new initiatives without unanticipated additional expenses or delays; reduced sales to companies in or dependent upon the turbulent oil and gas industry; the impact of extended economic weakness on the sale and use of marine vessels and recreational vehicles; continued challenges of maintaining our market share in the market for airtime services; the risk that declining sales of the TracNet H-series and TracPhone V-HTS series products and related services will continue to reduce airtime gross margins; the risk that reduced product sales will continue to erode product gross margins and lead to increased losses; potential continuing declines or changes in customer demand, due to economic, weather-related, seasonal, and other factors, particularly with respect to the TracNet H-series and TracPhone V-HTS series; exposure for potential intellectual property infringement; changes in tax and accounting requirements or assessments; and export restrictions, delays in procuring export licenses, and other international risks. These and other factors are discussed in more detail in our Annual Report on Form 10-K filed with the Securities and Exchange Commission on March 10, 2026, as they may be updated by subsequently filed Quarterly Reports on Form 10-Q. Copies are available through our Investor Relations department and website, investors.kvh.com. We do not assume any obligation to update our forward-looking statements to reflect new information and developments.
KVH Industries, Inc., has used, registered, or applied to register its trademarks in the USA and other countries around the world, including but not limited to the following marks: KVH, KVH ONE, TracPhone, TracVision, AgilePlans, CommBox, and TracNet. Other trademarks are the property of their respective companies.
| KVH INDUSTRIES, INC. AND SUBSIDIARIES CONDENSED CONSOLIDATED STATEMENTS OF OPERATIONS (in thousands, except per share amounts, unaudited) |
| |
| | | Three months ended June 30, | | Six months ended June 30, |
| | | | 2026 | | | | 2025 | | | | 2026 | | | | 2025 | |
| Sales: | | | | | | | | |
| Service | | $ | 29,711 | | | $ | 23,049 | | | $ | 57,865 | | | $ | 44,691 | |
| Product | | | 4,012 | | | | 3,574 | | | | 8,176 | | | | 7,346 | |
| Net sales | | | 33,723 | | | | 26,623 | | | | 66,041 | | | | 52,037 | |
| Costs and expenses: | | | | | | | | |
| Costs of service sales | | | 19,093 | | | | 14,210 | | | | 37,452 | | | | 28,445 | |
| Costs of product sales | | | 4,301 | | | | 3,277 | | | | 8,701 | | | | 7,017 | |
| Research and development | | | 805 | | | | 916 | | | | 1,531 | | | | 2,103 | |
| Sales, marketing and support | | | 5,237 | | | | 5,010 | | | | 10,306 | | | | 9,970 | |
| General and administrative | | | 4,363 | | | | 3,580 | | | | 8,245 | | | | 7,115 | |
| Total costs and expenses | | | 33,799 | | | | 26,993 | | | | 66,235 | | | | 54,650 | |
| Loss from operations | | | (76 | ) | | | (370 | ) | | | (194 | ) | | | (2,613 | ) |
| Interest income | | | 546 | | | | 579 | | | | 1,141 | | | | 1,146 | |
| Interest expense | | | — | | | | — | | | | (6 | ) | | | — | |
| Other (expense) income, net | | | (104 | ) | | | 826 | | | | 126 | | | | 817 | |
| Income (loss) before income tax expense | | | 366 | | | | 1,035 | | | | 1,079 | | | | (650 | ) |
| Income tax expense | | | 203 | | | | 105 | | | | 328 | | | | 130 | |
| Net income (loss) | | $ | 163 | | | $ | 930 | | | $ | 751 | | | $ | (780 | ) |
| | | | | | | | | |
| Net income (loss) per common share | | | | | | | | |
| Basic | | $ | 0.01 | | | $ | 0.05 | | | $ | 0.04 | | | $ | (0.04 | ) |
| Diluted | | $ | 0.01 | | | $ | 0.05 | | | $ | 0.04 | | | $ | (0.04 | ) |
| | | | | | | | | |
| Weighted average number of common shares outstanding: | | | | | | | | |
| Basic | | | 19,394 | | | | 19,401 | | | | 19,363 | | | | 19,446 | |
| Diluted | | | 19,666 | | | | 19,441 | | | | 19,554 | | | | 19,446 | |
| KVH INDUSTRIES, INC. AND SUBSIDIARIES CONDENSED CONSOLIDATED BALANCE SHEETS (in thousands, unaudited) |
| |
| | | June 30, 2026 | | December 31, 2025 |
| ASSETS | | | | |
| Cash and cash equivalents | | $ | 57,720 | | $ | 69,910 |
| Accounts receivable, net | | | 28,665 | | | 25,049 |
| Inventories, net | | | 11,856 | | | 14,859 |
| Prepaid expenses and other current assets | | | 19,770 | | | 7,980 |
| Total current assets | | | 118,011 | | | 117,798 |
| Property and equipment, net | | | 21,043 | | | 22,032 |
| Goodwill | | | 732 | | | 732 |
| Intangible assets, net | | | 3,954 | | | 3,717 |
| Right of use assets | | | 4,464 | | | 4,382 |
| Other non-current assets | | | 2,193 | | | 2,237 |
| Deferred income tax asset | | | 600 | | | 602 |
| Total assets | | $ | 150,997 | | $ | 151,500 |
| LIABILITIES AND STOCKHOLDERS’ EQUITY | | | | |
| Accounts payable and accrued expenses | | $ | 14,624 | | $ | 14,968 |
| Deferred revenue | | | 1,273 | | | 1,155 |
| Current operating lease liability | | | 790 | | | 547 |
| Total current liabilities | | | 16,687 | | | 16,670 |
| Long-term operating lease liability | | | 3,865 | | | 3,841 |
| Deferred income tax liability | | | 5 | | | 5 |
| Stockholders’ equity | | | 130,440 | | | 130,984 |
| Total liabilities and stockholders’ equity | | $ | 150,997 | | $ | 151,500 |
| KVH INDUSTRIES, INC. AND SUBSIDIARIES RECONCILIATION OF GAAP NET INCOME (LOSS) TO NON-GAAP EBITDA AND NON-GAAP ADJUSTED EBITDA (in thousands, unaudited) |
| |
| | | Three months ended June 30, | | Six months ended June 30, |
| | | | 2026 | | | | 2025 | | | | 2026 | | | | 2025 | |
| Net income (loss) - GAAP | | $ | 163 | | | $ | 930 | | | $ | 751 | | | $ | (780 | ) |
| Income tax expense | | | 203 | | | | 105 | | | | 328 | | | | 130 | |
| Interest income, net | | | (546 | ) | | | (579 | ) | | | (1,147 | ) | | | (1,146 | ) |
| Depreciation and amortization | | | 2,316 | | | | 2,606 | | | | 4,761 | | | | 5,494 | |
| Non-GAAP EBITDA | | | 2,136 | | | | 3,062 | | | | 4,693 | | | | 3,698 | |
| Stock-based compensation expense | | | 411 | | | | 434 | | | | 717 | | | | 771 | |
| Disposal of a discontinued project | | | — | | | | 287 | | | | — | | | | 287 | |
| Loss on an unfavorable future contract | | | — | | | | 12 | | | | — | | | | 12 | |
| Employee termination and other variable costs | | | 245 | | | | 26 | | | | 248 | | | | 29 | |
| Transaction-related and other variable legal and advisory fees | | | 76 | | | | 66 | | | | 76 | | | | 66 | |
| Loss (gain) on sale of fixed assets, including real estate | | | 144 | | | | (1,330 | ) | | | 128 | | | | (1,330 | ) |
| Foreign exchange transaction (gain) loss | | | 14 | | | | 101 | | | | (62 | ) | | | 132 | |
| Non-GAAP adjusted EBITDA | | $ | 3,026 | | | $ | 2,658 | | | $ | 5,800 | | | $ | 3,665 | |
| | | |
| Contact: | | KVH Industries, Inc. Anthony Pike 401-847-3327 [email protected] |

Search Investors