November 3, 2026 Growing Customer Demand and Backlog; Continued Program Wins; Continued Growth in Vietnam Production Spokane Valley, WA— November 3, 2026 — Key Tronic Corporation (Nasdaq: KTCC), a provider of electronic manufacturing services…
November 3, 2026
Growing Customer Demand and Backlog; Continued Program Wins; Continued Growth in Vietnam Production
Spokane Valley, WA— November 3, 2026 — Key Tronic Corporation (Nasdaq: KTCC), a provider of electronic manufacturing services (EMS), today announced its results for the quarter ended September 26, 2026.
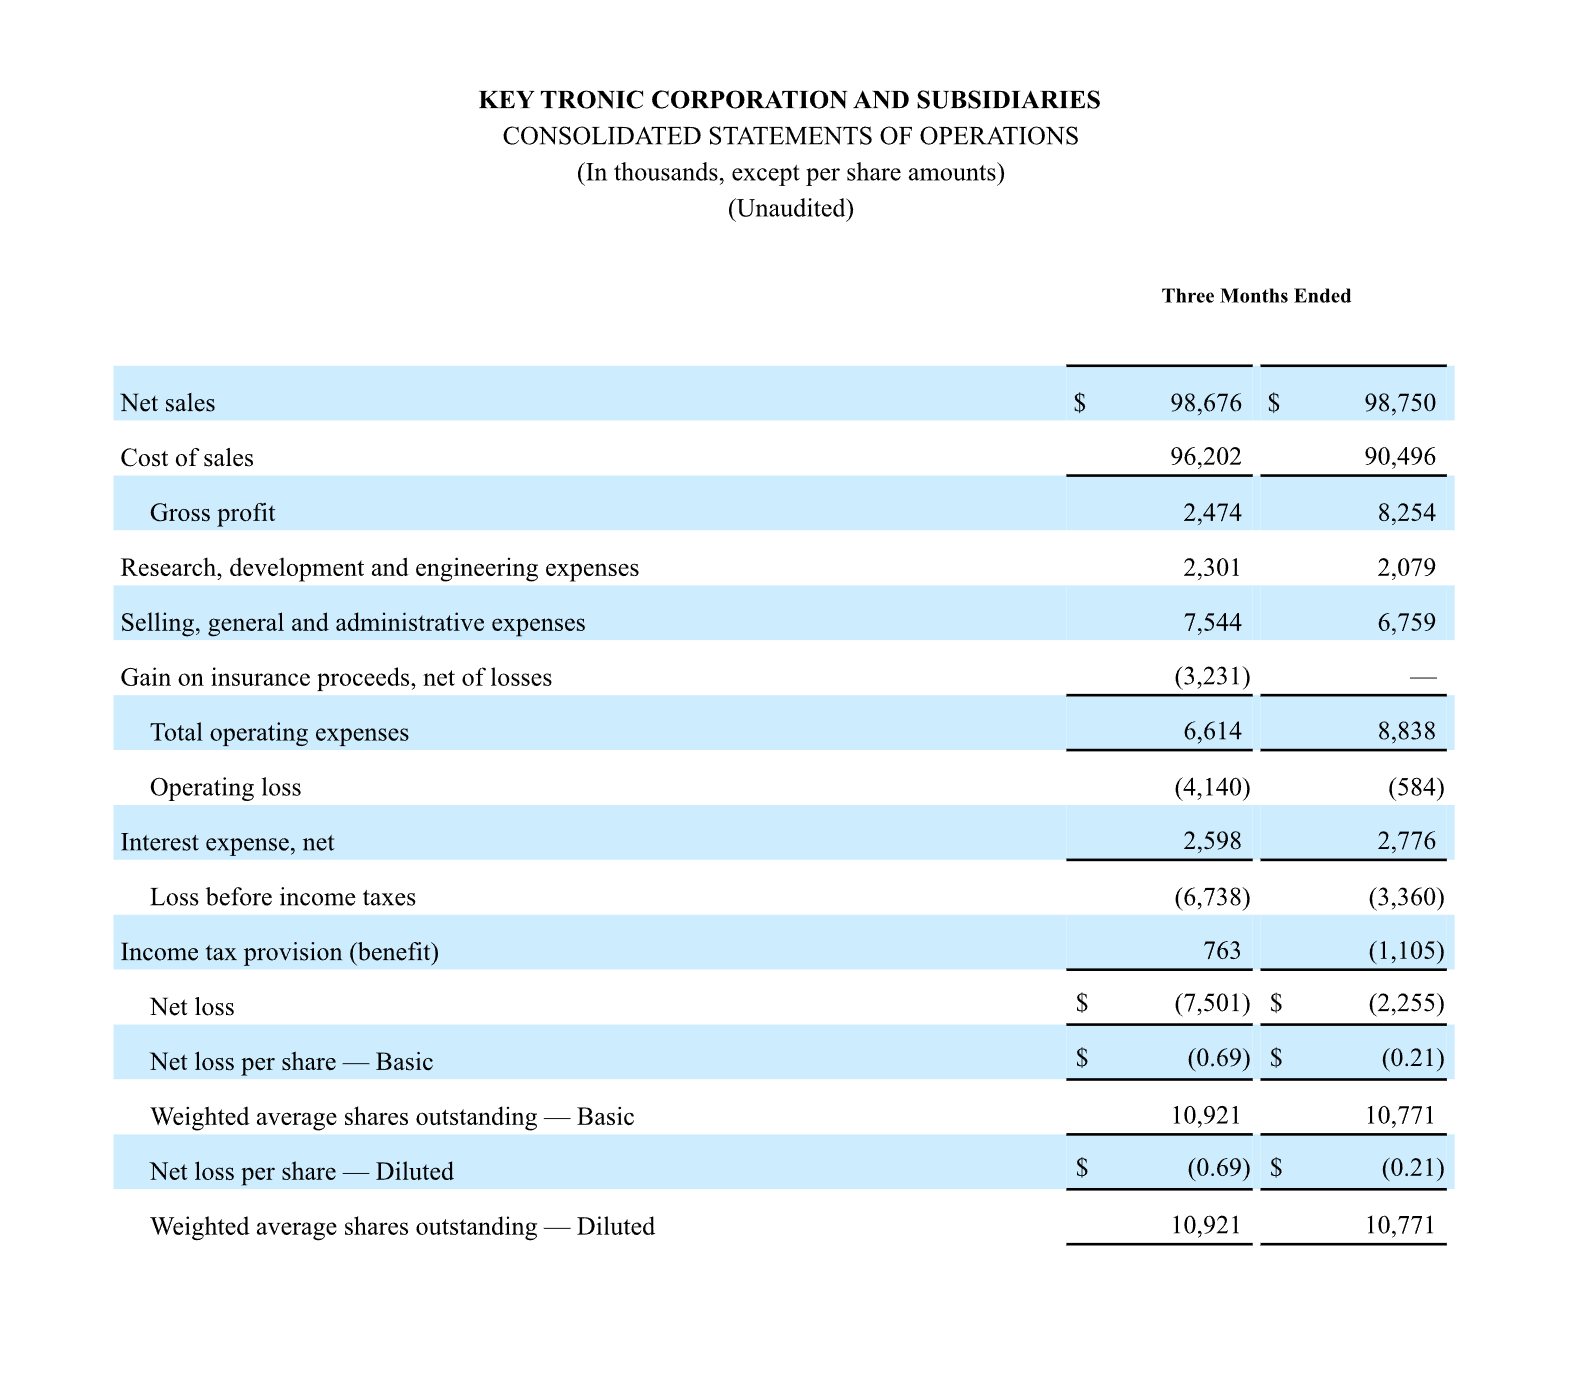
For the first quarter of fiscal year 2027, Key Tronic reported total revenue of $98.7 million, compared to $98.8 million in the same period of fiscal year 2026. Revenue for the first quarter of fiscal year 2027 continued to be constrained by tightening credit availability and liquidity pressures across the global supply chain. These supply chain financing constraints delayed approximately $18 million of the Company’s shipments during the quarter, mostly involving programs manufactured in Mexico and the US. Revenue from Key Tronic’s Vietnam-based production continued to grow, driven by medical device and consumer products programs.
The Company is actively working with its customers and suppliers, and exploring new sources of capital, to support growth and to ease supply chain financing constraints in future periods. At the same time, customer demand has continued to grow strongly, particularly for US-based production. Key Tronic’s backlog was $245.9 million in the first quarter of fiscal year 2027, up 76% from the same period in fiscal year 2026. Order backlog consists of purchase orders received for products expected to be shipped approximately within the next twelve months, although shipment dates are subject to change due to design modifications, customer forecast changes, or other customer requirements. The amount of backlog is not necessarily indicative of future sales but can be indicative of trends in expected future sales revenue.
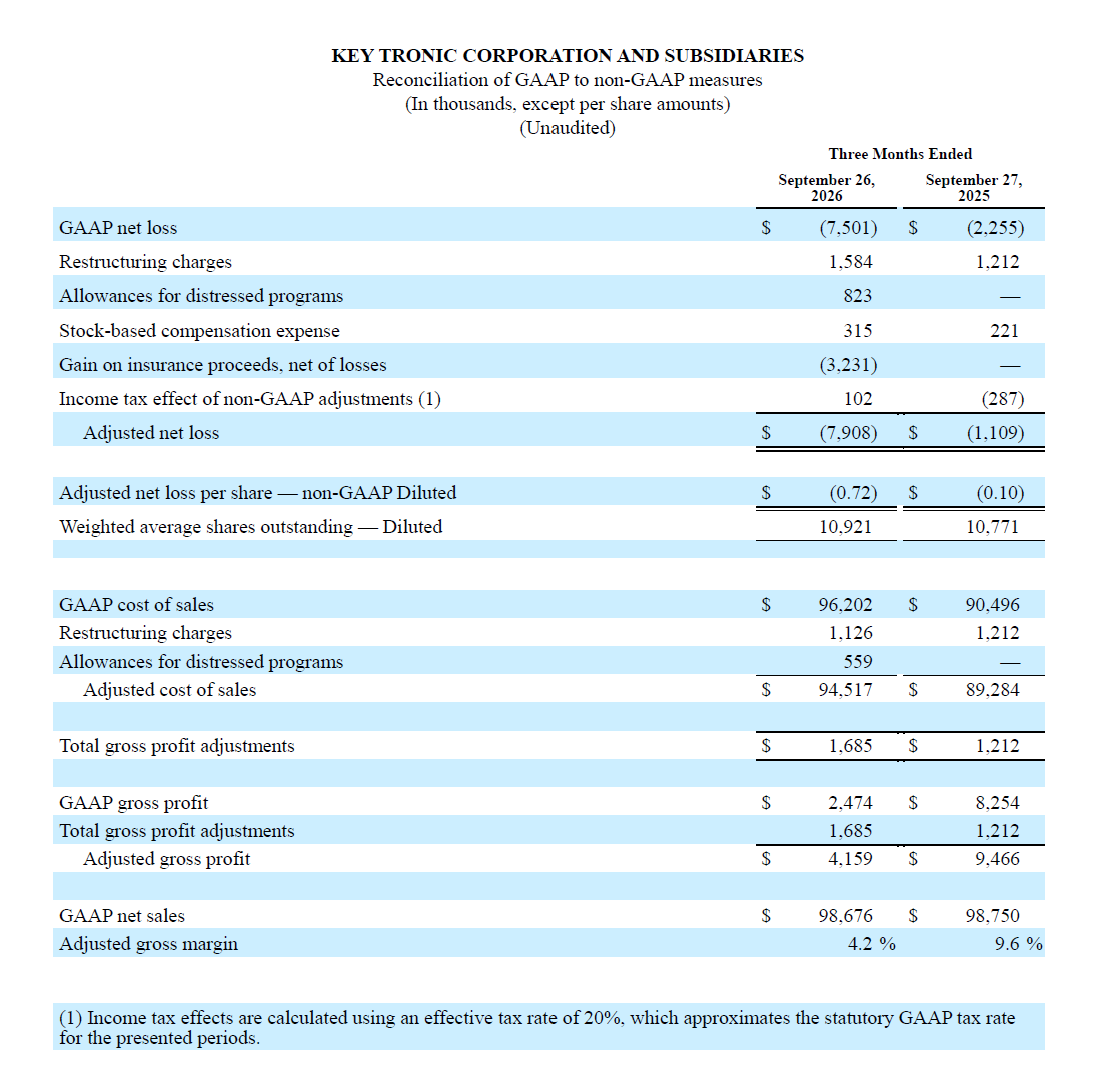
Gross margin was 2.5% in the first quarter of fiscal year 2027, compared to 8.4% in the same period of fiscal year 2026. Adjusted gross margin was 4.2% for the first quarter of fiscal year 2027, compared to 9.6% in the same period of fiscal year 2026 (see “Non-GAAP Financial Measures,” below for additional information about adjusted gross margin).
The sharp decline in gross margin in the first quarter of fiscal year 2027 reflects production delays caused by supply chain financing challenges and increased material costs, resulting in excess labor costs and operating inefficiencies at the Company’s Mexico and US facilities. Gross profit in the first quarter of fiscal 2027 was further reduced by approximately $6 million of inventory sales with no margin contribution and $4.7 million of manufacturing cost variances that were recognized in cost of goods sold rather than reflected in inventory due to U.S. GAAP inventory valuation requirements.
Operating margin was (4.2)% in the first quarter of fiscal year 2027, compared to (0.6)% in the same period of fiscal year 2026. The decline in operating margin for the first quarter of fiscal 2027 reflects the drop in gross margin as well as approximately $0.5 million in write-offs of bad debt. These adverse impacts were partially offset by a $3.2 million insurance recovery related to a roof replacement at the Company’s Mississippi facility.
The Company is also in the process of streamlining its US-based workforce, which is expected to reduce labor costs by approximately $8 million annually when completed. With revenue expected to rebound, Key Tronic anticipates margin growth in coming quarters.
The Company’s net loss was $(7.5) million or $(0.69) per share for the first quarter of fiscal year 2027, compared to net loss of $(2.3) million or $(0.21) per share for the same period of fiscal year 2026. The adjusted net loss was $(7.9) million or $(0.72) per diluted share for the first quarter of fiscal year 2027, compared to adjusted net loss of $(1.1) million or $(0.10) per diluted share for the same period of fiscal year 2026. See “Non-GAAP Financial Measures,” below for additional information about adjusted net loss and adjusted net loss per share.
“Customer demand remains strong, as our growing backlog demonstrates, but near-term liquidity challenges across the global supply chain have significantly constrained revenue in recent quarters,” said Brett Larsen, President and CEO. “Despite these challenges, we believe our operational discipline, strengthened manufacturing footprint, and long-standing customer relationships position us better than many competitors, enabling us to keep winning business and ramping up new programs.”
“In the first quarter of fiscal 2027, we won new programs in utilities power management, sustainable waste management, data centers, construction, and defense technology, representing more than $60 million in potential annual revenue. We also recently announced plans by TP-Link Systems, a global leader in networking and smart home solutions, to partner with us on US assembly of its next-generation technologies.”
“Our growing backlog, program wins and new business pipeline reflect our strong competitive position. While we first must navigate the ongoing near-term liquidity challenges, we expect revenue growth and a return to profitability in the second half of fiscal 2027.”
The financial data presented for the first quarter of fiscal year 2027 should be considered preliminary and could be subject to change, as the Company’s independent auditor has not completed their review procedures.
Business Outlook
Due to uncertainty in the timing of new program ramps, continued macroeconomic uncertainty, and current capital constraints, Key Tronic will not be issuing revenue or earnings guidance for the second quarter of fiscal year 2027.
Conference Call
Key Tronic will host a conference call to discuss its financial results at 2:00 PM Pacific (5:00 PM Eastern) today. A broadcast of the conference call will be available at www.keytronic.com under “Investor Relations” or by calling 800-330-6710 or +1-213-279-1505 (Access Code: 9993313). The Company will also reference accompanying slides that can be viewed with the webcast at www.keytronic.com under “Investor Relations”. A replay will be available at www.keytronic.com under “Investor Relations”.
About Key Tronic
Key Tronic is a leading contract manufacturer offering value-added design, sourcing and manufacturing services from its facilities in the United States, Mexico, and Vietnam. The Company provides its customers with full engineering services, materials management, worldwide manufacturing facilities, assembly services, in-house testing, and worldwide distribution. Its customers include some of the world’s leading original equipment manufacturers. For more information about Key Tronic visit: www.keytronic.com
Forward-Looking Statements
Some of the statements in this press release are forward-looking statements within the meaning of the Private Securities Litigation Reform Act of 1995. Forward-looking statements include, but are not limited to those including such words as aims, anticipates, believes, continues, estimates, expects, hopes, intends, plans, predicts, projects, targets, will, or would, similar verbs, or nouns corresponding to such verbs, which may be forward looking. Forward-looking statements also include other passages that are relevant to expected future events, performances, and actions or that can only be fully evaluated by events that will occur in the future. Forward-looking statements in this release include, without limitation, the Company’s statements regarding its expectations with respect to financial conditions and results, including revenue, earnings, and margins, the Company’s plans to address production constraints, including its ability to access additional capital, the Company’s ability to shift its focus in China and build out production capacity in the US and Vietnam and the timing of completion of those facilities, cost savings from headcount reduction, cost savings from the wind-down of manufacturing operations in China, demand for certain products and the effectiveness of some of its programs, business from customers and programs, new program launches, impacts from operational streamlining and efficiencies, including reductions in inventories, future utilization of certain tax benefits, and impacts of repairs to its facilities from winter storm damage. There are many factors, risks and uncertainties that could cause actual results to differ materially from those predicted or projected in forward-looking statements, including but not limited to: the future of the global economic environment and its impact on our customers and suppliers; the impact of new governmental legislation and regulation, including tax reform, tariffs and related activities, such as trade negotiations and other risks; the success and timing of our expansion plans; the availability of components from the supply chain; the availability of a healthy workforce; the accuracy of suppliers’ and customers’ forecasts; development and success of customers’ programs and products; timing and effectiveness of ramping of new programs; success of new-product introductions; the risk of legal proceedings relating to the previously reported financial statement restatements and related material weaknesses, the May 2024 cybersecurity incident and the subject of the internal investigation by the Company’s Audit Committee and related or other unrelated matters; acquisitions or divestitures of operations or facilities; technology advances; changes in pricing policies by the Company, its competitors, customers or suppliers; and other factors, risks, and uncertainties detailed from time to time in the Company’s SEC filings.
Non-GAAP Financial Measures
To supplement our consolidated financial statements, which are prepared in accordance with generally accepted accounting principles in the United States (GAAP), we use certain non-GAAP financial measures; adjusted net loss, and adjusted net loss per share, diluted. We provide these non-GAAP financial measures because we believe they provide greater transparency related to our core operations and represent supplemental information used by management in its financial and operational decision making. We exclude (or include) certain items in our non-GAAP financial measures as we believe the net result is a measure of our core business. We believe this facilitates operating performance comparisons from period to period by eliminating potential differences caused by the existence and timing of certain income and expense items that would not otherwise be apparent on a GAAP basis.
In addition, during this period, we have provided adjusted cost of sales, adjusted gross profit, and adjusted gross margin. These additions supplement adjusted net loss by mapping the portion of the identified adjustments utilized in the calculation of adjusted net loss to relevant financial statement line items for re-calculation of the adjusted metrics presented. We have provided these additional non-GAAP financial measures because we believe they provide greater transparency related to our core operations and represent supplemental information used by management in its financial and operational decision making.
Non-GAAP performance measures should be considered in addition to, and not as a substitute for, results prepared in accordance with GAAP. We strongly encourage investors and shareholders to review our financial statements and publicly-filed reports in their entirety and not to rely on any single financial measure. Our non-GAAP financial measures may be different from those reported by other companies.
See the table below entitled “Reconciliation of GAAP to non-GAAP measures” for reconciliations of adjusted net loss and adjusted cost of sales to the most directly comparable GAAP measure, which is GAAP net loss, and GAAP cost of sales, respectively, as well as the computation of adjusted gross profit, adjusted gross margin, and adjusted net loss per share, diluted.
Share this :
PrevPreviousKeytronic Corporation Announces Results for the Fourth Quarter of Fiscal Year 2026
Schedule a Meeting

Providing our customers superior manufacturing and engineering services at the lowest total cost for the highest quality products, creating long-term mutually beneficial business relationships.
Jki-facebook-light Instagram Linkedin Youtube X-twitter
Contact
Quick Links

Schedule a Meeting
Schedule a Meeting
Copyright © 2026 Keytronic. All Rights Reserved. Design by Victory
.
(888) 894-1074