KOSS
Fiscal year ends June Quarters are offset from the calendar — Q1 is Jul–Sep

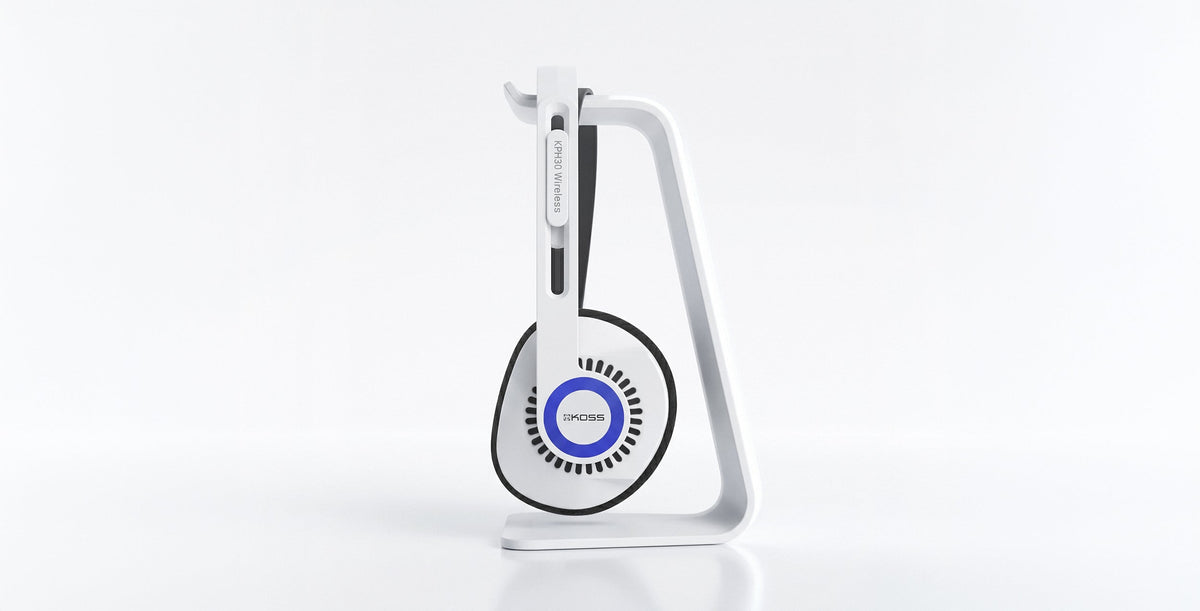
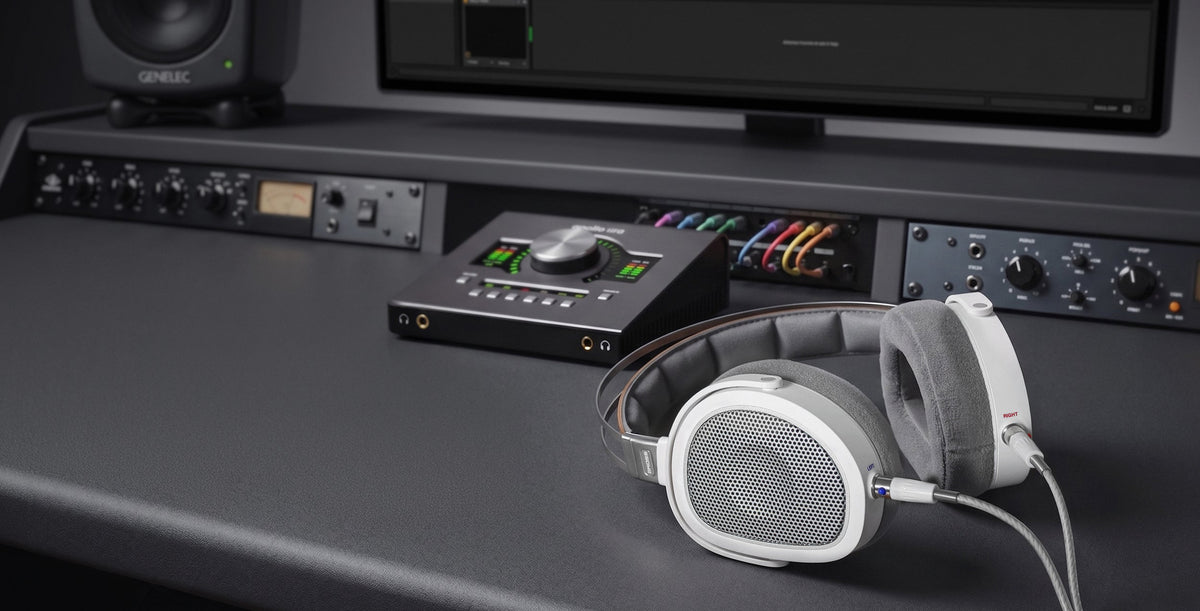
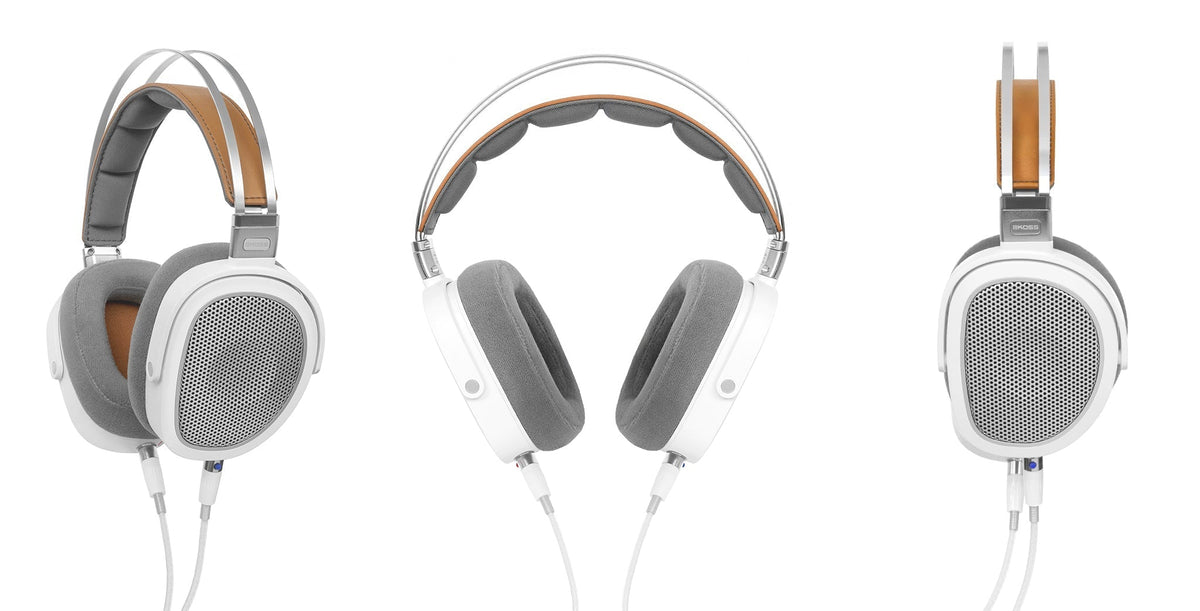
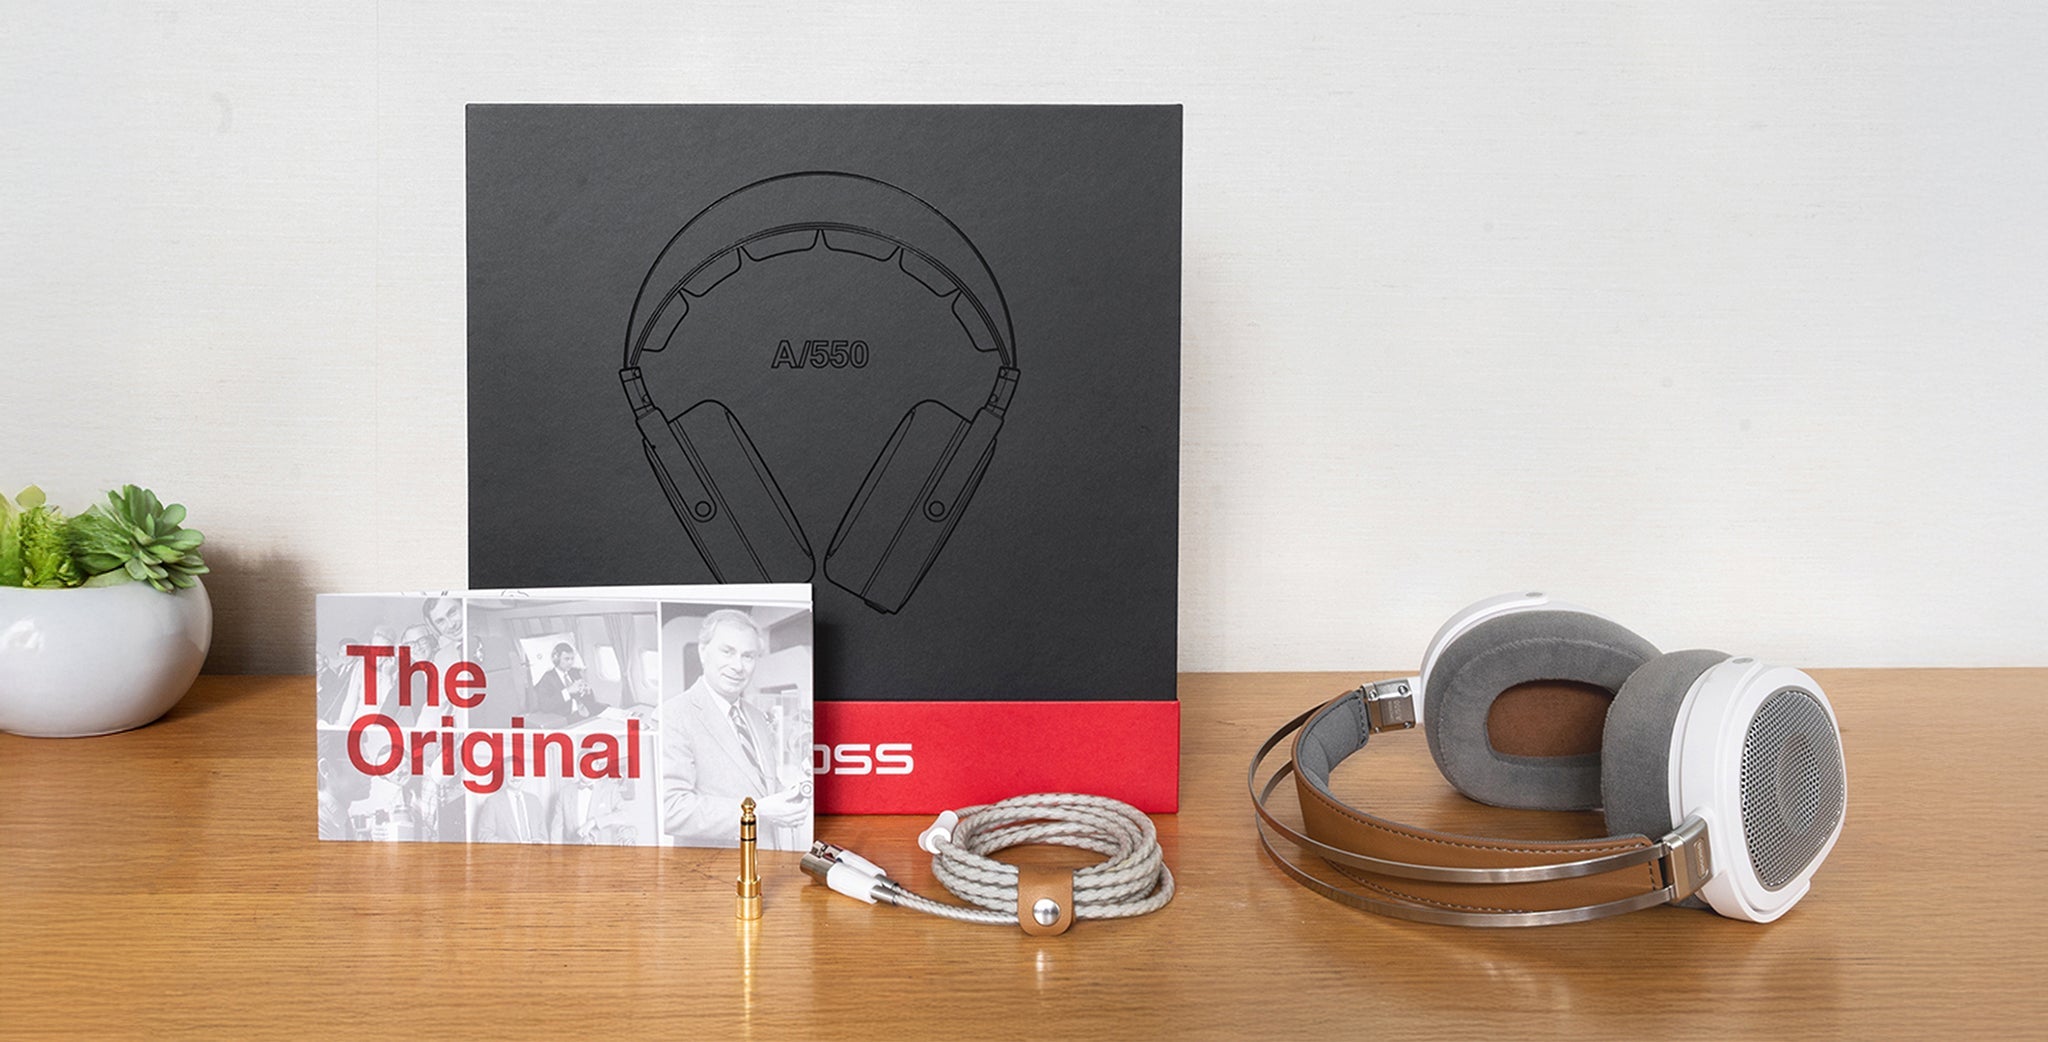
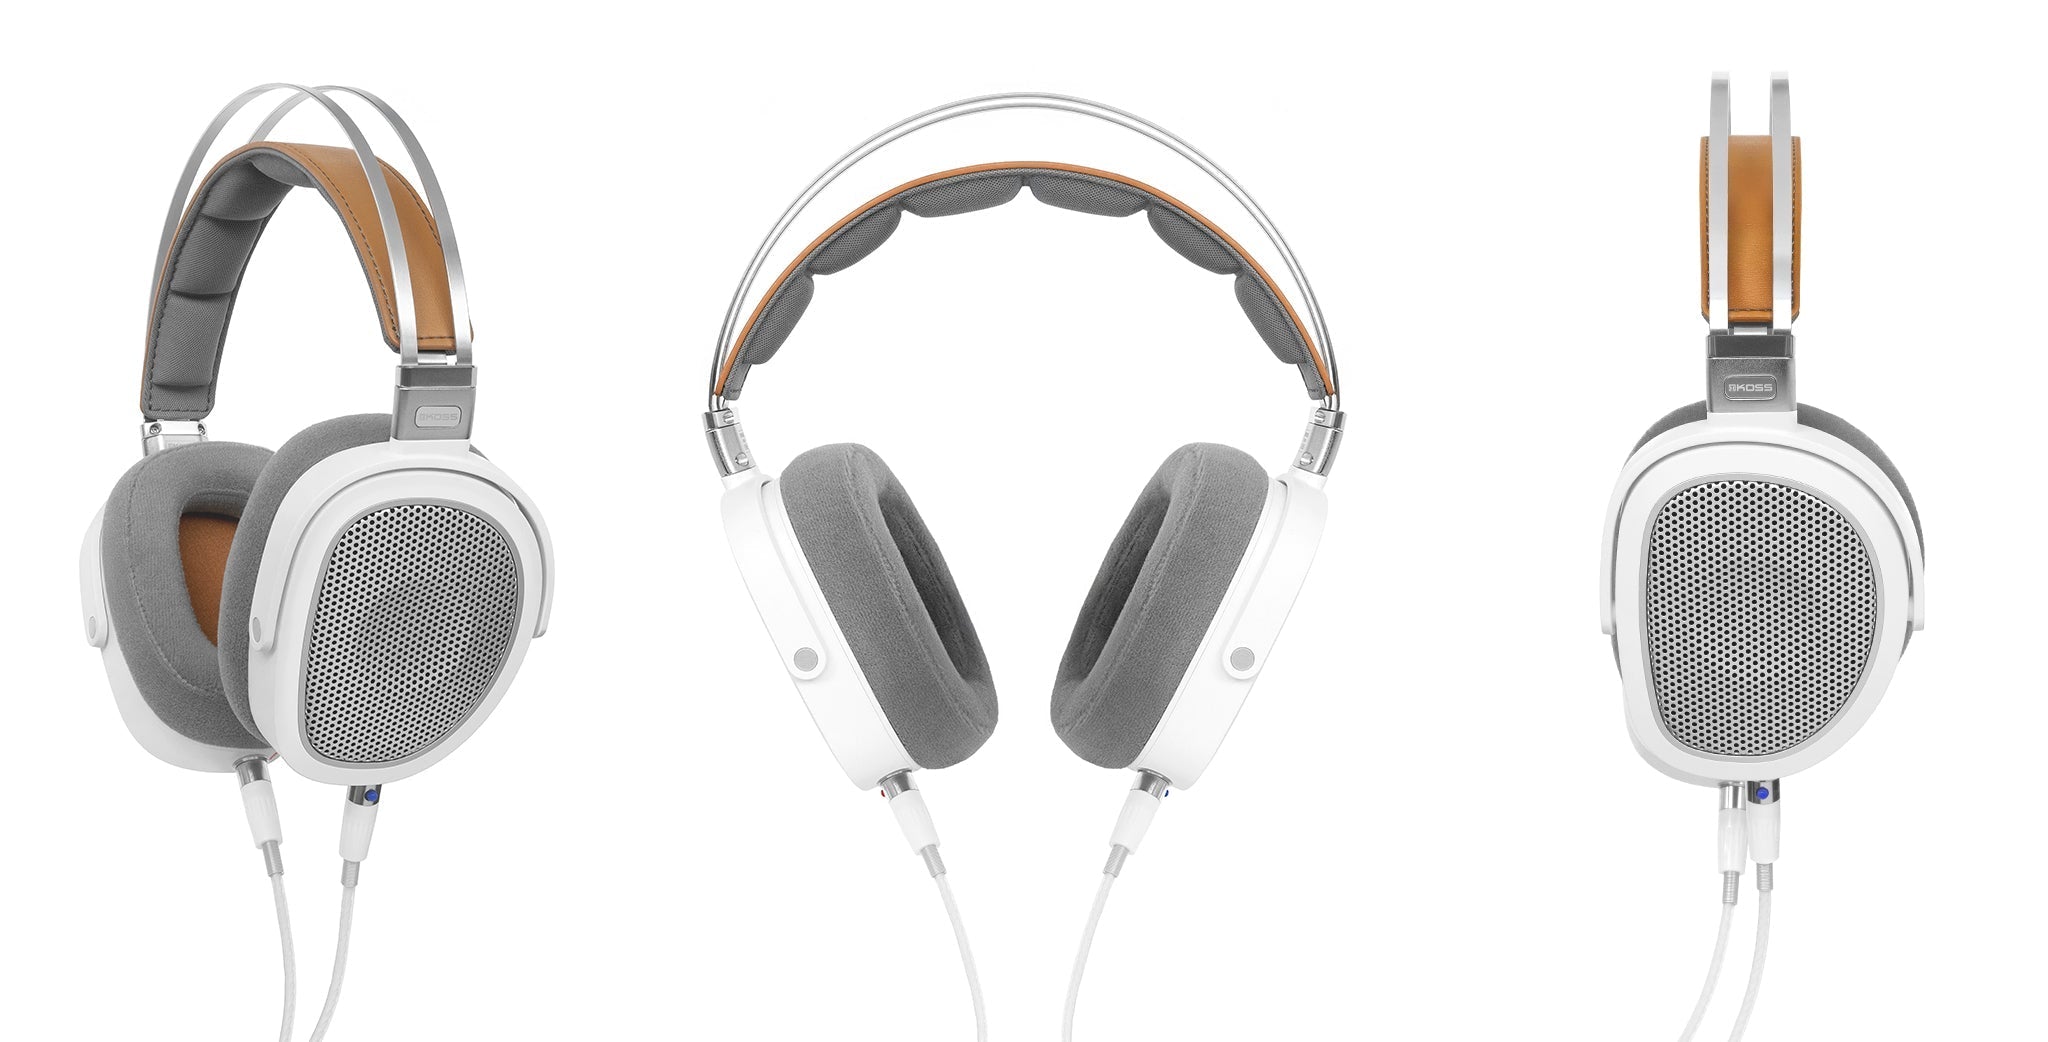
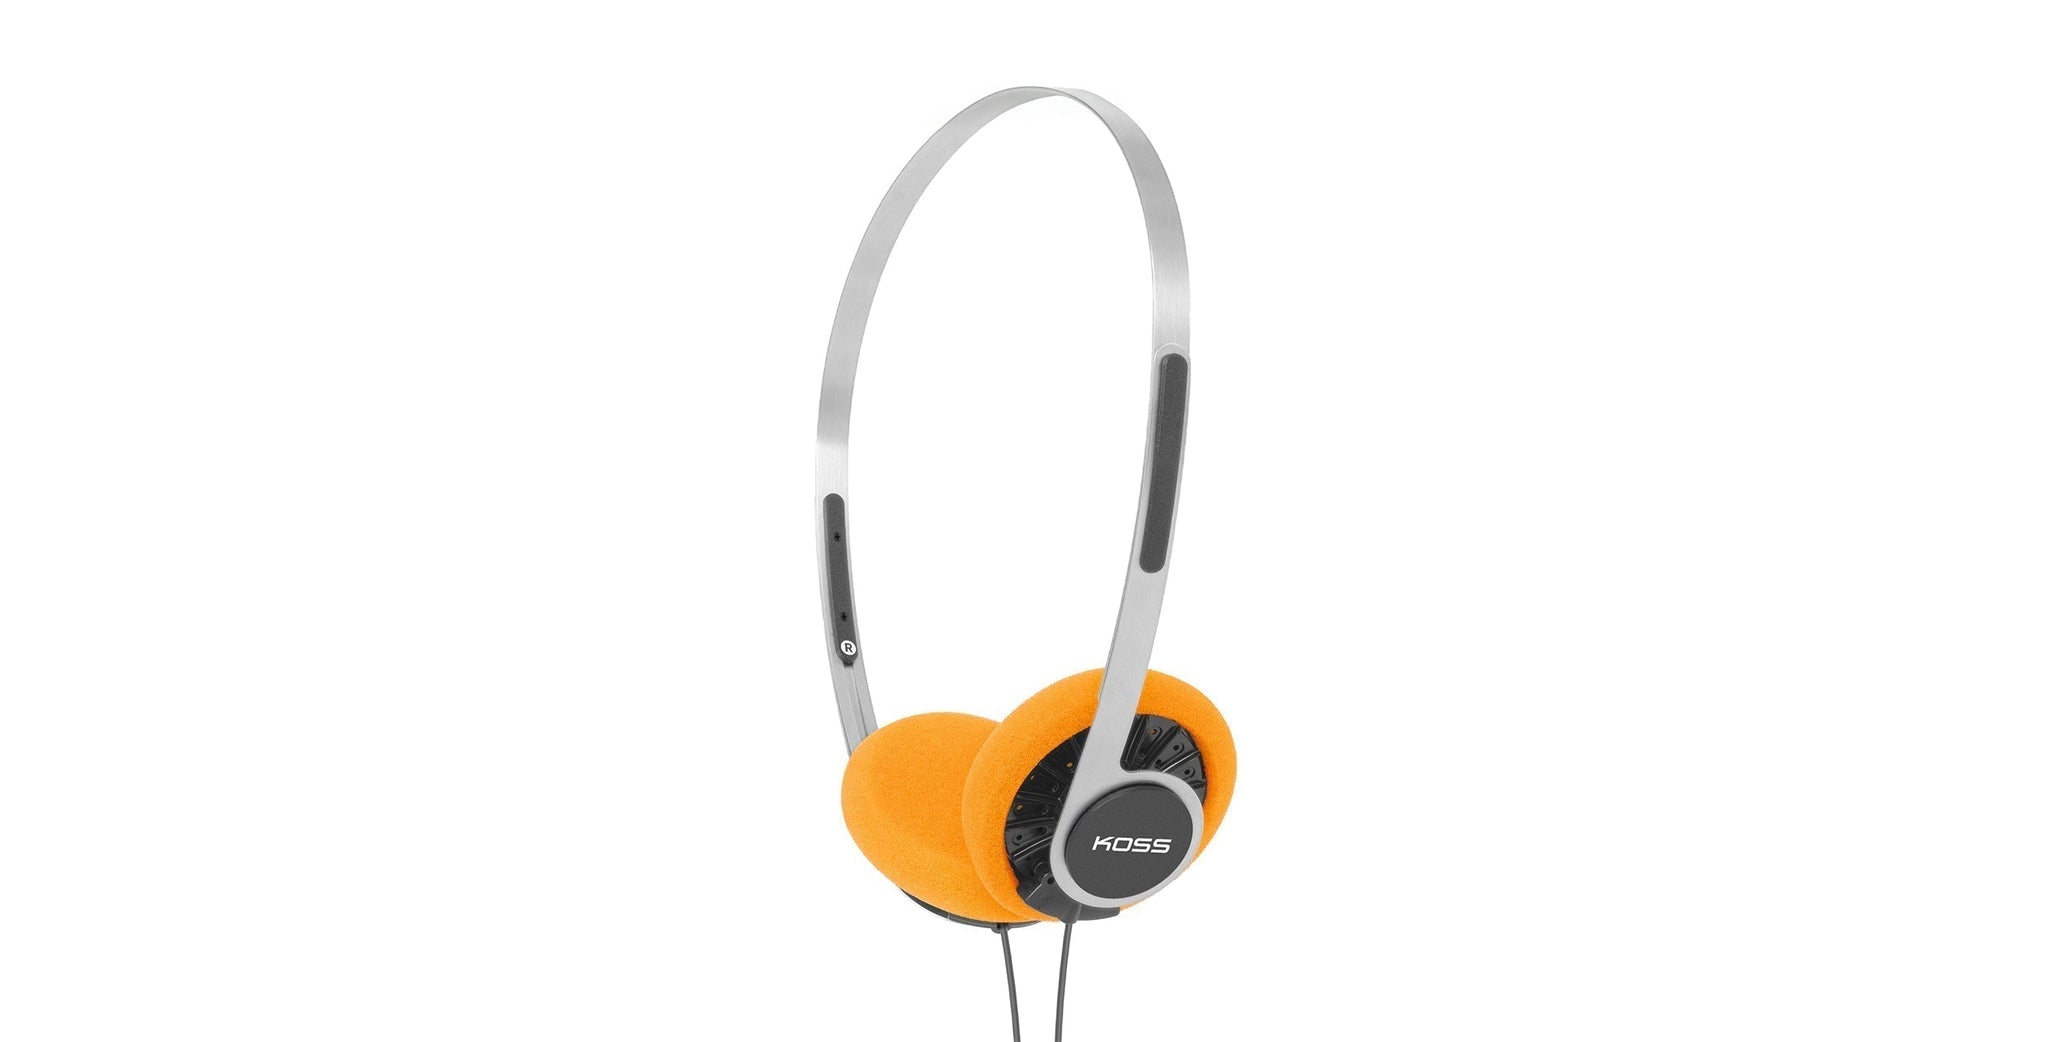
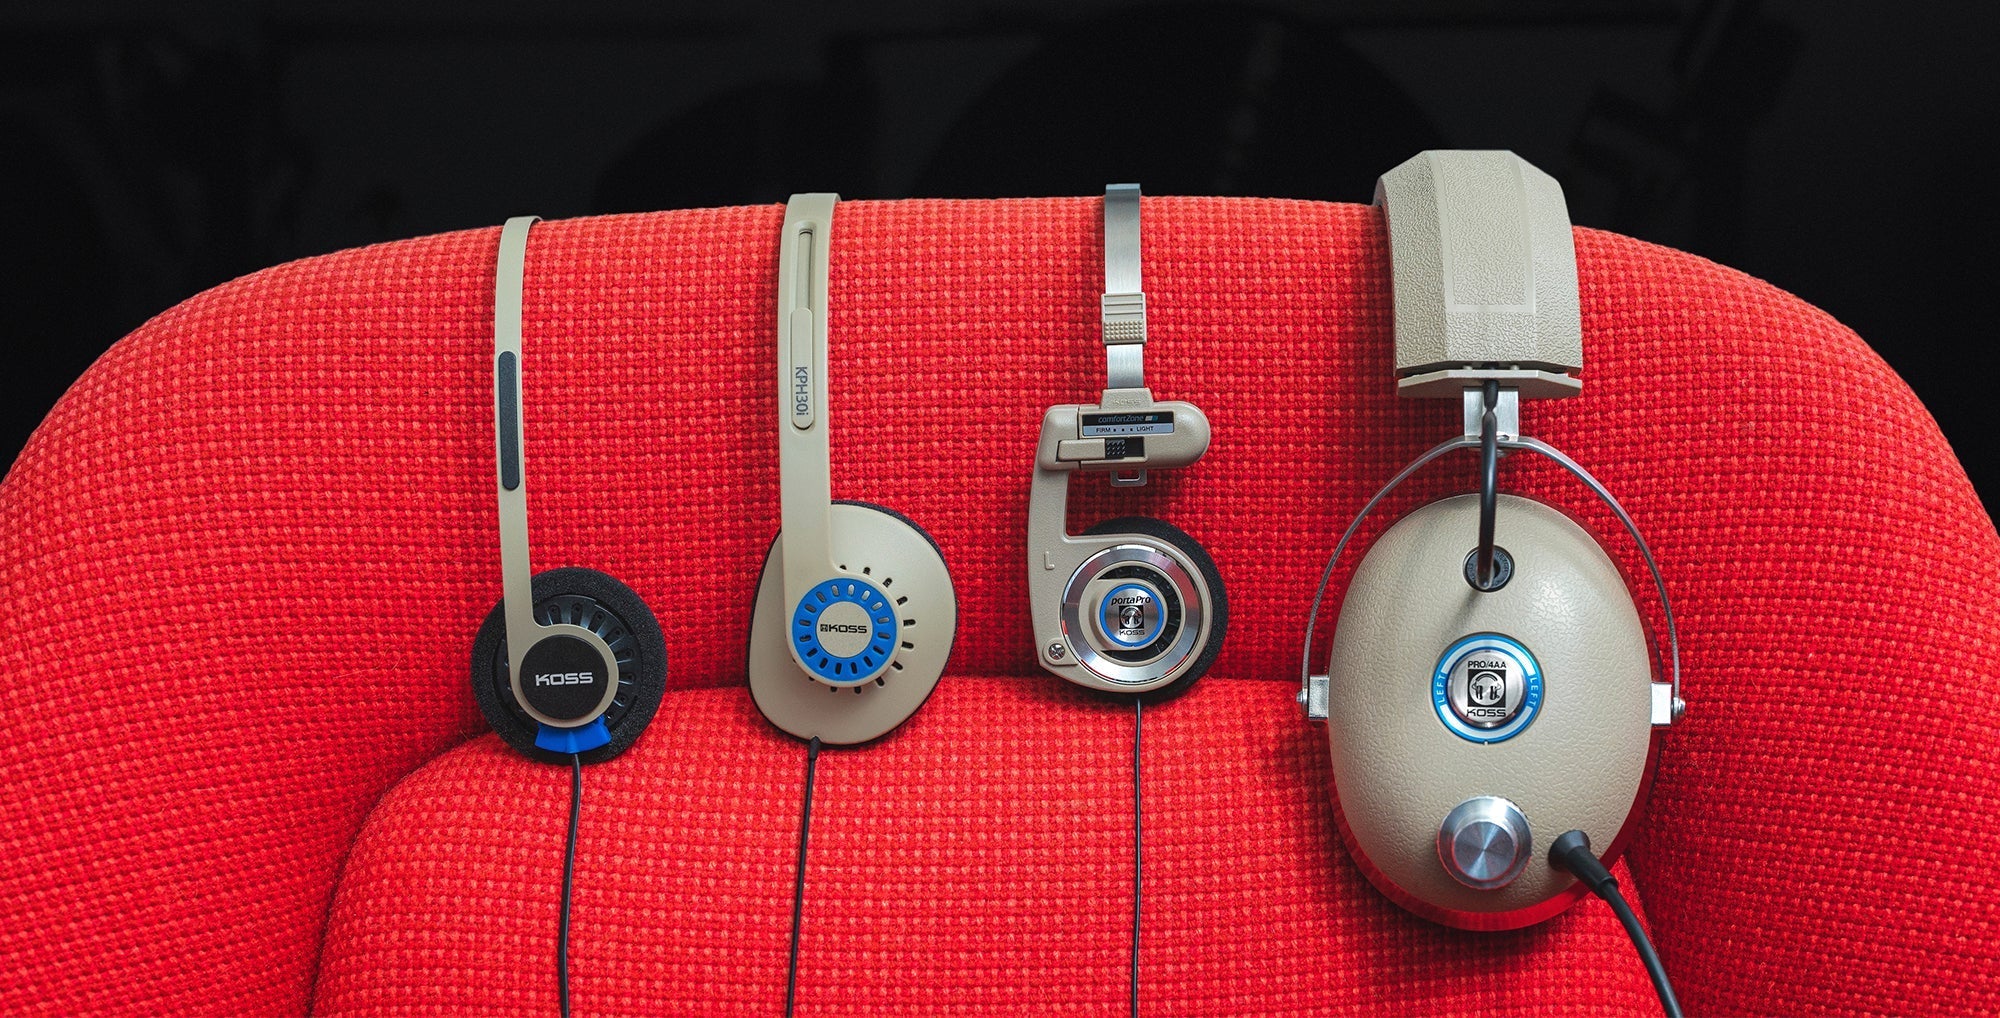
Koss Corporation is a manufacturer and seller of stereo headphones and related personal listening accessories. The company designs, manufactures, and sells products under the Koss brand as well as private label for original equipment manufacturers. Its product line includes wired and Bluetooth headphones, headsets for communication and education, and accessories for use with metal detectors. Koss sources complete headphones from manufacturers in Asia and produces components at its plant in Milwaukee, Wisconsin. The company sells through U.S. and international distributors, audio specialty stores, national retailers, grocery stores, electronics retailers, and direct-to-consumer channels including its own website and online marketplaces. It also supplies products to school systems, prisons, and other manufacturers for inclusion in their own products. Koss was incorporated in 1971, although the founder created the first personal stereo headphone in 1958. The company holds numerous trademarks and patents globally to protect its brand and product designs. It competes in the stereo headphone market against larger, diversified competitors. Koss has announced a strategy to pursue acquisitions to diversify its business beyond consumer electronics.

Summarised from the company's own disclosures, fiscal year ended Aug 2026

Industry Consumer Electronics Homepage koss.com
Sector Technology IR page investors.koss.com
Tags
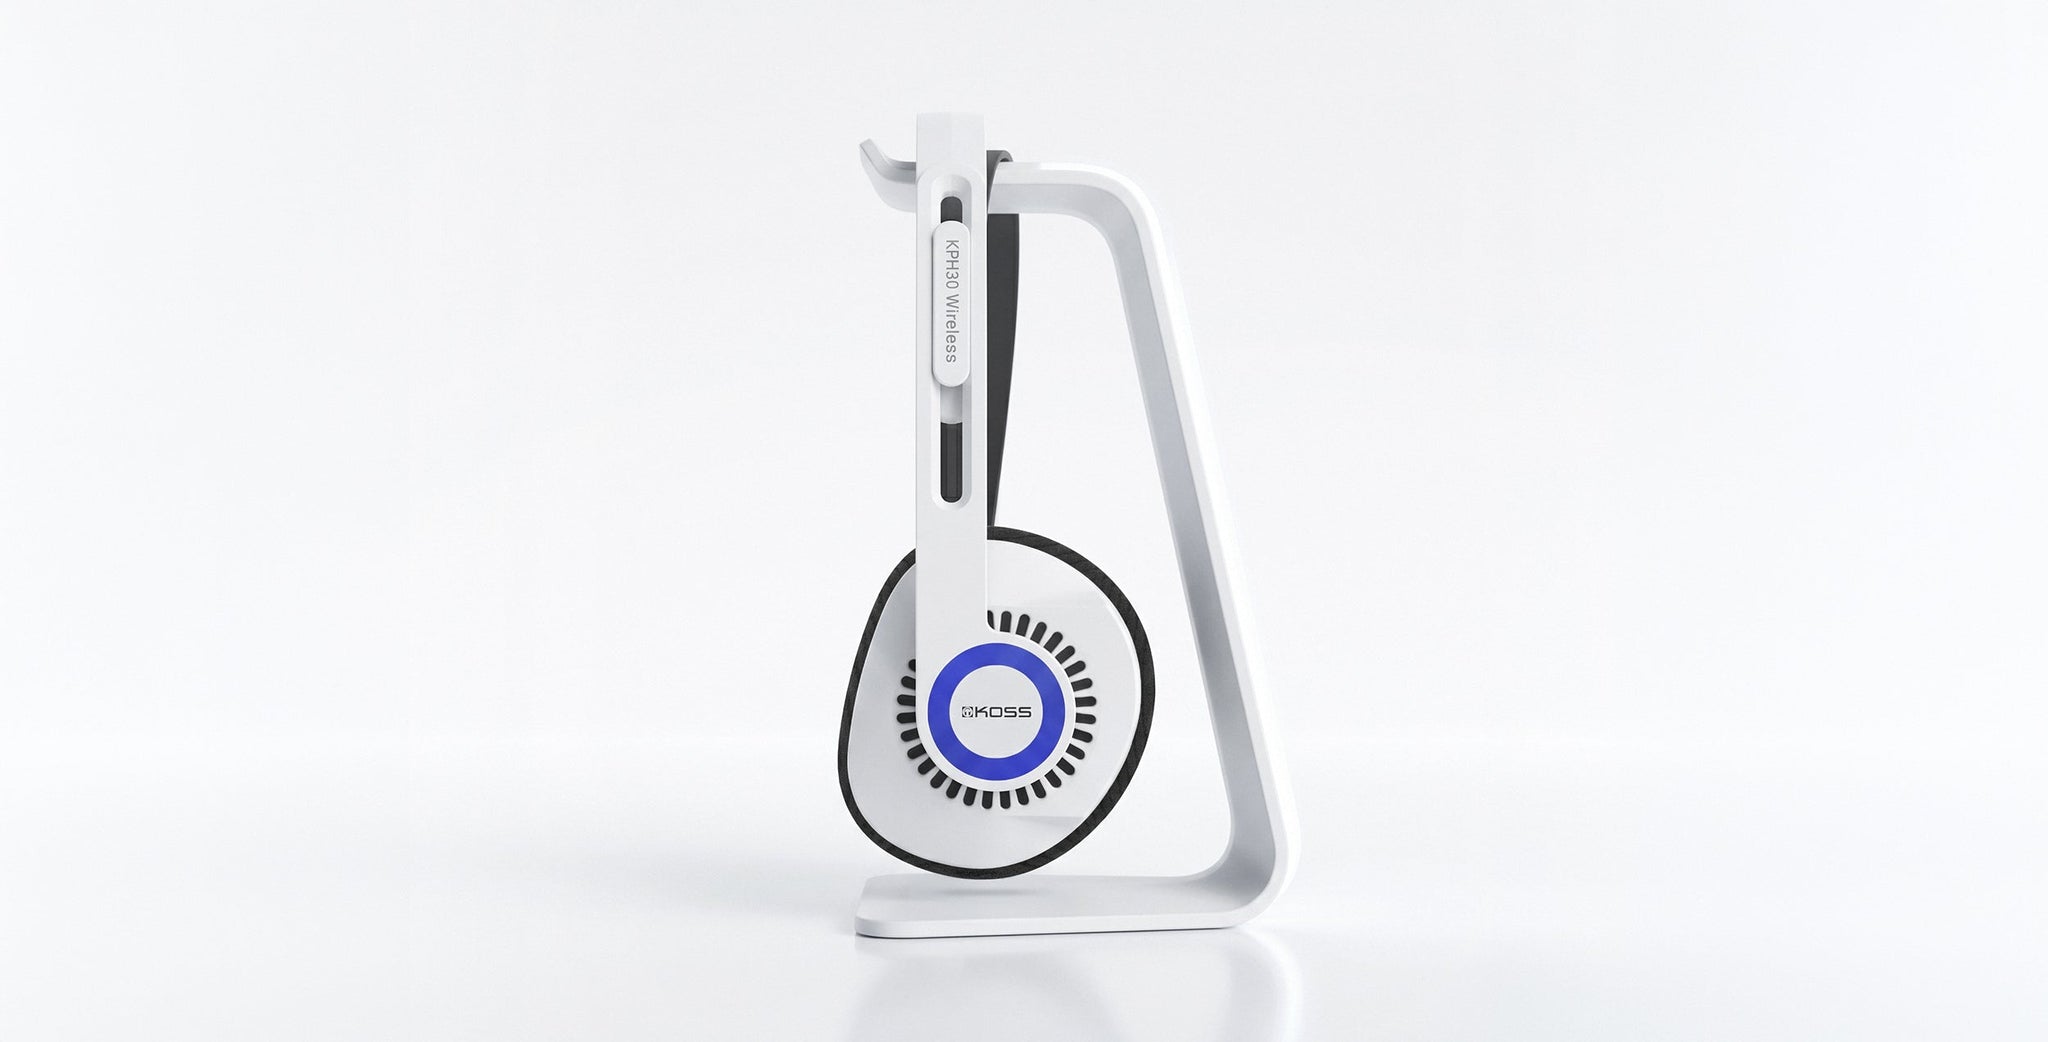
stereo headphones, personal listening accessories, bluetooth headphones, wired headphones, headsets, private label, oem, retro design, audiophile, direct-to-consumer, Koss, A/550, Pro/4AA, Porta Pro Wireless, KPH40, CL3i, SB42, CS295, KPH30, KTXPro1, SP/3, Koss Utility Series, Koss Retro Collection, Koss Audiophile Collection
Press page koss.com/blogs/news

Metrics

Valuation  
Market cap $ 38.055M
Market cap (USD) $ 38.055M
P/E -44.67
PEG —
P/BV 1.27
P/S 3.16
P/OCF -44.89
P/FCF -23.60
Dividend yield 4.5%
Turnover / mcap —
Returns  
ROE -1.3%
ROI -1.4%
ROIC -4.2%
Profit margin -3.0%
Growth  
Revenue growing Yes
Profits growing Yes
Revenue up 3y No
Revenue up 5y No
Earnings growth 3y (net profit CAGR) —
Quality  
Profitable No
Margin expanding Yes
Buying back stock No
Diluting (TTM) No
Debt/Equity —
Podcast bulls (TTM) Sign up
Podcast bears (TTM) Sign up
Podcast sentiment (TTM) Sign up
Podcast sentiment % (TTM) Sign up
News sentiment (TTM) 0
Quality score -5.6%
Insiders  
Buys, 1w Sign up
Buys, 1m Sign up
Buys, 1y Sign up
Sells, 1w Sign up
Sells, 1m Sign up
Sells, 1y Sign up

Sign up to see this company's insider trades

Figure FY 2026 FY 2025 FY 2024 FY 2023 FY 2022 FY 2021 FY 2020 FY 2019 FY 2018 FY 2017 FY 2016 FY 2015 FY 2014 FY 2013 FY 2012 FY 2011 FY 2009 FY 2008 FY 2007 FY 2006 FY 2005 FY 2004 FY 2003 FY 2002 FY 2001 FY 2000
Revenue 13.021M 12.624M 12.265M 13.1M 17.607M 19.546M 18.312M 21.842M 23.515M 24.054M 26.001M 24.23M 23.841M 35.765M 37.866M 41.518M 38.184M 46.943M 46.202M 50.892M 40.287M 40.493M 33.803M 36.571M 38.609M 34.875M
Net profit -391.464K -874.831K -950.911K 8.302M 1.268M 493.594K -465.597K 434.114K -3.386M -963.636K 1.389M 482.613K -5.554M 5.428M 2.94M 4.373M 1.977M 4.494M 5.157M 6.222M 4.494M 5.372M 4.521M 5.041M 5.688M 4.953M
Free cash flow 122.721K -705.625K -652.291K 10.637M -1.051M -251.415K 1.378M 1.223M 780.469K -169.182K -135.171K -667.203K 3.056M 2.841M 4.556M 2.924M 230.76K 4.158M 4.481M 4.905M 6.793M 3.158M 2.746M 7.138M 8.109M 7.705M

Figure FY 2026 FY 2025 FY 2024 FY 2023 FY 2022 FY 2021 FY 2020 FY 2019 FY 2018 FY 2017 FY 2016 FY 2015 FY 2014 FY 2013 FY 2012 FY 2011 FY 2009 FY 2008 FY 2007 FY 2006 FY 2005 FY 2004 FY 2003 FY 2002 FY 2001 FY 2000
Share price 4.01 5.1 4.45 3.7 6.95 23.22 1.35 2 2.34 1.83 2.02 2.31 3.2 4.97 5.2 5.5 11.25 15.26 19.73 25.18 — — — — — —
Price performance 12m -0.21 0.15 0.2 -0.47 -0.7 16.14 -0.32 -0.15 0.28 -0.09 -0.12 -0.28 -0.36 -0.04 -0.05 -0.53 -0.26 -0.23 -0.22 — — — — — — —

Filed figures

Figure Jun 2017 Jun 2018 Jun 2019 Jun 2020 Jun 2021 Jun 2022 Jun 2023 Jun 2024 Jun 2025 Jun 2026
Balance sheet detail
Trade receivables (USD) 3.93M 4.71M 3.66M 2.32M 2.24M 1.85M 1.38M 1.21M 1.14M 1.22M
↳ YoY growth +11.3% +19.8% -22.4% -36.6% -3.3% -17.6% -25.3% -12.4% -6.0% +7.6%
↳ 5y CAGR -5.9% -17.3% +2.9% -3.9% -8.7% -14.0% -21.8% -19.9% -13.3% -11.4%
Borrowings, current (USD) — — — 506,700 — — — — — —
Lease liabilities (USD) — 3.1M 2.85M 2.58M 2.31M 3.25M 3.02M 2.78M 2.54M 2.31M
Cash and deposits (USD) 432,283 1.08M 2.23M 4M 6.95M 9.21M 3.09M 2.84M 2.81M 3.02M
Right-of-use assets (USD) — 3.1M 2.85M 2.58M 2.31M 3.25M 3.02M 2.77M 2.52M 2.26M
Net debt (borrowings + leases - cash) (USD) — — — -910,307 — — — — — —
Cash flow detail
Operating cash flow (USD) 234,252 1.03M 1.41M 1.8M 348,740 -942,530 10.7M -190,531 -214,908 439,207
Purchases of property, plant and equipment (USD) -403,434 -250,618 -187,756 -424,159 -600,155 -108,158 -98,441 -461,760 -490,717 -316,486
Change in receivables (cash effect) (USD) -398,815 -773,330 1.03M 1.28M 85,505 429,470 463,103 175,303 72,526 -86,088
Change in inventories (cash effect) (USD) 250,142 2.21M -712,769 1.31M -362,718 -2.73M 2.21M 1.95M -411,387 292,977
Change in payables (cash effect) (USD) 276,454 -813,619 6,882 -608,668 -429,272 397,730 -528,650 62,316 489,501 -525,673
Interest paid (cash effect) (USD) -964 -5,218 — — — — — — — —
Income taxes paid (cash effect) (USD) 523,342 -3,182 -1,620 — — — -320,073 67,410 -4,847 8,923
Share-based compensation (USD) — 331,560 387,556 549,594 619,137 463,633 289,676 155,834 31,782 24,933
Operating cash flow before change in receivables (USD) 633,067 1.8M 379,885 520,009 263,235 -1.37M 10.3M -365,834 -287,434 525,295
Free cash flow (OCF - PPE - intangibles) (USD) -169,182 780,469 1.22M 1.38M -251,415 -1.05M 10.6M -652,291 -705,625 122,721
Income detail
Research and development expense (USD) 213,653 427,009 — 397,360 410,602 285,244 288,231 238,086 213,870 229,736
↳ 5y CAGR -30.4% -21.5% +35.1% +6.0% -7.6% -11.7% -11.0%
Total comprehensive income (USD) — — — — — — — — -874,831 -496,413
Comprehensive income to owners (USD) — — — — — — — — -874,831 -496,413
Provision for credit losses (USD) -1,872 -4,874 23,422 56,386 -9,226 -35,305 4,000 -4,105 121 0.00
Credit cost ratio (credit losses / average receivables) (%) 0.1% 0.1% 0.6% 1.9% 0.4% 1.7% 0.2% 0.3% 0.0% 0.0%
Reported Aug 25, 2017 Aug 30, 2019 Aug 30, 2019 Aug 20, 2021 Aug 20, 2021 Aug 26, 2022 Aug 25, 2023 Aug 30, 2024 Aug 28, 2026 Aug 28, 2026

Sign up to see institutional holdings

Sign Up

Podcast Mentions

Sign up to see podcast mentions and sentiment

Sign Up

Koss Corporation Reports First Quarter Results Bull 0 Bear 3 Results

MILWAUKEE, Oct. 29, 2026 (GLOBE NEWSWIRE) -- Koss Corporation (NASDAQ: KOSS) (the “Company”), the U.S. based high-fidelity headphone company, has reported its results for the first quarter ended September 30, 2026.

Net sales for the first quarter ended September 30, 2026 were $3,094,078, a decline of $976,700, or 24.0%, compared to net sales of $4,070,778 for the three months ended September 30, 2025. A net loss of $234,168 was generated for the three months ended September 30, 2026 compared to net income of $243,729 for the same period in the prior year. Basic and diluted net loss per common share for the first quarter of fiscal year 2027 was $0.02 compared to basic and diluted net income per common share of $0.03 for the same three-month period one year ago.

“Sales to certain domestic distributors were strong in the first quarter of fiscal year 2027 compared with the prior-year period. However, the significant custom order that shipped in the first quarter of last year for an Education customer’s new product launch did not recur this year. European distributor sales for the three months ended September 30, 2026 were on par to those for the same period in the prior year, supported by necessary inventory replenishment orders,” Michael J. Koss, Chairman and CEO, said today. “Direct-to-consumer (DTC) sales continue to positively impact sales growth and now represent approximately 37% of the Company’s total turnover.”

Koss continued, “The Company’s gross margin declined 50 basis points to 39.5% in the first quarter of fiscal 2027, compared with 40.0% a year earlier. The benefit to gross margins of a favorable customer mix of higher margin DTC and domestic distributor sales, along with the recognition of a final tariff refund of $76,000 for previously paid import duties on product from China, were negated by the impact of fixed manufacturing overhead absorption on a lower sales base, coupled with higher freight rates due to general rate increases and peak season surcharges.”

“We remain encouraged by the strength of our domestic distributor business and the growing contribution of DTC sales, which position the Company to build on these positive trends as the fiscal year progresses,” Koss concluded.

About Koss Corporation

Koss Corporation markets a complete line of high-fidelity headphones, wireless Bluetooth® speakers, computer headsets, telecommunications headsets, active noise canceling headphones, and wireless headphones. Learn more at koss.com and kosscorporation.com.

Forward-Looking Statements

This press release contains forward-looking statements. These statements relate to future events or our future financial performance. In some cases, you can identify forward-looking statements by terminology such as "anticipates," "believes," "estimates," "expects," "intends," "plans," "may," "will," "should," “could,” “would,” “shall,” "forecasts," "predicts," "potential," "continue," “seeks,” “goal,” “projects” or the negative of such terms and other comparable terminology. These statements are based on currently available operating, financial and competitive information and are subject to various risks and uncertainties. Actual events or results may differ materially. In evaluating forward-looking statements, you should specifically consider various factors that may cause actual results to vary from those contained in the forward-looking statements, such as continued future fluctuations in economic conditions; the Company’s ability to successfully develop new products and assess potential market opportunities; the receptivity of consumers to new consumer electronics technologies; the Company’s ability to successfully and profitably market its products; the rate and consumer acceptance of new product introductions; the amount and nature of competition for the Company’s products; pricing; the number and nature of customers and their product orders; the Company’s ability to meet demand for products; production by third party vendors; foreign manufacturing, sourcing, and sales (including foreign government regulation, trade and importation concerns); uncertainties associated with the pandemics and other health crises or natural disasters, including their possible effects on the Company’s operations and its supply chain; changes in trade policies and tariffs, import and export restrictions; the impact of the ongoing conflict in Eastern Europe and the instability and escalation in the Middle East on the Company’s operations; the effects of any judicial, executive or legislative action affecting the Company or the audio/video industry; borrowing costs; changes in tax rates; volatility in the price and trading volume of our common stock; the outcome of any litigation, government investigations, enforcement actions or other legal proceedings; any impacts of future acquisitions or other strategic transactions; the possibility that costs or difficulties related to the integration of acquired businesses’ operations will be greater than expected and the possibility that integration efforts will disrupt our business and strain management time and resources; the Company’s ability to retain and hire key personnel and other risk factors described in the Risk Factors and Management’s Discussion and Analysis of Financial Condition and Results of Operations sections in the Company’s Annual Report on Form 10-K for the fiscal year ended June 30, 2026. Shareholders, potential investors and other readers are urged to consider these factors carefully in evaluating the forward-looking statements and are cautioned not to place undue reliance on such forward-looking statements. The forward-looking statements made herein are only made as of the date of this press release and the Company undertakes no obligation to publicly update such forward-looking statements to reflect subsequent events or circumstances or new information. In addition, such uncertainties and other operational matters are discussed further in the Company's quarterly and annual filings with the Securities and Exchange Commission.

| KOSS CORPORATION CONDENSED CONSOLIDATED STATEMENTS OF OPERATIONS (Unaudited) |

| | | | | | |

| | Three Months Ended |

| | September 30 |

| | 2026 | | 2025 |

| Net sales | $ | 3,094,078 | | | $ | 4,070,778 | |

| Cost of goods sold | | 1,872,243 | | | | 2,442,086 | |

| Gross profit | | 1,221,835 | | | | 1,628,692 | |

| | | | | | |

| Selling, general and administrative expenses | | 1,622,430 | | | | 1,674,732 | |

| | | | | | |

| Loss from operations | | (400,595 | ) | | | (46,040 | ) |

| | | | | | |

| Other income (expense): | | | | | |

| Interest income | | 169,070 | | | | 293,128 | |

| Interest expense | | (409 | ) | | | (599 | ) |

| Total other income, net | | 168,661 | | | | 292,529 | |

| | | | | | |

| (Loss) income before income tax provision | | (231,934 | ) | | | 246,489 | |

| | | | | | |

| Income tax provision | | 2,234 | | | | 2,760 | |

| | | | | | |

| Net (loss) income | $ | (234,168 | ) | | $ | 243,729 | |

| | | | | | |

| (Loss) income per common share: | | | | | |

| Basic | $ | (0.02 | ) | | $ | 0.03 | |

| Diluted | $ | (0.02 | ) | | $ | 0.03 | |

| | | | | | |

| Weighted-average number of shares: | | | | | |

| Basic | | 9,466,438 | | | | 9,456,438 | |

| Diluted | | 9,466,438 | | | | 9,537,817 | |

| | |

| CONTACT: | Michael J. Koss |

| | Chairman & CEO |

| | (414) 964-5000 |

| | [email protected] |

| | |

Primary Logo

Source: Koss Corporation

© 2026 Koss Corporation. All Rights Reserved.

On October 14, 2026, the Koss Corporation (the “Company”) held its annual meeting of stockholders (the “Annual Meeting”).

At the Annual Meeting, the Company’s stockholders elected Thomas L. Doerr, Michael J. Koss, William J. Sweasy, Lenore E. Lillie and Michael J. Koss, Jr. to serve as directors. The Company’s stockholders approved, on a non-binding advisory basis, the compensation paid to the Company’s Named Executive Officers as disclosed in the proxy statement for the Annual Meeting as filed with the Securities and Exchange Commission on August 28, 2026 (the “Proxy Statement”). In addition, the Company’s stockholders ratified the appointment of Wipfli LLP as the Company’s independent registered public accounting firm for the fiscal year ending June 30, 2027.

The following tables show the voting results of the Annual Meeting:

1. Election of directors.

Director

Votes For

Votes Withheld

Broker Non-Votes

Thomas L. Doerr

4,918,959

82,634

1,811,225

Michael J. Koss

4,903,877

97,716

1,811,225

William J. Sweasy

4,935,060

66,533

1,811,225

Lenore E. Lillie

4,785,174

126,419

1,811,225

Michael J. Koss, Jr.

4,877,736

123,857

1,811,225

2.

MILWAUKEE, Aug. 27, 2026 (GLOBE NEWSWIRE) -- Koss Corporation (NASDAQ: KOSS) (the “Company”), the U.S. based high-fidelity headphone company, has reported its results for the fourth quarter and fiscal year ended June 30, 2026.

For the three months ended June 30, 2026, net sales of $3,263,853 reflected an increase of $179,643, or 5.8%, over net sales of $3,084,210 for the same period in fiscal year 2025. The net income for the fourth quarter of fiscal year 2026 was $476,801 compared to a net loss of $232,696 for the fourth quarter of the prior fiscal year, an increase of $709,497. Basic and diluted net income per common share for the quarter ended June 30, 2026 were $0.05, compared to basic and diluted net loss of $0.02 for the same fiscal quarter in the prior year.

“Direct-to-consumer (DTC) sales were the biggest contributor to growth for the three months ended June 30, 2026, with an increase of 36.2% over the prior year’s same fiscal quarter, led by strong performances in the Porta Pro wired and wireless headphones family. Koss.com sales showed a remarkable 45.6% increase over the same period in the prior fiscal year,” Michael J. Koss, Chairman and CEO, said in a statement today. “Sales to certain domestic distributors remained strong in the fourth quarter, increasing approximately 12% year over year, however, our European markets continue to show year over year declines as those distributors slow down stock replenishments and maintain lower stock levels.”

For the year ended June 30, 2026, sales of $13,020,773 were up $396,603, or 3.1%, over prior year sales of $12,624,170, with the primary driver being a custom headphones sale to a customer in the Education market segment. DTC sales and sales to several domestic distributors also showed substantial increases for the full fiscal year compared to the prior year. Net loss for the full fiscal year 2026 of $391,464 declined $483,367 compared to a net loss of $874,831 for fiscal year 2025. Both basic and diluted net loss per common share for the years ended June 30, 2026 and 2025 were $0.04 and $0.09, respectively.

“Full fiscal year sales growth was primarily driven by the custom headphones sale to the Education market, along with strong DTC sales supported by online marketing and social media campaigns, and continued strength in a segment of our domestic distributor business as inventory levels were replenished to adequate levels,” Koss continued. “Tariff refunds of $1.0 million received in the fourth quarter of fiscal year 2026 for previously paid import duties imposed on products from China helped to offset the adverse impact of tariffs paid during the year, resulting in gross margin improvement from 37.8% for the fiscal year ended June 30, 2025 to 41.9% for the 2026 fiscal year. The favorable customer mix, which included higher volumes of higher margin DTC and domestic distributor sales, also helped fuel the increase in margins. The Company’s previously announced ‘diversification by acquisition’ strategy is intended to reshape its profile over the next five years by creating additional predictable, recurring revenue streams for the company.”

About Koss Corporation

Koss Corporation markets a complete line of high-fidelity headphones, wireless Bluetooth® speakers, computer headsets, telecommunications headsets, active noise canceling headphones, and wireless headphones.

Forward-Looking Statements

This press release contains forward-looking statements. These statements relate to future events or our future financial performance. In some cases, you can identify forward-looking statements by terminology such as "anticipates," "believes," "estimates," "expects," "intends," "plans," "may," "will," "should," “could,” “would,” “shall,” "forecasts," "predicts," "potential," "continue," “seeks,” “goal,” “projects” or the negative of such terms and other comparable terminology. These statements are based on currently available operating, financial and competitive information and are subject to various risks and uncertainties. Actual events or results may differ materially. In evaluating forward-looking statements, you should specifically consider various factors that may cause actual results to vary from those contained in the forward-looking statements, such as continued future fluctuations in economic conditions; the Company’s ability to successfully develop new products and assess potential market opportunities; the receptivity of consumers to new consumer electronics technologies; the Company’s ability to successfully and profitably market its products; the rate and consumer acceptance of new product introductions; the amount and nature of competition for the Company’s products; pricing; the number and nature of customers and their product orders; the Company’s ability to meet demand for products; production by third party vendors; foreign manufacturing, sourcing, and sales (including foreign government regulation, trade and importation concerns); uncertainties associated with the pandemics and other health crises or natural disasters, including their possible effects on the Company’s operations and its supply chain; changes in trade policies and tariffs, import and export restrictions; the impact of the ongoing conflict in Eastern Europe and the instability in the Middle East on the Company’s operations; the effects of any judicial, executive or legislative action affecting the Company or the audio/video industry; borrowing costs; changes in tax rates; volatility in the price and trading volume of our common stock; the outcome of any litigation, government investigations, enforcement actions or other legal proceedings; any impacts of future acquisitions or other strategic transactions; the possibility that costs or difficulties related to the integration of acquired businesses’ operations will be greater than expected and the possibility that integration efforts will disrupt our business and strain management time and resources; the Company’s ability to retain and hire key personnel and other risk factors described in the Risk Factors and Management’s Discussion and Analysis of Financial Condition and Results of Operations sections in the Company’s Annual Report on Form 10-K for the fiscal year ended June 30, 2026. Shareholders, potential investors and other readers are urged to consider these factors carefully in evaluating the forward-looking statements and are cautioned not to place undue reliance on such forward-looking statements. The forward-looking statements made herein are only made as of the date of this press release and the Company undertakes no obligation to publicly update such forward-looking statements to reflect subsequent events or circumstances or new information. In addition, such uncertainties and other operational matters are discussed further in the Company's quarterly and annual filings with the Securities and Exchange Commission.

| KOSS CORPORATION |

| CONDENSED CONSOLIDATED STATEMENTS OF OPERATIONS |

| (Unaudited) |

| | | | | | | | | | | | |

| | Three Months Ended | | Twelve Months Ended |

| | June 30, | | June 30, |

| | 2026 | | | 2025 | | | 2026 | | | 2025 | |

| Net sales | $ | 3,263,853 | | | $ | 3,084,210 | | | $ | 13,020,773 | | | $ | 12,624,170 | |

| Cost of goods sold | | 1,273,701 | | | | 1,973,166 | | | | 7,568,362 | | | | 7,850,572 | |

| Gross profit | | 1,990,152 | | | | 1,111,044 | | | | 5,452,411 | | | | 4,773,598 | |

| | | | | | | | | | | | |

| Selling, general and administrative expenses | | 1,722,854 | | | | 1,550,243 | | | | 6,964,862 | | | | 6,510,721 | |

| | | | | | | | | | | | |

| Income (loss) from operations | | 267,298 | | | | (439,199 | ) | | | (1,512,451 | ) | | | (1,737,123 | ) |

| | | | | | | | | | | | |

| Interest income | | 213,508 | | | | 212,555 | | | | 883,995 | | | | 879,774 | |

| Other income | | - | | | | - | | | | 250,000 | | | | - | |

| Interest expense | | (458 | ) | | | - | | | | (2,116 | ) | | | - | |

| Total other income, net | | 213,050 | | | | 212,555 | | | | 1,131,879 | | | | 879,774 | |

| | | | | | | | | | | | |

| Income (loss) before income tax provision | | 480,348 | | | | (226,644 | ) | | | (380,572 | ) | | | (857,349 | ) |

| | | | | | | | | | | | |

| Income tax provision | | 3,547 | | | | 6,052 | | | | 10,892 | | | | 17,482 | |

| | | | | | | | | | | | |

| Net income (loss) | $ | 476,801 | | | $ | (232,696 | ) | | $ | (391,464 | ) | | $ | (874,831 | ) |

| | | | | | | | | | | | |

| Income (loss) per common share: | | | | | | | | | | | |

| Basic | $ | 0.05 | | | $ | (0.02 | ) | | $ | (0.04 | ) | | $ | (0.09 | ) |

| Diluted | $ | 0.05 | | | $ | (0.02 | ) | | $ | (0.04 | ) | | $ | (0.09 | ) |

| | | | | | | | | | | | |

| Weighted-average number of shares: | | | | | | | | | | | |

| Basic | | 9,466,438 | | | | 9,390,855 | | | | 9,462,904 | | | | 9,363,117 | |

| Diluted | | 9,466,438 | | | | 9,390,855 | | | | 9,462,904 | | | | 9,363,117 | |

| CONTACT: | Michael J. Koss |

| | Chairman & CEO |

| | (414) 964-5000 |

| | [email protected] |

Primary Logo

Source: Koss Corporation

© 2026 Koss Corporation. All Rights Reserved.
Prompts

Koss Corporation (ticker KOSS), listed in United States.

ETFs Holding Koss Corporation

ETF Weight in ETF Shares Market value As of
DXUV 0.00% 2,822 $ 9,171.50 Nov 12, 2026
DCOR 0.00% 3,913 $ 12.717K Nov 12, 2026
DFAC 0.00% 4,813 $ 15.642K Nov 12, 2026
BSVO 0.00% 6,323 $ 20K Nov 18, 2026