July 14, 2026 PDF Version KIRKLAND, Wash., July 14, 2026 (GLOBE NEWSWIRE) -- Kestra Medical Technologies, Ltd. (Nasdaq: KMTS), a leading wearable medical device and digital healthcare company, today reported financial results for the fourth quarter…
July 14, 2026
PDF Version
KIRKLAND, Wash., July 14, 2026 (GLOBE NEWSWIRE) -- Kestra Medical Technologies, Ltd. (Nasdaq: KMTS), a leading wearable medical device and digital healthcare company, today reported financial results for the fourth quarter and fiscal year ended April 30, 2026.
Financial Highlights
-
Fiscal 4Q26 revenue of $28.6 million, an increase of 66% compared to the prior year period.
-
FY26 revenue of $95.1 million, an increase of 59% compared to FY25.
-
Fiscal 4Q26 gross margin of 54.8% compared to 44.3% in the prior year period.
-
FY26 gross margin of 51.4% compared to 40.5% in FY25.
-
FY27 revenue guidance of $137 million, an increase of 44% compared to fiscal year 2026.
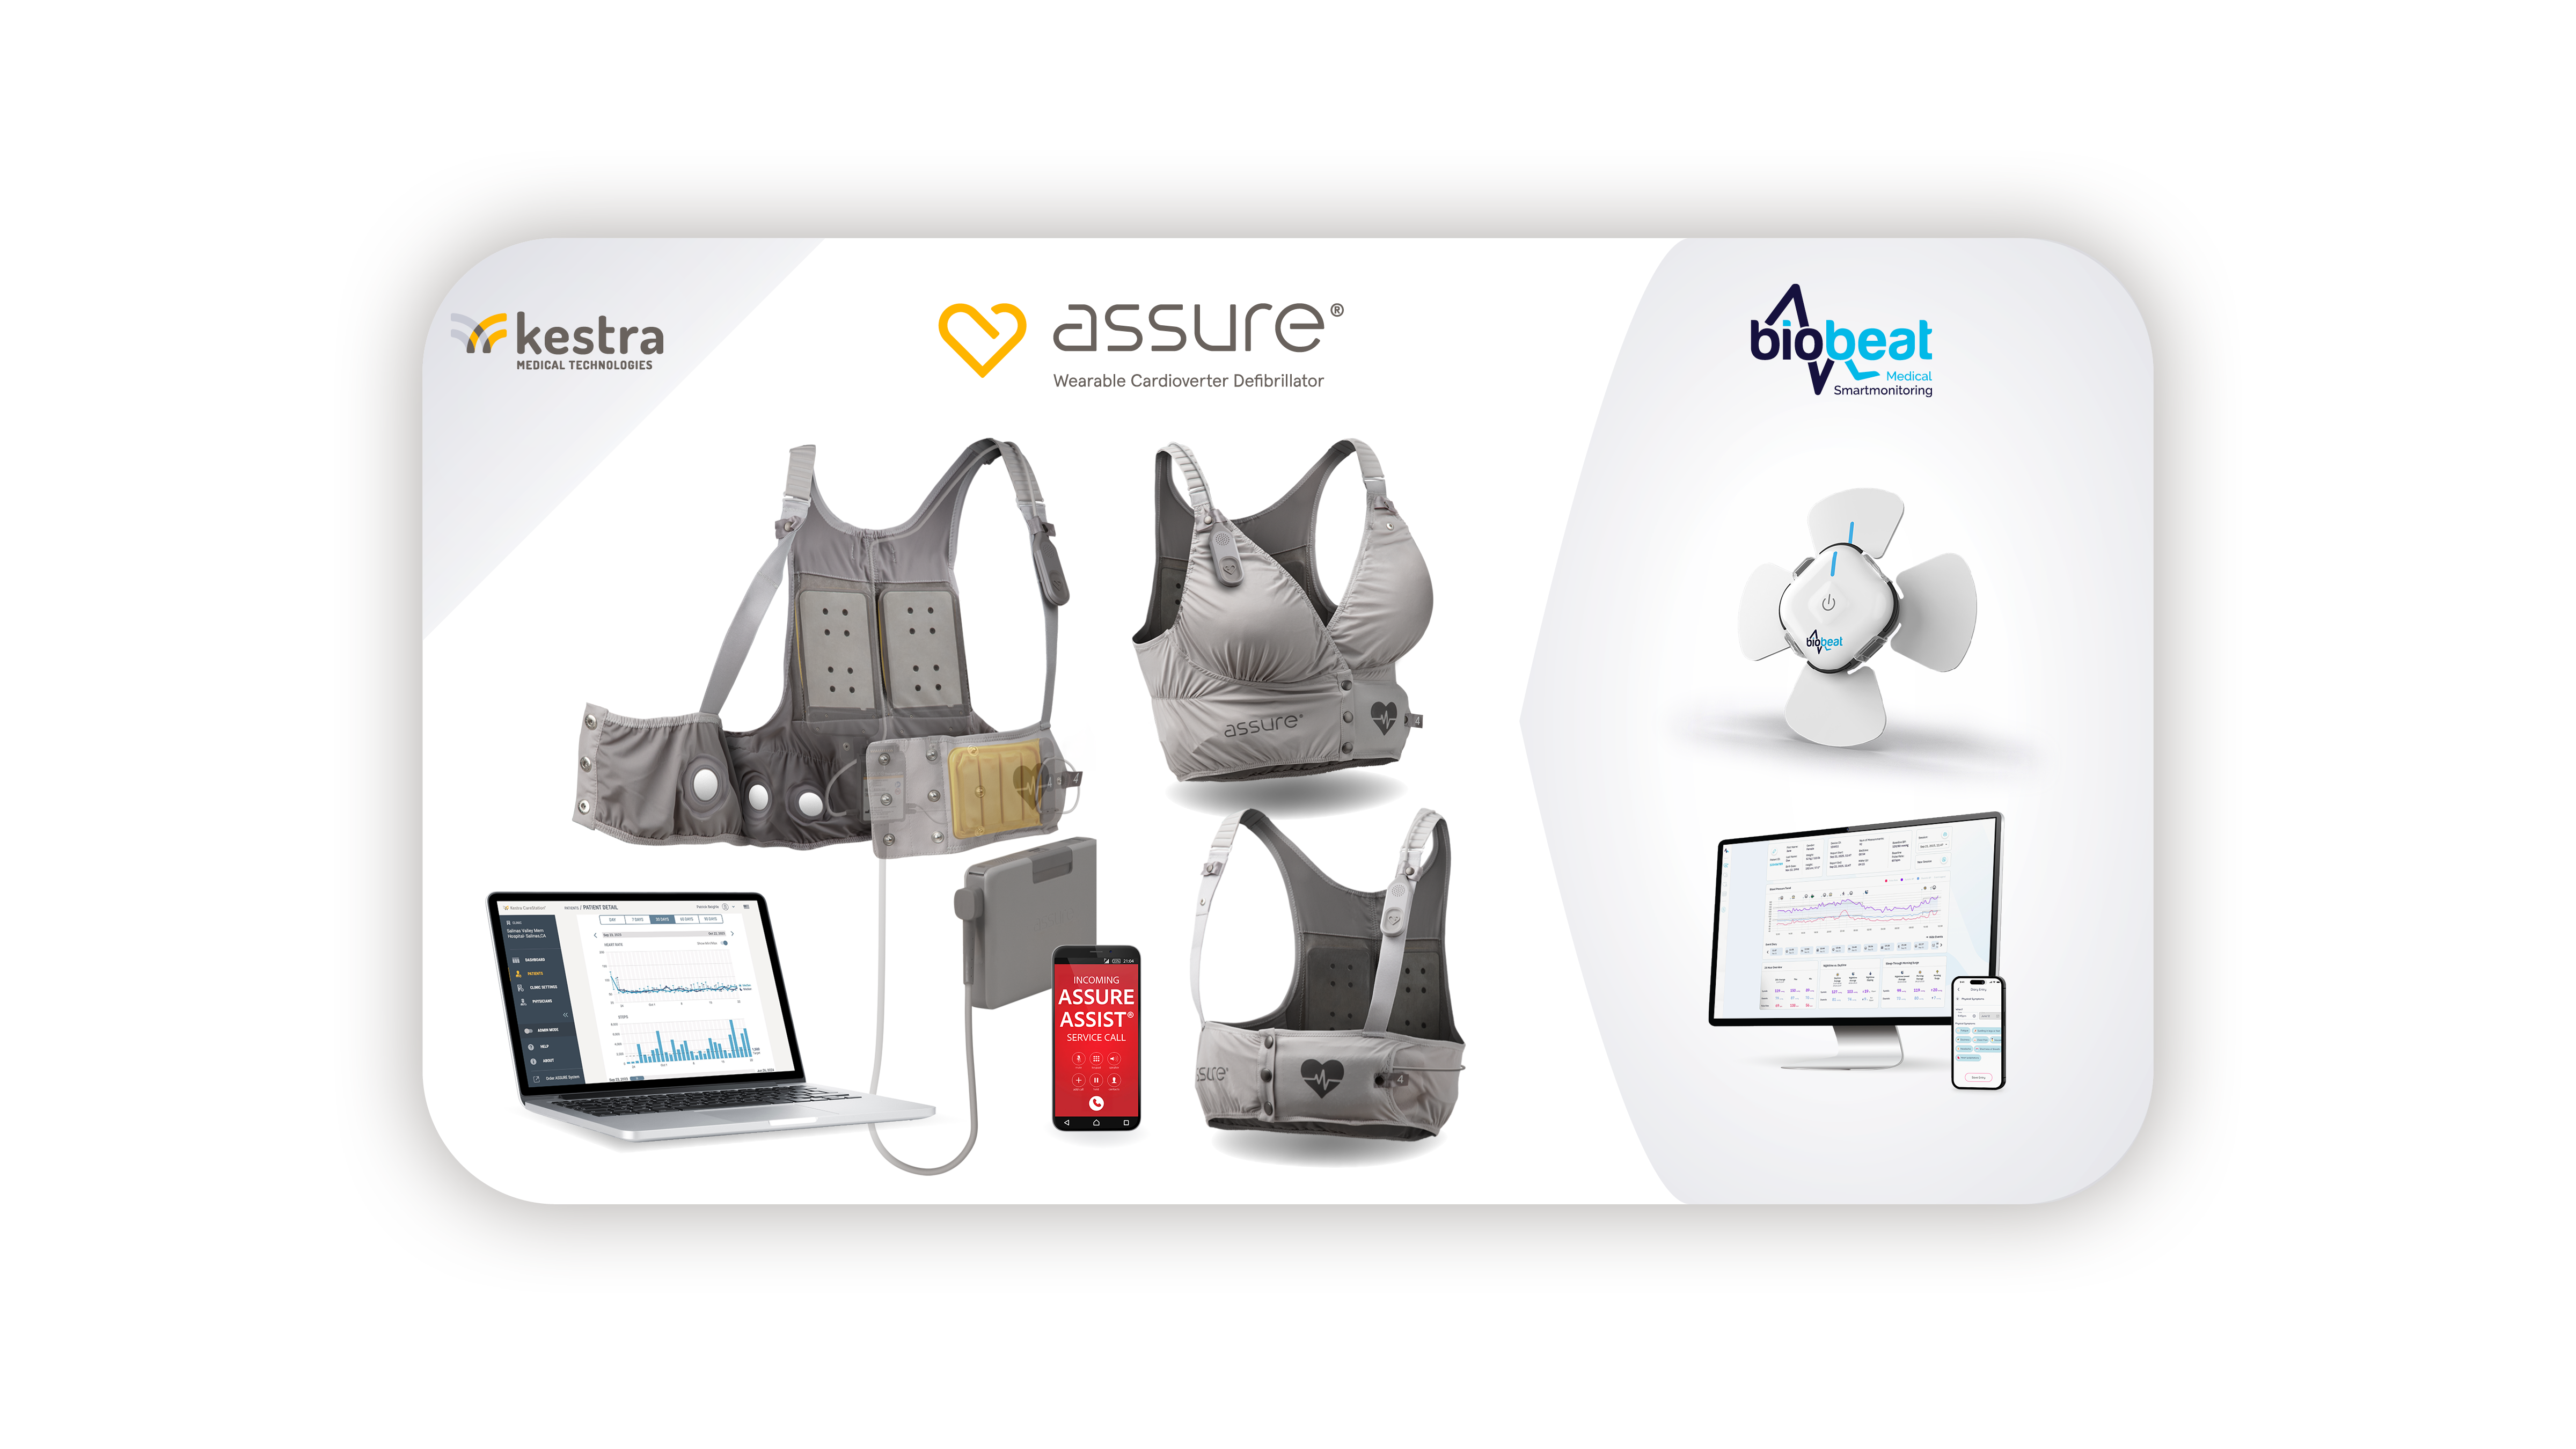
“Kestra concluded fiscal year 2026 with another strong quarter of financial performance, generating revenue growth of 66% while expanding gross margin to 55%,” said Brian Webster, President and CEO. “In fiscal year 2026, the ASSURE® system protected 18,000 patients from sudden cardiac arrest, a testament to the dedication of our mission-driven team. We also made significant progress on key operational objectives, including rapid growth of our commercial organization, release of compelling primary results from our FDA post-approval study, launch of our latest algorithm update, fortification of our balance sheet, and entrance into a strategic collaboration with Biobeat Technologies. We remain confident that our focus on innovation and executing on our commitments to prescribers and their patients will continue to drive market expansion and advance Kestra on its path to market leadership.”
Fourth Quarter Fiscal 2026 Financial Results
-
Total revenue was $28.6 million, an increase of 66% compared to the prior year period.
-
6,357 prescriptions were written for the ASSURE® system, an increase of 63% compared to the prior year period.
-
Revenue growth was driven primarily by higher market share and wearable cardioverter defibrillator (WCD) market expansion. Revenue also benefited from a higher mix of in-network patients and improvements in revenue cycle management capabilities.
-
Gross profit was $15.7 million compared to $7.6 million in the prior year period.
-
Gross margin expanded to 54.8% compared to 44.3% in the prior year period, driven by volume leverage, a higher mix of in-network patients and execution of planned cost improvement programs.
-
GAAP operating expenses were $55.0 million compared to $55.8 million in the prior year period.
-
Excluding non-recurring costs and share-based compensation expense, adjusted operating expenses* were $44.7 million compared to $29.7 million in the prior year period. The increase was primarily attributable to growth in expenses related to the company’s accelerated commercial expansion.
-
GAAP net loss was $38.8 million compared to GAAP net loss of $51.1 million in the prior year period.
-
Adjusted EBITDA* loss was $26.7 million compared to an adjusted EBITDA loss of $20.3 million in the prior year period.
-
Cash and cash equivalents, and investments totaled $262.2 million as of April 30, 2026.
-
Net cash used in operating activities was $18.7 million, a reduction from $24.1 million in the prior year period.
Fiscal Year 2026 Financial Results
-
Total revenue was $95.1 million, an increase of 59% compared to FY25.
-
20,720 prescriptions were written for the ASSURE® system, an increase of 57% compared to FY25.
-
Gross profit was $48.9 million compared to $24.2 million in FY25.
-
Gross margin expanded to 51.4% compared to 40.5% in FY25.
-
GAAP operating expenses were $183.6 million compared to $130.6 million in FY25.
-
Excluding non-recurring costs and share-based compensation expense, adjusted operating expenses* were $144.6 million compared to $100.6 million in FY25.
-
GAAP net loss was $131.6 million compared to GAAP net loss of $113.8 million in FY25.
-
Adjusted EBITDA* loss was $87.0 million compared to an adjusted EBITDA loss of $68.4 million in FY25.
*Adjusted operating expenses and adjusted EBITDA are non-GAAP financial measures. See “Use of Non-GAAP Financial Measures” below for additional information. Reconciliations of adjusted operating expenses and adjusted EBITDA to the most directly comparable GAAP measure are included in this press release.
Fiscal Year 2027 Revenue Guidance
Kestra expects revenue of $137 million in FY27, which would represent growth of 44% compared to FY26.
Webcast and Conference Call
Kestra will host a conference call today at 4:30 p.m. Eastern Time to discuss financial results. A live and archived webcast of the event will be available in the “Events” section of the investor relations website.
About Kestra
Kestra Medical Technologies, Ltd. is a leading wearable medical device and digital healthcare company focused on transforming patient outcomes in cardiovascular disease using monitoring and therapeutic intervention technologies that are intuitive, intelligent, and connected. For more information, visit www.kestramedical.com.
Use of Non-GAAP Financial Measures
This press release contains certain financial information that is not presented in conformity with U.S. generally accepted accounting principles (“GAAP”), including adjusted operating expense and adjusted EBITDA. The non-GAAP financial measures are provided as supplemental information to Kestra’s financial measures presented in this press release that are calculated and presented in accordance with GAAP.
Adjusted operating expense is calculated as operating expenses, as adjusted to exclude share-based compensation expense and non-recurring expenses. Adjusted EBITDA is calculated as net income (loss), as adjusted to exclude other income/expense (including interest), income tax expense (benefit), depreciation and amortization expense, share-based compensation expense, and non-recurring expenses. Both metrics are presented because management believes they will allow investors to view Kestra’s performance in a manner similar to the method used by management to evaluate Kestra’s performance for both strategic and annual operating planning. Management believes that in order to properly understand short-term and long-term financial trends, it is helpful for investors to understand the impact of the items excluded from the calculation of adjusted operating expenses and adjusted EBITDA, in addition to considering Kestra’s GAAP financial measures. The excluded items vary in frequency and/or impact on our results of operations and management believes that the excluded items are not reflective of our ongoing core business operations and financial condition. Excluding such items allows investors and analysts to compare our operating performance to other companies in our industry and to compare our period-over-period results.
The non-GAAP financial measures used by Kestra may not be the same or calculated in the same manner as those used and calculated by other companies. Non-GAAP financial measures have limitations as analytical tools and should not be considered in isolation or as a substitute for Kestra’s financial results prepared and reported in accordance with GAAP. We urge investors to review the reconciliation of these non-GAAP financial measures to the comparable GAAP financial measures included in this press release, and not to rely on any single financial measure to evaluate our business. A reconciliation of adjusted operating expenses and adjusted EBITDA reported in this press release to the most comparable respective GAAP measure for the respective periods appears in the tables captioned “Reconciliation of GAAP Operating Expenses to Adjusted Operating Expenses” and “Reconciliation of GAAP Net Income (Loss) to Adjusted EBITDA” later in this release. Within the accompanying financial tables presented, certain columns and rows may not add due to the use of rounded numbers.
Forward-Looking Statements
Except where otherwise noted, the information contained in this press release is as of July 14, 2026. Statements in this press release and on the related teleconference that express a belief, expectation or intention, as well as those that are not historical fact, are forward-looking statements. Except as required by law, Kestra undertakes no obligation to publicly update any forward-looking statements, whether as a result of new information, future events or otherwise. This press release contains forward-looking statements within the meaning of the Private Securities Litigation Reform Act of 1995, including statements about, among other topics, our anticipated operating and financial performance, including financial guidance and projections; business plans, strategy, goals and prospects; and expectations for our products. Given their forward-looking nature, these statements involve substantial risks, uncertainties and potentially inaccurate assumptions, and we cannot ensure that any outcome expressed in these forward-looking statements will be realized in whole or in part. You can identify these statements by the fact that they use future dates or use words such as “will,” “may,” “could,” “likely,” “ongoing,” “continue,” “anticipate,” “estimate,” “expect,” “project,” “intend,” “plan,” “advance,” “remain,” “believe,” “assume,” “target,” “forecast,” “guidance,” “goal,” “objective,” “aim,” “seek,” “potential,” “hope” and other words and terms of similar meaning. Kestra’s financial guidance is based on estimates and assumptions that are subject to significant uncertainties. Among the factors that could cause actual results to differ materially from past results and future plans and projected future results are the following: risks related to our limited operating history and history of net losses; our ability to successfully achieve substantial market adoption of our products; competitive pressures; our ability to adapt our manufacturing and production capacities to evolving patterns of demand, governmental actions and customer trends; product defects or complaints and related liability; our ability to obtain and maintain adequate coverage and reimbursement levels for our products; our ability to comply with changing laws and regulatory requirements and resulting costs; our dependence on a limited number of suppliers; risks and uncertainties related to market conditions; and other risks and uncertainties, including those described under the heading “Risk Factors” in our Annual Report on Form 10-K for the fiscal year ended April 30, 2026 and other filings filed or to be filed with the U.S. Securities and Exchange Commission (“SEC”). These filings, when made, are available on the Investor Relations section of our website at https://investors.kestramedical.com/ and on the SEC’s website at https://sec.gov/.
| KESTRA MEDICAL TECHNOLOGIES, LTD. AND SUBSIDIARIES CONSOLIDATED STATEMENTS OF OPERATIONS AND COMPREHENSIVE LOSS (in thousands, except share and per share amounts) (unaudited) |
| |
| | | Three Months Ended April 30, | | | Year Ended April 30, | |
| | | 2026 | | | 2025 | | | 2026 | | | 2025 | |
| | | | | | | | | | | | | |
| Revenue | | $ | 28,638 | | | $ | 17,233 | | | $ | 95,126 | | | $ | 59,815 | |
| Cost of revenue | | | 12,956 | | | | 9,600 | | | | 46,263 | | | | 35,605 | |
| Gross profit | | | 15,682 | | | | 7,633 | | | | 48,863 | | | | 24,210 | |
| Operating expenses: | | | | | | | | | | | | |
| Research and development | | | 5,634 | | | | 5,386 | | | | 19,484 | | | | 15,652 | |
| Selling, general and administrative | | | 49,392 | | | | 50,459 | | | | 164,120 | | | | 114,936 | |
| Total operating expenses | | | 55,026 | | | | 55,845 | | | | 183,604 | | | | 130,588 | |
| Loss from operations | | | (39,344 | ) | | | (48,212 | ) | | | (134,741 | ) | | | (106,378 | ) |
| Other expense (income): | | | | | | | | | | | | |
| Interest expense | | | 1,844 | | | | 1,760 | | | | 7,546 | | | | 7,734 | |
| Interest income | | | (2,226 | ) | | | (1,656 | ) | | | (8,351 | ) | | | (3,199 | ) |
| Other expense (income) | | | (319 | ) | | | 2,693 | | | | (2,618 | ) | | | 2,766 | |
| Net loss before provision for income taxes | | | (38,643 | ) | | | (51,009 | ) | | | (131,318 | ) | | | (113,679 | ) |
| Provision for income taxes | | | 192 | | | | 102 | | | | 294 | | | | 135 | |
| Net loss | | | (38,835 | ) | | | (51,111 | ) | | | (131,612 | ) | | | (113,814 | ) |
| Less: Undeclared preferred stock dividends | | | — | | | | 3,291 | | | | — | | | | 12,321 | |
| Net loss attributable to common shareholders, basic and diluted | | $ | (38,835 | ) | | $ | (54,402 | ) | | $ | (131,612 | ) | | $ | (126,135 | ) |
| | | | | | | | | | | | | |
| Net loss per share attributable to common shareholders, basic and diluted | | $ | (0.67 | ) | | $ | (2.21 | ) | | $ | (2.43 | ) | | $ | (5.13 | ) |
| Weighted-average shares of common shares outstanding, basic and diluted | | | 58,396,698 | | | | 24,583,745 | | | | 54,184,698 | | | | 24,583,745 | |
| | | | | | | | | | | | | |
| Other comprehensive loss: | | | | | | | | | | | | |
| Net loss | | $ | (38,835 | ) | | $ | (51,111 | ) | | $ | (131,612 | ) | | $ | (113,814 | ) |
| Unrealized loss on marketable securities | | | (218 | ) | | — | | | | (218 | ) | | — | |
| Comprehensive loss | | $ | (39,053 | ) | | $ | (51,111 | ) | | $ | (131,830 | ) | | $ | (113,814 | ) |
| |
| KESTRA MEDICAL TECHNOLOGIES, LTD. AND SUBSIDIARIES CONSOLIDATED BALANCE SHEETS (in thousands, except share and per share amounts) (unaudited) |
| |
| | | April 30, | | | April 30, | |
| | | 2026 | | | 2025 | |
| | | | | | | |
| Assets | | | | | | |
| Current assets | | | | | | |
| Cash and cash equivalents | | $ | 99,710 | | | $ | 237,595 | |
| Short-term investments | | | 96,724 | | | — | |
| Accounts receivable, net | | | 14,542 | | | | 8,081 | |
| Disposable medical equipment supplies | | | 6,706 | | | | 6,572 | |
| Prepaid expenses and other current assets | | | 4,677 | | | | 3,080 | |
| Total current assets | | | 222,359 | | | | 255,328 | |
| | | | | | | |
| Long-term investments | | | 65,767 | | | — | |
| Right-of-use assets | | | 3,364 | | | | 2,078 | |
| Deposits | | | 1,761 | | | | 2,021 | |
| Restricted cash | | | 334 | | | | 334 | |
| Property and equipment, net | | | 59,090 | | | | 34,830 | |
| Other long-term assets | | | 5,790 | | | | 1,153 | |
| Total assets | | $ | 358,465 | | | $ | 295,744 | |
| | | | | | | |
| Liabilities and Shareholders’ Equity | | | | | | |
| Current liabilities | | | | | | |
| Accounts payable | | $ | 27,295 | | | $ | 23,961 | |
| Accrued liabilities | | | 23,046 | | | | 13,829 | |
| Operating lease liabilities, current portion | | | 31 | | | | 187 | |
| Total current liabilities | | | 50,372 | | | | 37,977 | |
| | | | | | | |
| Operating lease liabilities, net of current portion | | | 4,111 | | | | 3,026 | |
| Warrant liabilities | | | 1,369 | | | | 8,097 | |
| Other long-term liabilities | | | 306 | | | | 140 | |
| Long-term debt, net | | | 42,649 | | | | 41,098 | |
| Total liabilities | | | 98,807 | | | | 90,338 | |
| | | | | | | |
| Commitments and contingencies | | | | | | |
| | | | | | | |
| Shareholders’ equity | | | | | | |
| | | | | | | |
| Common Shares, $1.00 par value; 100,000,000 shares authorized as of April 30, 2026 and April 30, 2025; 58,383,924 issued and outstanding as of April 30, 2026 and 51,348,656 shares issued and outstanding as of April 30, 2025 | | | 58,384 | | | | 51,349 | |
| Additional paid-in capital | | | 853,353 | | | | 674,306 | |
| Accumulated other comprehensive loss | | | (218 | ) | | — | |
| Accumulated deficit | | | (651,861 | ) | | | (520,249 | ) |
| Total shareholders’ equity | | | 259,658 | | | | 205,406 | |
| Total liabilities and shareholders’ equity | | $ | 358,465 | | | $ | 295,744 | |
| |
| KESTRA MEDICAL TECHNOLOGIES, LTD. AND SUBSIDIARIES CONSOLIDATED STATEMENTS OF CASH FLOWS (in thousands) (unaudited) |
| |
| | | Year Ended April 30, | |
| | | 2026 | | | 2025 | |
| Cash flows from operating activities | | | | | | |
| Net loss | | $ | (131,612 | ) | | $ | (113,814 | ) |
| Adjustments to reconcile net loss to net cash used in operating activities: | | | | | | |
| Depreciation and amortization | | | 8,709 | | | | 7,968 | |
| Loss on disposal of property and equipment | | | 1,161 | | | | 1,340 | |
| Reserve for equipment and supplies | | | 2,435 | | | | 754 | |
| Provision for uncollectible accounts receivable | | | 2,596 | | | | 2,694 | |
| Amortization (accretion) of premiums (discounts) on securities, net | | | (106 | ) | | — | |
| Interest paid-in-kind | | | — | | | | 855 | |
| Amortization of debt discounts and issuance costs | | | 1,874 | | | | 1,400 | |
| Share-based compensation expense | | | 33,644 | | | | 24,270 | |
| Non-cash lease expense | | | 326 | | | | 416 | |
| Deferred income tax expense | | | 166 | | | | 64 | |
| Change in fair value of warrant liabilities | | | (2,673 | ) | | | 2,648 | |
| Changes in operating assets and liabilities: | | | | | | |
| Disposable medical equipment supplies | | | (458 | ) | | | (3,443 | ) |
| Prepaid expenses and other current assets | | | (563 | ) | | | (1,852 | ) |
| Accounts receivable | | | (9,056 | ) | | | (8,777 | ) |
| Accounts payable | | | 4,302 | | | | 2,842 | |
| Accrued liabilities | | | 8,197 | | | | 4,617 | |
| Operating lease liabilities | | | (685 | ) | | | 370 | |
| Other long-term assets | | | 40 | | | | 40 | |
| Net cash used in operating activities | | | (81,703 | ) | | | (77,608 | ) |
| Cash flows from investing activities | | | | | | |
| Purchases of property and equipment | | | (34,892 | ) | | | (22,936 | ) |
| Deposits for medical rental equipment | | | (528 | ) | | | (655 | ) |
| Refund of deposits for medical rental equipment | | | 184 | | | | 283 | |
| Investment in equity security | | | (5,000 | ) | | | — | |
| Purchase of marketable securities | | | (163,041 | ) | | | — | |
| Net cash used in investing activities | | | (203,277 | ) | | | (23,308 | ) |
| Cash flows from financing activities | | | | | | |
| Proceeds from issuance of redeemable preferred stock | | | — | | | | 103,400 | |
| Proceeds from issuance of common stock | | | 149,291 | | | | 215,789 | |
| Proceeds from issuance of stock to non-controlling interest | | | — | | | | 17,100 | |
| Proceeds from capital contributions | | | — | | | | 2,374 | |
| Payment of IPO offering costs | | | — | | | | (3,523 | ) |
| Payment of equity issuance costs | | | (2,466 | ) | | | (3,224 | ) |
| Deemed dividend for payments to third party on behalf of shareholder | | | (323 | ) | | | (1,654 | ) |
| Proceeds from stock option exercises | | | 593 | | | | — | |
| Net cash provided by financing activities | | | 147,095 | | | | 330,262 | |
| Net increase (decrease) in cash, cash equivalents and restricted cash | | | (137,885 | ) | | | 229,346 | |
| Cash, cash equivalents and restricted cash | | | | | | |
| Beginning of period | | | 237,929 | | | | 8,583 | |
| End of period | | $ | 100,044 | | | $ | 237,929 | |
| |
| RECONCILIATION OF CASH, CASH EQUIVALENTS AND RESTRICTED CASH TO CASH, CASH EQUIVALENTS, AND INVESTMENTS (in thousands) (unaudited) |
| |
| | | Year Ended April 30, | |
| | | 2026 | | | 2025 | |
| Cash, cash equivalents and restricted cash | | $ | 100,044 | | | $ | 237,929 | |
| Add: Short-term investments | | | 96,724 | | | | — | |
| Add: Long-term investments | | | 65,767 | | | | — | |
| Less: Restricted cash | | | (334 | ) | | | (334 | ) |
| Cash, cash equivalents, and investments | | $ | 262,201 | | | $ | 237,595 | |
| |
| RECONCILIATION OF GAAP NET LOSS TO ADJUSTED EBITDA (in thousands) (unaudited) |
| |
| | | Three Months Ended April 30, | | | Year Ended April 30, | |
| | | 2026 | | | 2025 | | | 2026 | | | 2025 | |
| | | | | | | | | | | | | |
| GAAP Net loss | | $ | (38,835 | ) | | $ | (51,111 | ) | | $ | (131,612 | ) | | $ | (113,814 | ) |
| Non-GAAP Adjustments: | | | | | | | | | | | | |
| Interest expense | | | 1,844 | | | | 1,760 | | | | 7,546 | | | | 7,734 | |
| Interest income | | | (2,226 | ) | | | (1,656 | ) | | | (8,351 | ) | | | (3,199 | ) |
| Other expense (income) | | | (319 | ) | | | 2,693 | | | | (2,618 | ) | | | 2,766 | |
| Provision for income taxes | | | 192 | | | | 102 | | | | 294 | | | | 135 | |
| Depreciation expense | | | 2,325 | | | | 1,836 | | | | 8,709 | | | | 7,968 | |
| Share-based compensation expense | | | 10,304 | | | | 22,313 | | | | 33,644 | | | | 24,271 | |
| Non-recurring expenses | | | — | | | | 3,809 | | | | 5,396 | | | | 5,736 | |
| Adjusted EBITDA | | $ | (26,715 | ) | | $ | (20,254 | ) | | $ | (86,992 | ) | | $ | (68,403 | ) |
| |
| RECONCILIATION OF GAAP OPERATING EXPENSES TO ADJUSTED OPERATING EXPENSES (in thousands) (unaudited) |
| |
| | | Three Months Ended April 30, | | | Year Ended April 30, | |
| | | 2026 | | | 2025 | | | 2026 | | | 2025 | |
| | | | | | | | | | | | | |
| GAAP Operating Expenses | | $ | 55,026 | | | $ | 55,845 | | | $ | 183,604 | | | $ | 130,588 | |
| Non-GAAP Adjustments: | | | | | | | | | | | | |
| Share-based compensation expense | | | 10,304 | | | | 22,313 | | | | 33,644 | | | | 24,271 | |
| Non-recurring expenses | | | — | | | | 3,809 | | | | 5,396 | | | | 5,736 | |
| Adjusted Operating Expenses | | $ | 44,722 | | | $ | 29,723 | | | $ | 144,564 | | | $ | 100,581 | |

Investor Relations Neil Bhalodkar [email protected]
Search Investors