July 27, 2026 at 9:15 AM EDT PDF Version Collaboration aims to help patients feel more informed, prepared and engaged in their care SUNNYVALE, Calif., July 27, 2026 (GLOBE NEWSWIRE) -- Intuitive (NASDAQ: ISRG), a global technology leader in minimally…
July 27, 2026 at 9:15 AM EDT
PDF Version
Collaboration aims to help patients feel more informed, prepared and engaged in their care
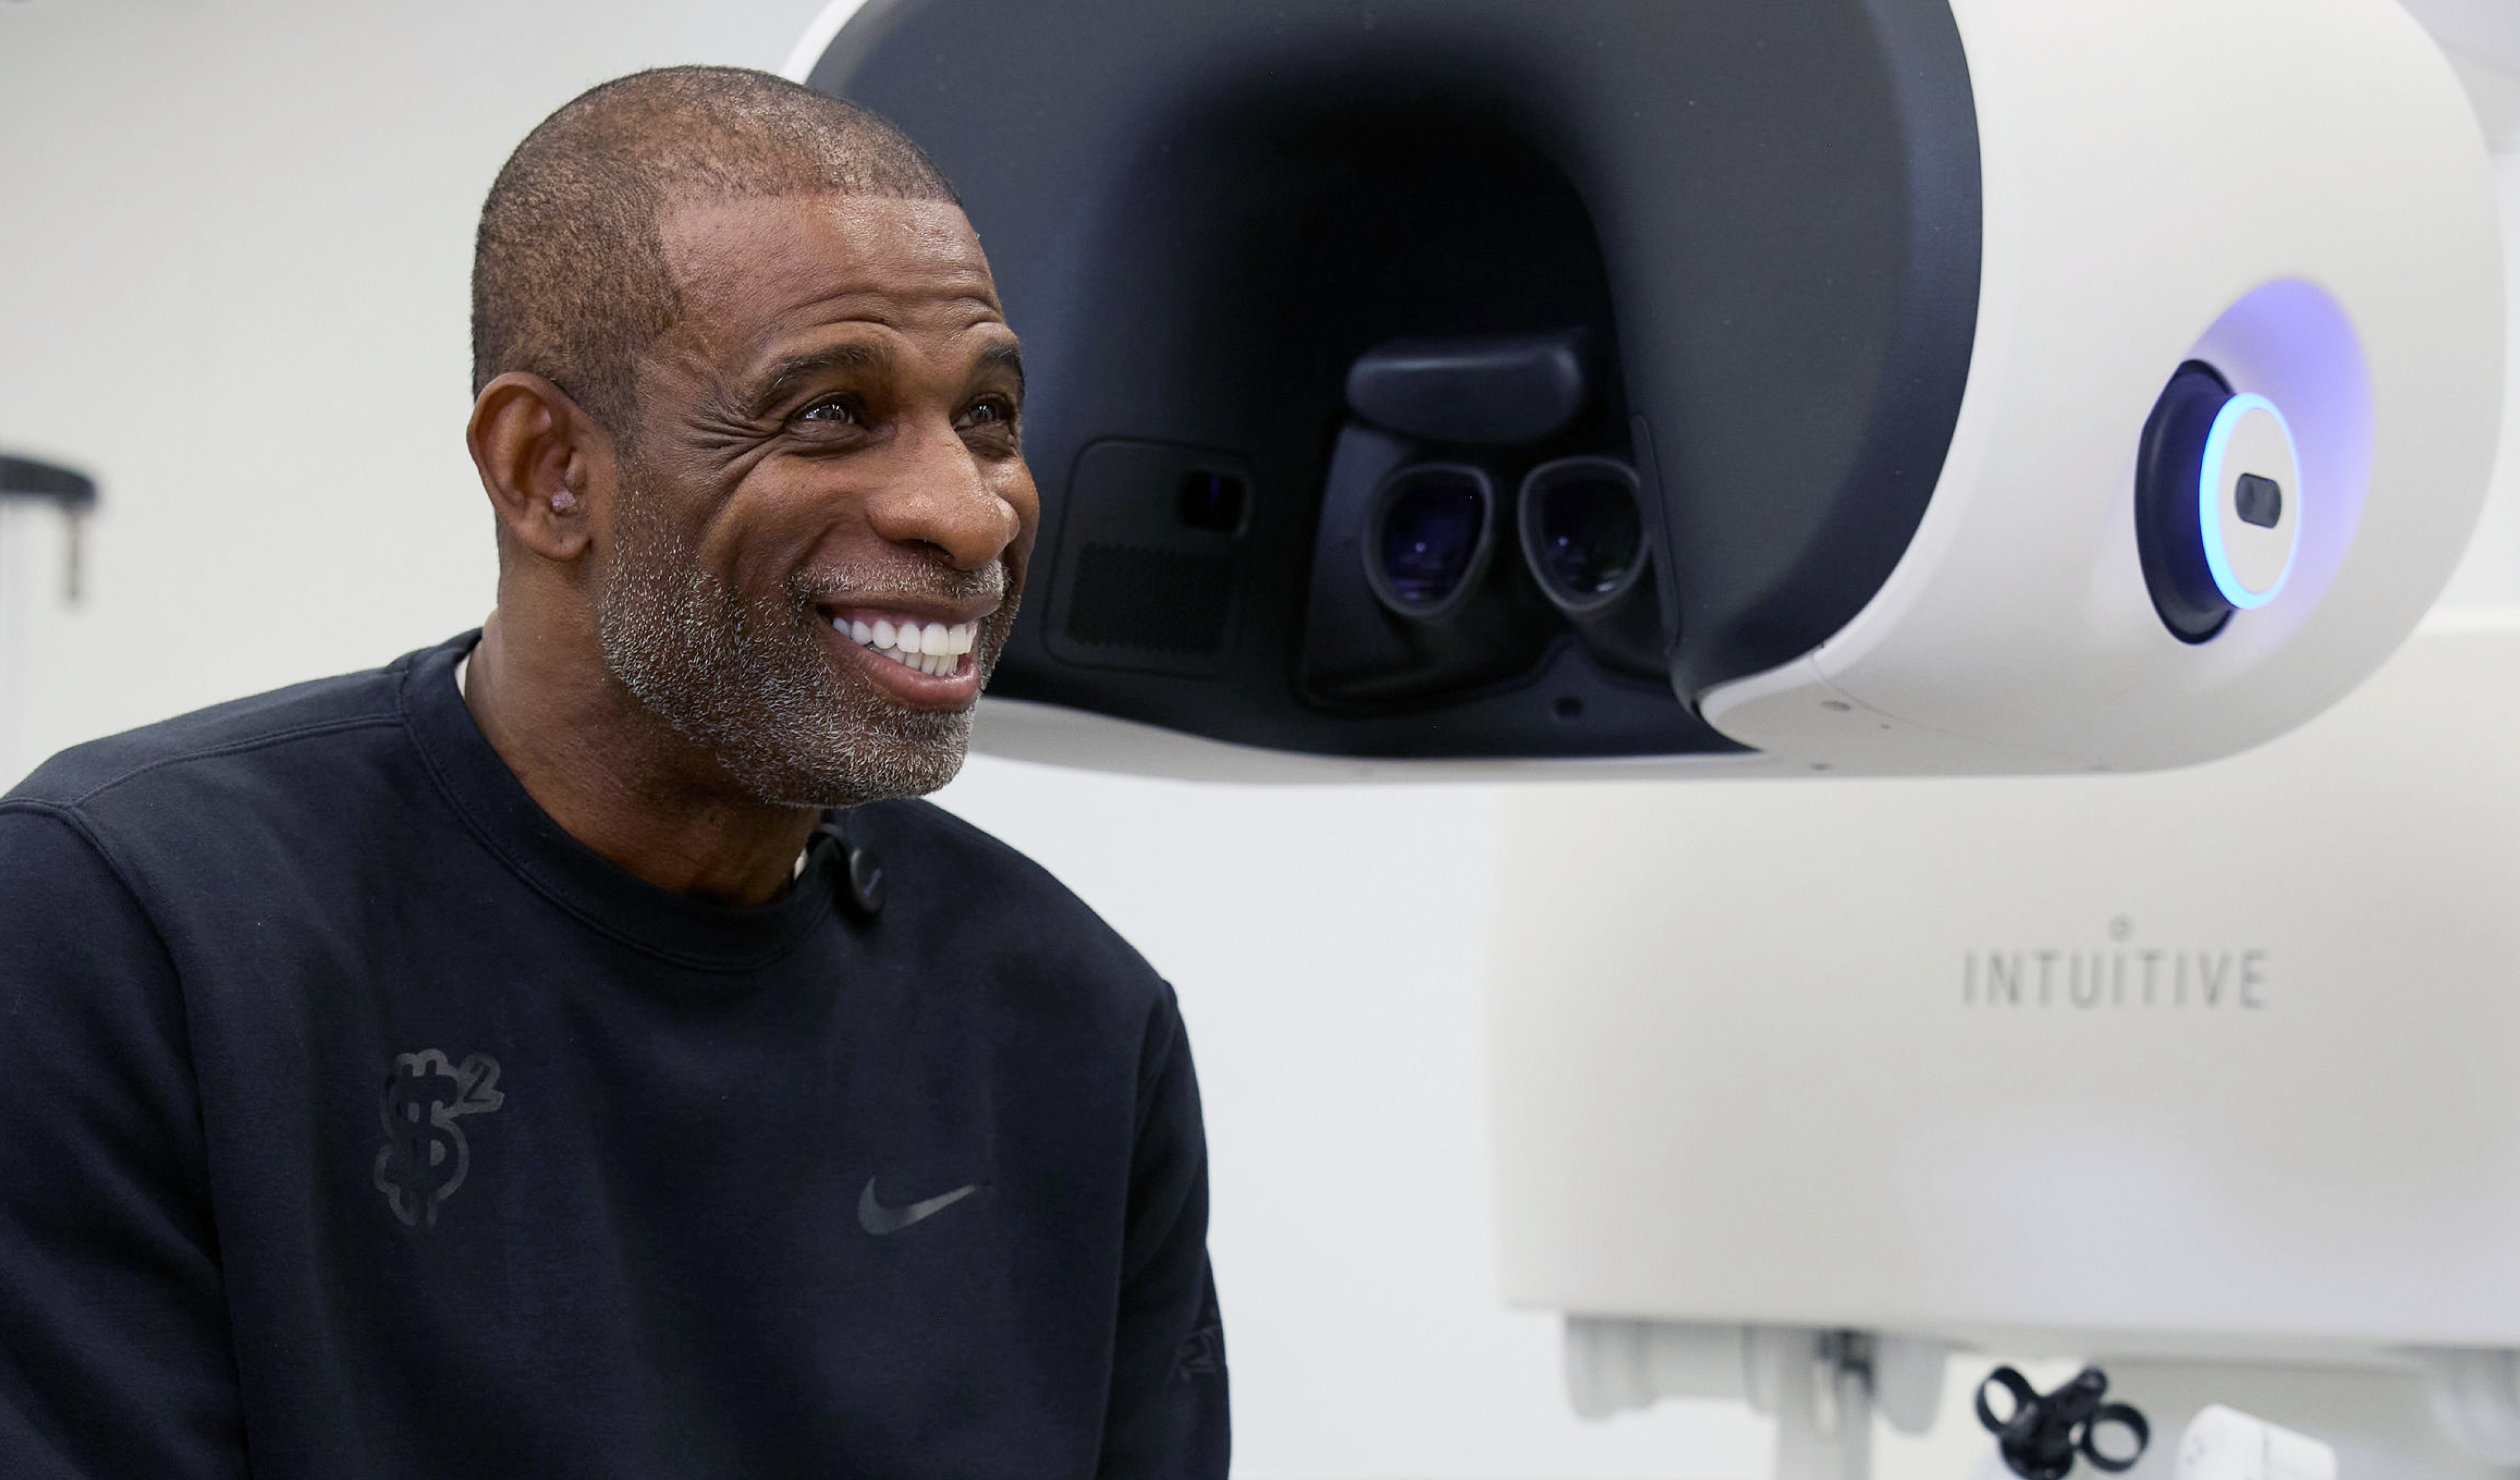
SUNNYVALE, Calif., July 27, 2026 (GLOBE NEWSWIRE) -- Intuitive (NASDAQ: ISRG), a global technology leader in minimally invasive care and the pioneer of robotic-assisted surgery, today announced a collaboration with Deion “Coach Prime” Sanders to help increase patient awareness and understanding of surgical options, including robotic-assisted surgery with da Vinci systems.
Surgical decisions following a diagnosis are among the most complex, emotional, and time-sensitive that patients and their families face, yet independent research shows many patients struggle to find clear, trustworthy information about robotic-assisted surgery.1 This collaboration aims to increase patient and caregiver awareness and understanding of surgical options, supporting more informed conversations between patients and their physicians and, ultimately, more confident decision-making.
In 2025, after being diagnosed with bladder cancer, Coach Prime chose to undergo robotic surgery with da Vinci following discussions with his physician about his available options and the risks and benefits associated with each. His choice was based on what mattered most to him, including his recovery and returning to his daily life and responsibilities.
“When I was diagnosed, I learned quickly that you have choices when it comes to surgery, but not every patient knows to ask about them,” said Coach Prime. “I want to inspire others to talk with their doctors, ask questions, and understand what’s possible.”
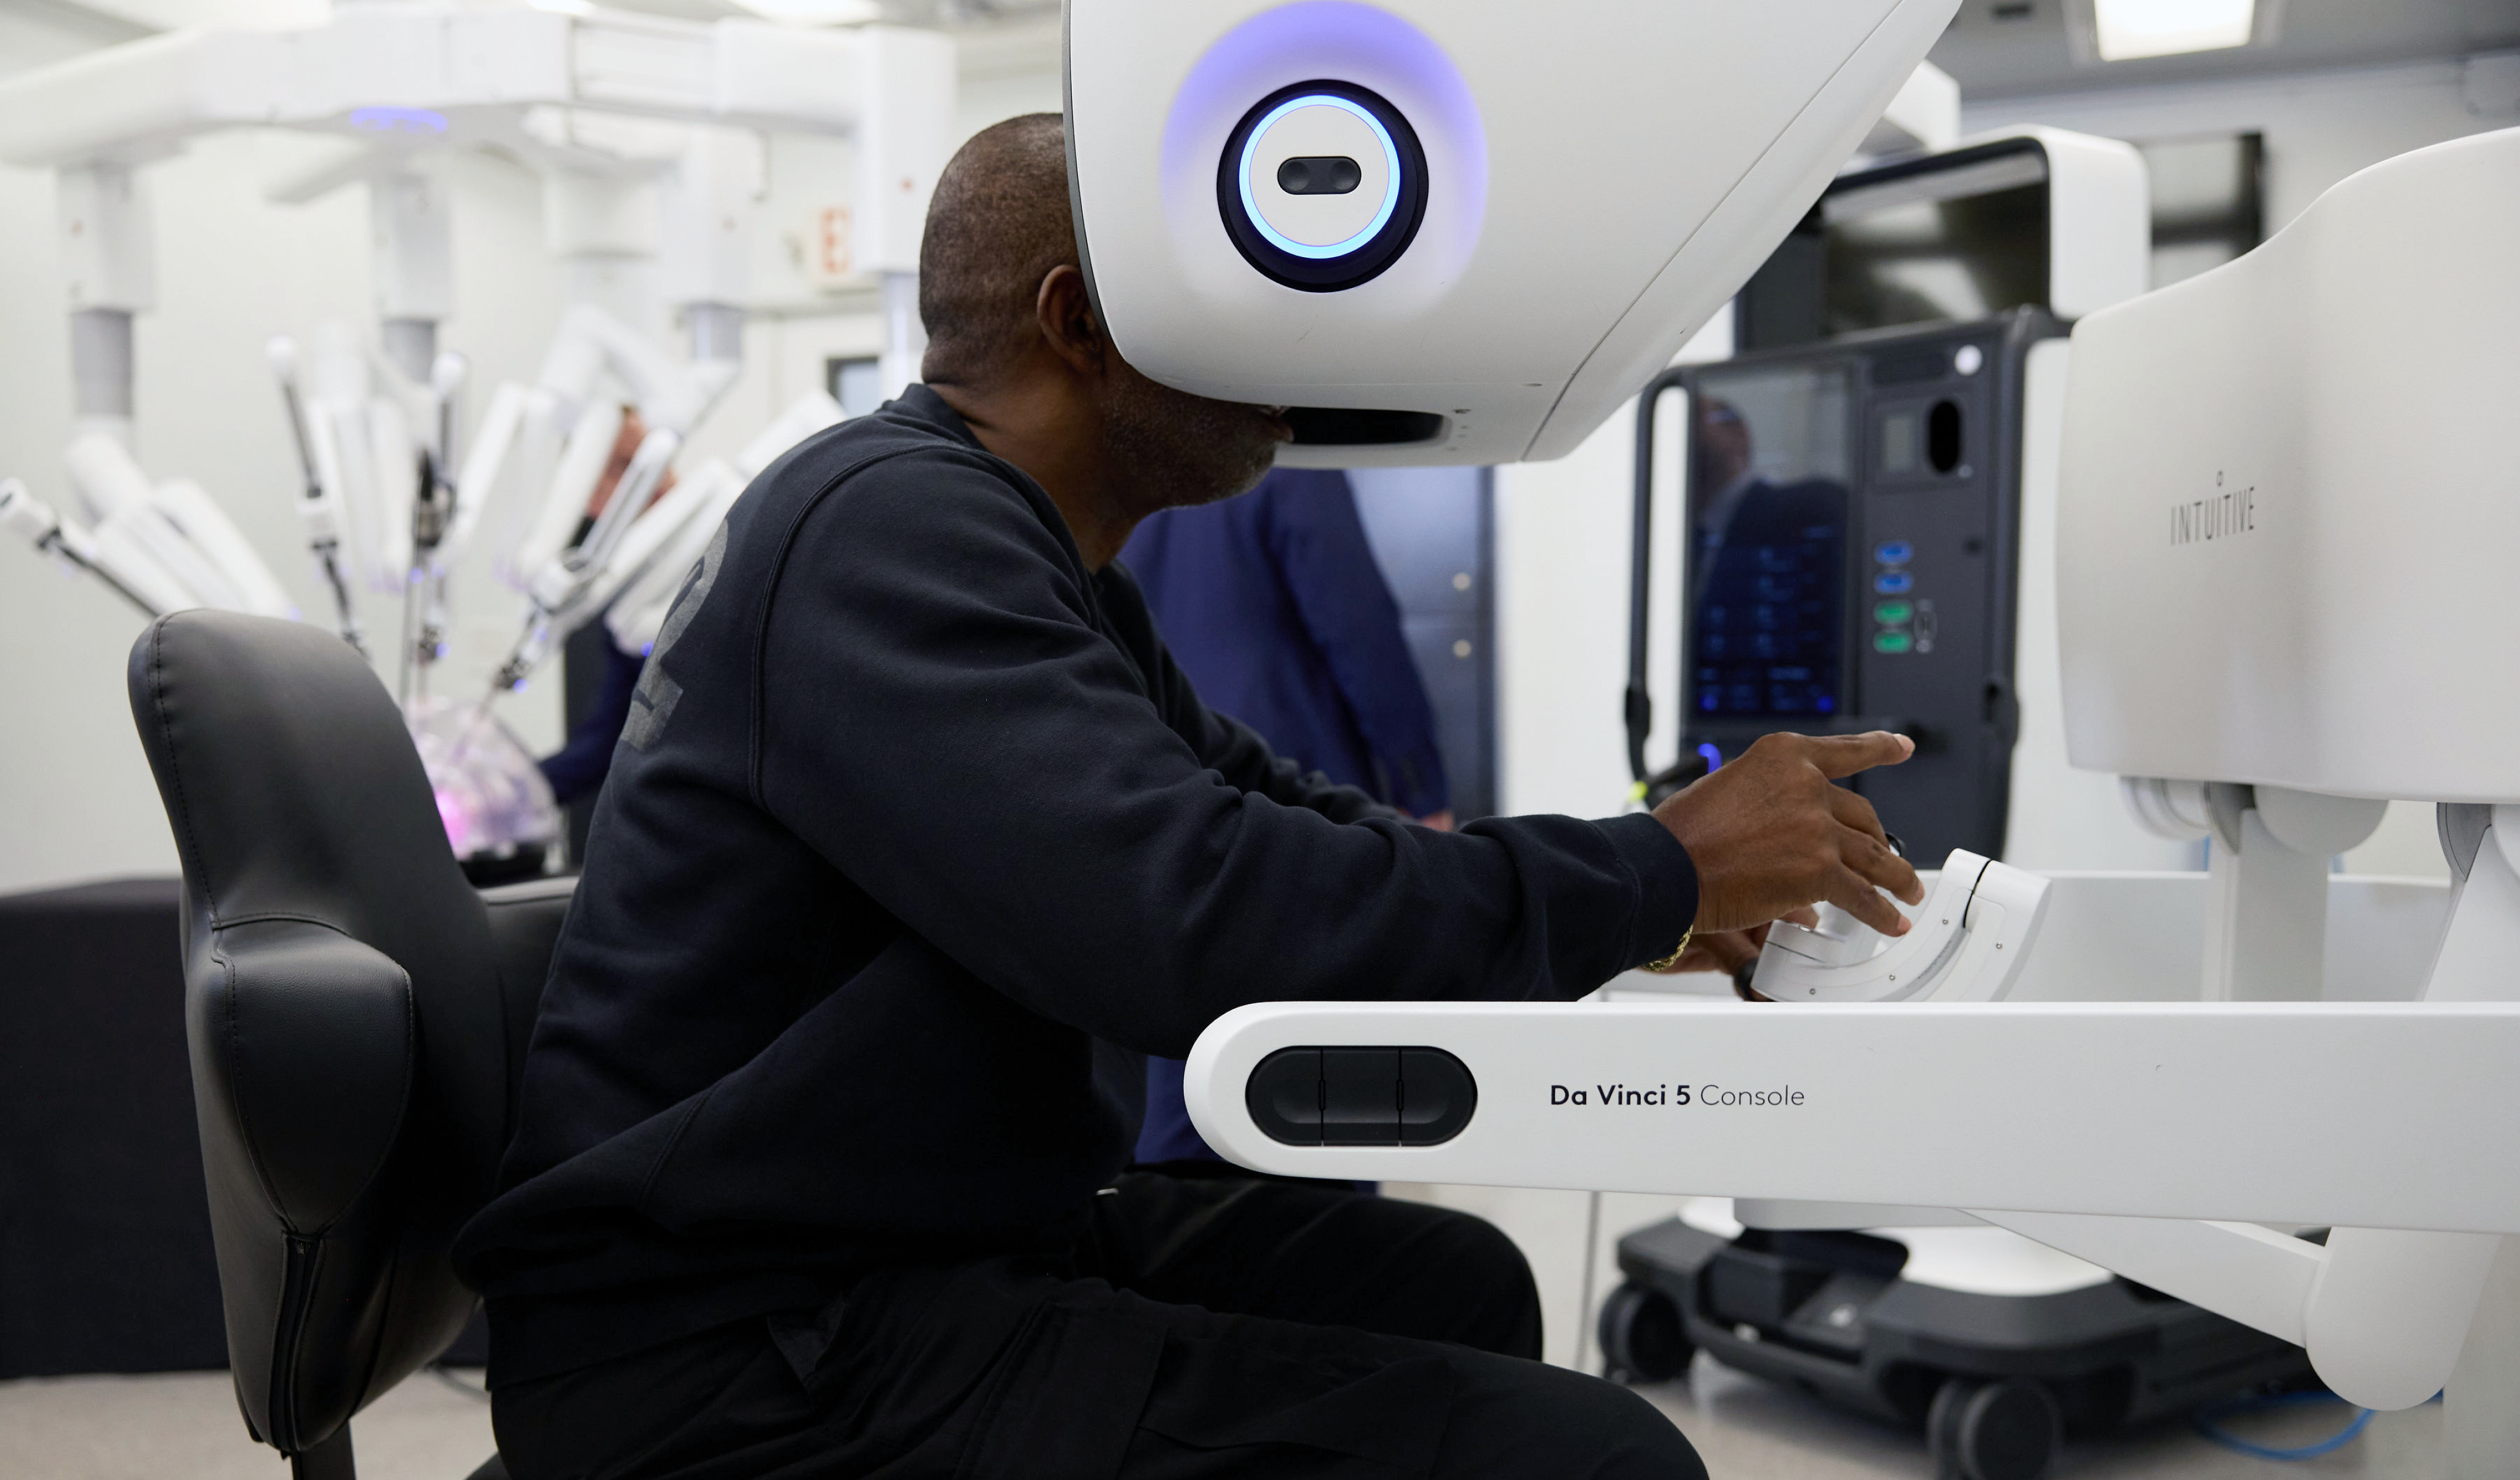
Coach Prime is now using his experience to help others facing health diagnoses and decisions better understand their options – encouraging patients to seek information, ask questions, and engage in informed discussions with their physicians about their care.
“Patients deserve to understand the surgical options available to them and how those options may align with what matters most in their lives,” said Jaime Wong, MD, Chief Medical Officer at Intuitive. “Hearing how others navigated similar decisions can help make complex choices feel more tangible and less overwhelming. When patients are informed, they have more meaningful conversations with their physicians and make decisions with greater confidence.”
More than 20 million patients worldwide have been operated on by surgeons using da Vinci systems.2 When performed by a trained surgeon, robotic-assisted surgery with da Vinci systems can help enable more precise and less invasive surgery, compared to open surgery, and depending on the procedure, may result in fewer complications, shorter recovery time and less pain.3
Additional Resources
-
Patients can learn more at davincisurgery.com.
-
Read more: Jaime Wong, MD, Chief Medical Officer at Intuitive, shares his perspective on patient empowerment and how patients can have meaningful conversations with their physicians about surgical options.
1 Jauniaux, B., Anand, A., Abbas, R., & Harji, D. P. (2025). From expectations to experiences: A systematic review of patient and public perspectives on robotic surgery. Journal of Robotic Surgery, 19(1), 484. https://doi.org/10.1007/s11701-025-02649-y
2 Intuitive data on file
3 Ricciardi R, et al. The COMPARE Study: Comparing Perioperative Outcomes of Oncologic Minimally Invasive Laparoscopic, da Vinci Robotic, and Open Procedures: A Systematic Review and Meta-analysis of the Evidence. Ann Surg. 2025;281(5):748-763.
About Intuitive
Intuitive (NASDAQ:ISRG), headquartered in Sunnyvale, California, is a global leader in minimally invasive care and the pioneer of robotic-assisted surgery. Our technologies include the da Vinci surgical system and the Ion endoluminal system. By uniting advanced systems, progressive learning, and value-enhancing services, we help physicians and their teams optimize care delivery to support the best outcomes possible. At Intuitive, we envision a future of care that is less invasive and profoundly better, where disease is identified early and treated quickly, so that patients can get back to what matters most.
About da Vinci Surgical Systems
There are several models of the da Vinci surgical system. The da Vinci surgical systems are designed to help surgeons perform minimally invasive surgery and offer surgeons high-definition 3D vision, a magnified view, and robotic and computer assistance. They use specialized instrumentation, including a miniaturized surgical camera and wristed instruments (i.e., scissors, scalpels, and forceps) that are designed to help with precise dissection and reconstruction deep inside the body. The da Vinci surgical system is a tool used for surgery; it does not treat cancer.
Important Safety Information
Patients should consult with their doctor to discuss both nonsurgical and surgical treatment options, including the benefits and risks associated with each. They should also ask whether surgery using the da Vinci system is appropriate for their specific situation. As with any surgical procedure, serious complications can occur, including, in rare cases, death. Potential risks include injury to tissues and organs, as well as the possibility of switching to alternative surgical techniques during the operation, which may result in longer operative times and increased risk of complications.
For a summary of the risks and considerations associated with surgery, please refer to intuitive.com/surgery.
Comments reflect an individual patient experience that may or may not be reproducible and are not generalizable. Patient outcomes may depend on a number of factors, including but not limited to patient characteristics, disease characteristics, and/or physician/surgeon experience. The da Vinci system is a tool used for surgery, but it does not treat cancer.
Coach Prime has received compensation from Intuitive for his testimonial.
@2026 Intuitive Surgical Operations, Inc. All rights reserved. Product and brand names/logos are trademarks or registered trademarks of Intuitive Surgical or their respective owner.
Forward-Looking Statements
This press release contains forward-looking statements which relate to expectations concerning matters that are not historical facts. Statements using words such as “estimates,” “projects,” “believes,” “anticipates,” “plans,” “expects,” “intends,” “may,” “will,” “can,” “could,” “should,” “would,” “targeted,” “potential,” and similar words and expressions are intended to identify forward-looking statements. These forward-looking statements are necessarily estimates reflecting the judgment of Intuitive’s management and involve a number of risks and uncertainties that could cause actual results or impacts on its operations, financial performance, and business position to differ materially from those suggested by the forward-looking statements.
These forward-looking statements include, but are not limited to, statements related to research and development of products and services, manufacturing of products, integration of products, obtaining of regulatory approvals, technical and other performance of products and services, and making products and services available to more patients and health care professionals.
These forward-looking statements should be considered in light of various important factors and involve known and unknown risks, uncertainties, and other factors, which may cause the actual results, performance, or achievements of Intuitive, or industry results, to be materially different from any future results, performance, or achievements expressed or implied by such forward-looking statements. Important factors that could cause actual results to differ materially from those anticipated in the forward-looking statements include, among others, economic conditions in the geographic markets in which we operate, changes in governmental regulations, regulatory approval priorities, resources, and timelines, regulatory enforcement priorities, governmental investigations and civil litigation, and other factors discussed in Intuitive’s Annual Reports and other filings with relevant securities regulators.
Readers are cautioned not to place undue reliance on these forward-looking statements, which speak only as of the date of this press release and which are based on current expectations and are subject to risks, uncertainties, and assumptions that are difficult to predict, including those risk factors identified under the heading “Risk Factors” in Intuitive’s Annual Report on Form 10-K for the year ended December 31, 2025, as updated by its other filings with the U.S. Securities and Exchange Commission. Intuitive’s actual results may differ materially and adversely from those expressed in any forward-looking statements, and it undertakes no obligation to publicly update or release any revisions to these forward-looking statements, except as required by law.