Nov 3 Written By Kevin Jirka Reports record revenue of $21.2 million for the third quarter of 2025, an increase of $2.9 million, or 16%, compared to the same period in 2024. Reports record GAAP diluted EPS of $0.43 and non-GAAP diluted EPS of $0.47…
Nov 3
Written By Kevin Jirka
-
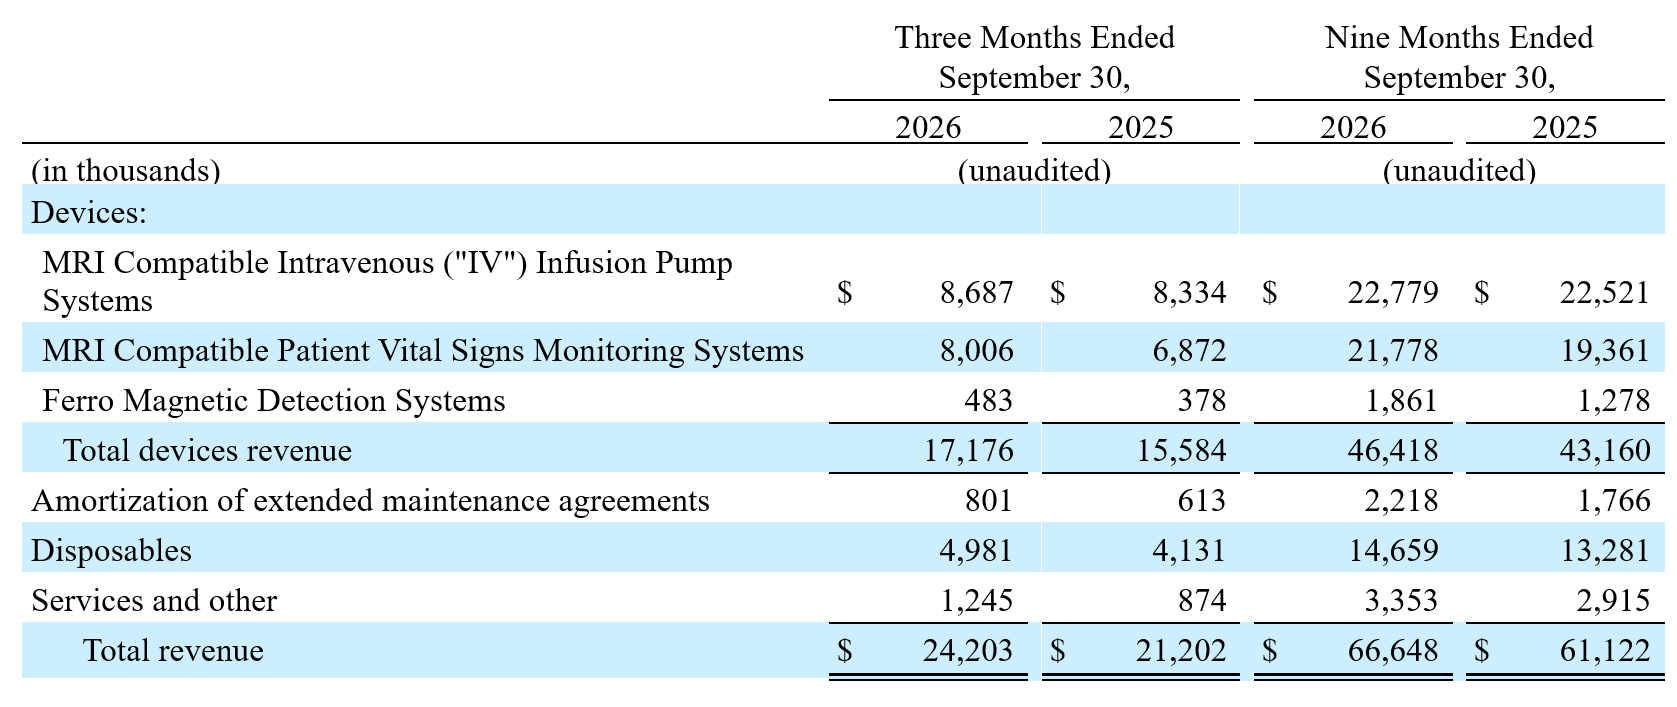
Reports record revenue of $21.2 million for the third quarter of 2025, an increase of $2.9 million, or 16%, compared to the same period in 2024.
-
Reports record GAAP diluted EPS of $0.43 and non-GAAP diluted EPS of $0.47 for the third quarter of 2025, which are increases of 8% and 9%, respectively, compared to the same period in 2024.
-
Raises full-year guidance to revenue of $82.5 million to $83.5 million and GAAP diluted EPS to $1.68 to $1.72.
-
Declares a regular quarterly cash dividend of $0.17 per share of common stock for the fourth quarter of 2025, payable on November 25, 2025.
Orlando, Florida, November 3, 2025 – IRADIMED CORPORATION (the “Company” or “Iradimed”) (NASDAQ: IRMD) announced today its financial results for the three and nine months ended September 30, 2025. The Company is a leader in developing innovative magnetic resonance imaging (“MRI”) compatible medical devices and products. The company is a provider of (i) non-magnetic intravenous (“IV”) infusion pump systems and (ii) a non-magnetic patient vital signs monitoring system that are each designed for use during MRI procedures.
“We are proud to announce our seventeenth consecutive quarter of record revenue, reaching $21.2 million in the third quarter of 2025—a 16% increase year-over-year and exceeding our previously announced guidance. Although we experienced some transitional inefficiencies as we settled into our new Orlando facility early in the quarter, we maintained a strong 78% gross margin. As of the end of the third quarter, the facility is fully operational, positioning us to efficiently meet accelerating demand, with our pump and monitor backlog at all-time highs. None of this would have been possible without the extraordinary dedication of our employees, whose tireless efforts—especially during the move to the new facility—ensured a seamless transition while delivering exceptional results. We are deeply grateful for their hard work and commitment.
We are on track to begin limited commercial shipments of the next-generation 3870 MRI-compatible IV infusion pump this December, with full U.S. commercialization and rollout in the first quarter of 2026 and expected revenue ramping significantly in the second half of 2026. We remain committed to operational excellence, innovation, and delivering consistent shareholder returns - including our regular $0.17 quarterly dividend per share, payable on November 25, 2025,” said Roger Susi, President and Chief Executive Officer of Iradimed.
“Looking ahead, for the fourth quarter of 2025 financial guidance, we expect revenue of $21.4 million to $22.4 million, GAAP diluted earnings per share of $0.43 to $0.47, and non-GAAP diluted earnings per share of $0.47 to $0.51. We are raising our guidance for the full-year 2025 revenue to $82.5 million to $83.5 million from the previous revenue of $80.0 million to $82.5 million, GAAP diluted earnings per share to $1.68 to $1.72 from the previous $1.60 to $1.70, and non-GAAP diluted earnings per share to $1.84 to $1.88 from the previous $1.76 to $1.86,” added Mr. Susi.
The Company’s board of directors declared a regular quarterly cash dividend of $0.17 per share of our outstanding common stock. The dividend is payable to stockholders of record as of the close of business on November 14, 2025 and will be paid on November 25, 2025.
Three Months Ended September 30, 2025
For the three months ended September 30, 2025, the Company reported revenue of $21.2 million, an increase of $2.9 million, compared to $18.3 million for the comparable period of 2024, an increase of 16%. The Company reported net income of $5.6 million, compared to $5.0 million for the comparable period of 2024, an increase of 10%, or $0.43 per diluted share, for the three months ended September 30, 2025, compared to $0.40 per diluted share for the same period of 2024, an increase of 8%.
For the three months ended September 30, 2025, the Company reported non-GAAP net income of $6.1 million, which excludes $0.5 million of stock compensation expense, net of tax benefit, compared to $5.5 million, which excludes $0.5 million of stock compensation expense, net of tax benefit, an increase of 10% for the comparable period of 2024. On a non-GAAP basis, net income per diluted share was $0.47 for the three months ended September 30, 2025, compared to $0.43 per diluted share for the comparable period of 2024, an increase of 9%.
Nine Months Ended September 30, 2025
For the nine months ended September 30, 2025, the Company reported revenue of $61.1 million compared to $53.9 million for the comparable period of 2024, an increase of 13%. Net income was $16.0 million compared to $14.1 million for the comparable period of 2024, an increase of 13%, or $1.25 per diluted share, for the nine months ended September 30, 2025, compared to $1.10 per diluted share for the same period of 2024, an increase of 14%.
For the nine months ended September 30, 2025, the Company reported non-GAAP net income of $17.8 million, which excludes $1.8 million of stock compensation expense, net of tax benefit, compared to $15.6 million, which excludes $1.5 million of stock compensation expense, net of tax benefit, an increase of 14%. On a non-GAAP basis, net income per diluted share was $1.39 for the nine months ended September 30, 2025, compared to $1.22 per diluted share for the comparable period of 2024, an increase of 14%.
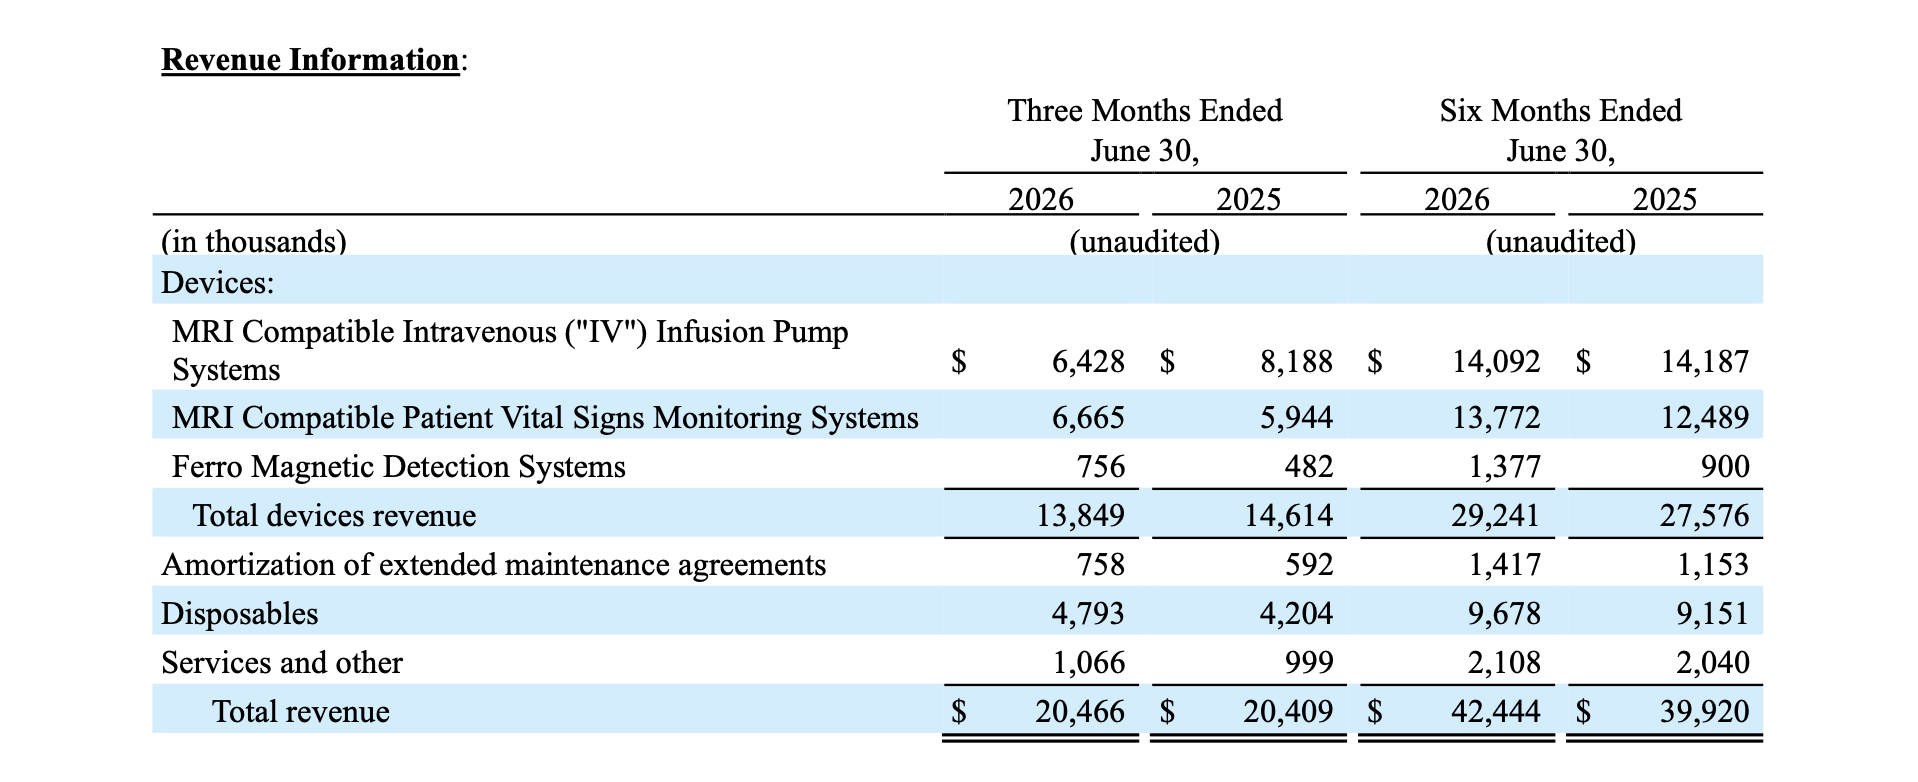
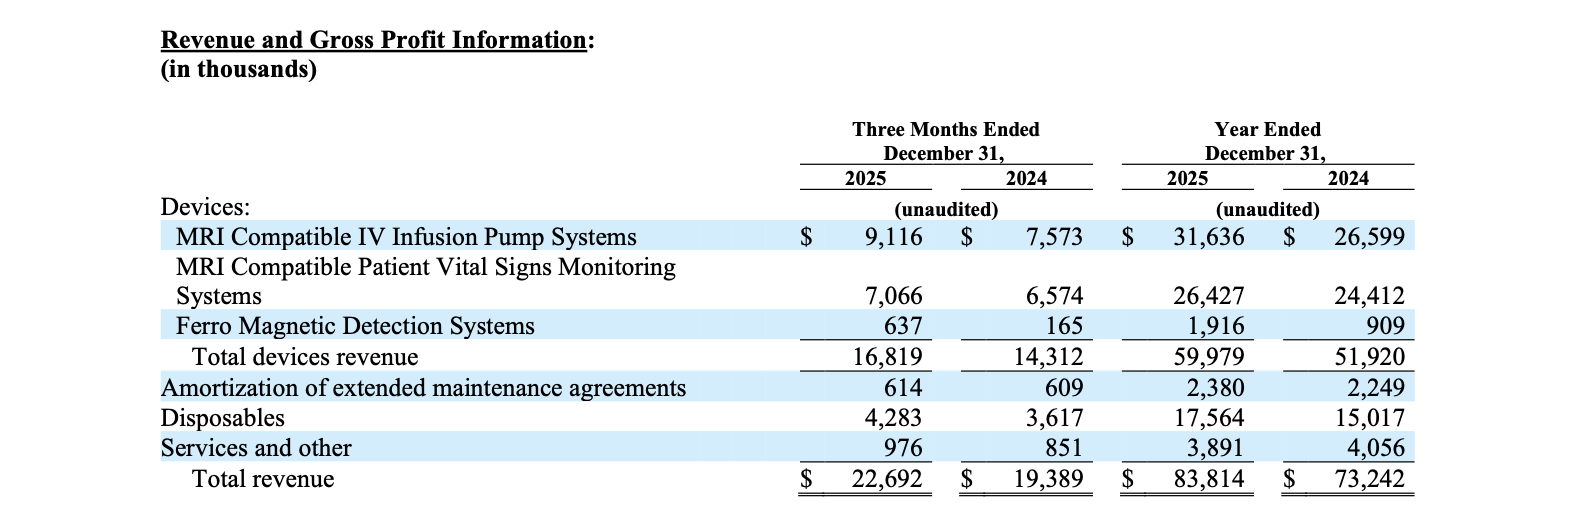
Revenue Information:
For the three months ended September 30, 2025, domestic sales were 85% of total revenue, compared to 83% for the comparable period of 2024. For the three months ended September 30, 2025, the gross profit margin was 78% compared to 77% for comparable period of 2024.
For the nine months ended September 30, 2025, domestic sales were 85% of total revenue, compared to 82% for the comparable period of 2024. The gross profit margin was constant at 77% for both the nine months ended September 30, 2025 and 2024.
Cash Flow from Operations
For the three months ended September 30, 2025, cash flow from operations was $7.0 million, compared to $9.1 million for the comparable period of 2024, a decrease of 23%. During the three months ended September 30, 2025, cash provided by operations was positively impacted by higher net income, and lower cash outflows related to accounts payable, and negatively impacted by increased inventory purchases, prepaid expenses and accounts receivable. See the compilation of non-GAAP free cash flow in the table later in this release.
For the nine months ended September 30, 2025, cash flow from operations was $19.0 million, compared to $19.6 million for the comparable period of 2024, a decrease of 3%. During the nine months ended September 30, 2025, cash provided by operations was positively impacted by higher net income and lower cash outflows related to accounts payable, and negatively impacted by increased inventory purchases, prepaid expenses and accounts receivable. See the compilation of non-GAAP free cash flow in the table later in this release.
The construction of the Company’s new facility in Orlando, Florida (the “New Facility”), was completed in early July 2025. The final payments on the New Facility made in the third quarter of 2025 totaled approximately $1.3 million in cash. The total construction cost of the New Facility was approximately $13.3 million.
Financial Guidance
For the fourth quarter of 2025, the Company expects revenue of $21.4 million to $22.4 million, GAAP diluted earnings per share of $0.43 to $0.47, and non-GAAP diluted earnings per share of $0.47 to $0.51. For the full year 2025, the Company expects to report revenue of $82.5 million to $83.5 million, GAAP diluted earnings per share of $1.68 to $1.72, and non-GAAP diluted earnings per share of $1.84 to $1.88.
The Company’s non-GAAP diluted earnings per share guidance excludes stock-based compensation expense, net of tax expense. The Company expects stock-based compensation expense, net of tax, to be approximately $2.4 million and $0.6 million for the full year and fourth quarter of 2025, respectively.
Use of Non-GAAP Financial Measures
The Company believes using non-GAAP net income, non-GAAP net income per share-diluted, and free cash flow is helpful to our investors. These measures, which we refer to as our non-GAAP financial measures, are not prepared in accordance with accounting principles generally accepted in the United States of America (“GAAP”). These non-GAAP measures are intended to provide the reader with additional supplemental perspectives on operating results, performance trends, and financial condition. Non-GAAP financial measures are not a substitute for GAAP measures; they should be read and used in conjunction with the Company’s GAAP financial information. Because non-GAAP financial measures presented in this release are not measurements determined in accordance with GAAP and are susceptible to varying calculations, these non-GAAP financial measures, as presented, may not be comparable to other similarly titled measures presented by other companies.
We calculate non-GAAP net income as net income excluding:
(1) Stock-based compensation expense, net of tax. Because of varying available valuation methodologies, subjective assumptions, and the variety of equity instruments that can impact a company’s non-cash expenses, we believe that providing non-GAAP financial measures that exclude stock-based compensation expense allows for meaningful comparisons between our operating results from period to period;
(2) Operating expenses, net of tax, that we believe are not indicative of the Company’s ongoing core operating performance; and
(3) Infrequent income tax items are considered based on their nature and are excluded from the provision for income taxes as these costs or benefits are not indicative of our normal or future provision for income taxes.
We calculate free cash flow as net cash provided by operating activities, less net cash used in investing activities for the development of internal software and purchases of property and equipment.
We consider free cash flow to be a liquidity measure that provides useful information to management and investors about the amount of cash generated by our business that can be used for strategic opportunities, including investing in our business, making strategic acquisitions, strengthening our balance sheet and returning cash to our stockholders through various means.
Our non-GAAP financial measures are important tools for financial and operational decision-making and for evaluating our ongoing core operating results.
A reconciliation of the non-GAAP financial measures used in this release to the most comparable GAAP measures for the respective periods can be found in the table later in this release immediately following the condensed statements ofoperations. These non-GAAP financial measures should not be considered in isolation or as a substitute for a measure of the Company’s operating performance or liquidity prepared in accordance with GAAP and are not indicative of net income or cash provided by operating activities.
Conference Call
The Company has scheduled a conference call to discuss this release beginning at 11:00 a.m. Eastern Time, November 3, 2025. Individuals interested in listening to the conference call may do so by registering here, https://register-conf.media-server.com/register/BIb4c35afb95154b348a034716bd7b99d8
.
Once registered a dial-in number, a unique PIN, and instructions will be provided to participants.
The conference call will also be available in real-time via the Internet at http://www.iradimed.com/en-us/investors/events/
. A recording of the call will be available on the Company’s website following the call's completion.
About IRADIMED CORPORATION
IRADIMED CORPORATION is a leader in developing innovative Magnetic Resonance Imaging (“MRI”) compatible medical devices. We design, manufacture, market, and distribute MRI-compatible medical devices, accessories, disposables, and related services.
We are the only known provider of a non-magnetic intravenous (“IV”) infusion pump system specifically designed to be safe for use during MRI procedures. We were the first to develop an infusion delivery system that largely eliminates many of the dangers and problems present during MRI procedures. Standard infusion pumps contain magnetic and electronic components that can create radio frequency interference and are dangerous to operate in the presence of the powerful magnet that drives an MRI system. Our patented MRidium® MRI compatible IV infusion pump system has a non-magnetic ultrasonic motor, uniquely designed non-ferrous parts, and other special features to safely and predictably deliver anesthesia and other IV fluids during various MRI procedures. Our pump solution provides a seamless approach that enables accurate, safe, and dependable fluid delivery before, during, and after an MRI scan, which is essential to critically ill patients who cannot be removed from their vital medications and children and infants who must generally be sedated to remain immobile during an MRI scan.
Our 3880 MRI-compatible patient vital signs monitoring system has been designed with non-magnetic components and other special features to safely and accurately monitor a patient’s vital signs during various MRI procedures. The Iradimed 3880 system operates dependably in magnetic fields up to 30,000 gauss, which means it can operate virtually anywhere in the MRI scanner room. The Iradimed 3880 has a compact, lightweight design, allowing it to travel with the patient from the critical care unit to the MRI and back, resulting in increased patient safety through uninterrupted vital signs monitoring and decreasing the amount of time critically ill patients are away from critical care units. The features of the Iradimed 3880 include wireless ECG with dynamic gradient filtering; wireless SpO2 using Masimo® algorithms; non-magnetic respiratory CO2; invasive and non-invasive blood pressure; patient temperature, and optional advanced multi-gas anesthetic agent unit featuring continuous Minimum Alveolar Concentration measurements. The Iradimed 3880 MRI-compatible patient vital signs monitoring system has an easy-to-use design and allows for the effective communication of patient vital signs information to clinicians.
For more information, please visit www.iradimed.com
.
Forward-Looking Statements
This release and any oral statements made regarding the subject of this release contain forward-looking statements as defined under Section 27A of the Securities Act of 1933, as amended, and Section 21E of the Securities Exchange Act of 1934, as amended. All statements, other than statements of historical facts, that address activities that the Company assumes, plans, expects, believes, intends, projects, indicates, estimates or anticipates (and other similar expressions) will, should or may occur in the future are forward-looking statements, including statements relating to financial guidance, future quarterly cash dividends, operational issues meeting accelerated demand in the New Facility, commercialization, timing and expected revenue ramping of our next-generation 3870 MRI-compatible IV infusion pump, and the Company’s strategic plans, objectives, and intentions. The forward-looking statements are based on management’s current belief, based on currently available information, as to the outcome and timing of future events.
The forward-looking statements involve risks and uncertainties, including, among others, that our business plans may change as circumstances warrant.
Readers are cautioned not to place undue reliance on forward-looking statements, which speak only as of the date that they are made, which reflect management’s current estimates, projections, expectations, or beliefs, and which involverisks and uncertainties that could cause actual results and outcomes to be materially different. Risks and uncertainties that may affect the future results of the Company include, but are not limited to: our ability to receive 510(k) clearance for our products and product candidates, complete inspections conducted by the U.S. Food & Drug Administration (the “FDA”) or other regulatory bodies resulting in favorable outcomes, additional actions by or requests from the FDA, including a request to cease domestic distribution of products, or other regulatory bodies and unanticipated costs or delays associated with the resolution of these matters; the timing and likelihood of regulatory approvals or clearances from the FDA or other regulatory bodies and regulatory actions on our product candidates and product marketing activities; unexpected costs, expenses and diversion of management attention resulting from actions or requests posed to us by the FDA or other regulatory bodies; failure to obtain and/or maintain regulatory approvals or clearances and comply with applicable regulations; our primary reliance on a limited number of products; our ability to retain the continued service of our key professionals, including key management, marketing and scientific personnel, and to identify, hire and retain such additional qualified professionals; our expectations regarding the sales and marketing of our products, product candidates and services; our expectations regarding the integrity of our supply chain for our products; the potential for adverse application of environmental, health and safety and other laws and regulations of any jurisdiction on our operations; our expectations for market acceptance of our new products; the potential for our marketed products to be withdrawn due to recalls, patient adverse events or deaths; our ability to successfully prepare, file, prosecute, maintain, defend, including in cases of infringement, and enforce patent claims and other intellectual property rights on our products; our ability to identify and pursue development of additional products; the implementation of our business strategies; the potential for exposure to product liability claims; our financial performance expectations and interpretations thereof by securities analysts and investors; our ability to compete in the development and marketing of our products and product candidates with existing companies and new market entrants in our industry; difficulties or delays in the development, production, manufacturing and marketing of new or existing products and services, including difficulties or delays associated with obtaining requisite regulatory approvals or clearances associated with those activities; changes in laws and regulations or in the interpretation or application of laws or regulations, as well as possible failures to comply with applicable laws or regulations as a result of possible misinterpretations or misapplications; cost-containment efforts of our customers, purchasing groups, third-party payers and governmental organizations; costs associated with protecting our trade secrets and enforcing our patent, copyright and trademark rights, and successful challenges to the validity of our patents, copyrights or trademarks; actions of regulatory bodies and other government authorities, including the FDA and foreign counterparts, that could delay, limit or suspend product development, manufacturing or sales or result in recalls, seizures, consent decrees, injunctions and monetary sanctions; costs or claims resulting from potential errors or defects in our manufacturing that may injure persons or damage property or operations, including costs from remediation efforts or recalls; the results, consequences, effects or timing of any commercial disputes, patent infringement claims or other legal proceedings or any government investigations; changes in our production capacity, including interruptions in our ability to manufacture our products or an inability to obtain key components or raw materials or increased costs in such key components or raw materials; the failure of third parties to uphold their contractual duties or meet expected deadlines; uncertainties in our industry due to the effects of government-driven or mandated healthcare reform; competitive pressures in the markets in which we operate; potential negative impacts resulting from a future pandemic or epidemic, or natural disaster; the impact on our operations and financial results of any public health emergency and any related policies and actions by governments or other third parties; breaches or failures of our or our vendors’ or customers’ information technology systems or products, including by cyber-attack, data leakage, unauthorized access or theft; the loss of, or default by, one or more key customers or suppliers; unfavorable changes to the terms of key customer or supplier relationships; weakening of economic conditions, or the anticipation thereof, that could adversely affect the level of demand for our products; the conditions in the U.S. and global economies, including the impact of increasing and/or fluctuating tax and interest rates as well as inflationary pressures on such economies; geopolitical risks, including tariffs, trade disputes, international conflicts and recent or upcoming elections in the United States and other countries, and the impact of insufficient governmental funding and related operational inefficiencies, which could, among other things, lead to increased volatility in the financial market and in the market in which we operate our business; and other risks detailed in our filings with the United States Securities and Exchange Commission (the “SEC”).
Such forward-looking statements are subject to known and unknown risks, uncertainties, assumptions and other important factors, many of which are outside of the Company’s control that could cause actual results to differ materially from the results discussed in the forward-looking statements. These risks, uncertainties, assumptions and other important factors include, but are not limited to, those included in Part II, Item 1A, “Risk Factors” of the Company’s Quarterly Reports on Form 10-Q, and Part I, Item 1A, “Risk Factors” of the Company’s Annual Report on Form 10-K for the year ended December 31, 2024, as well as those otherwise described or updated from time to time in our other filings with the SEC. You are cautioned not to place undue reliance upon any forward-looking statements, which speak only as of the date made, and the Company undertakes no commitment to update or revise the forward-looking statements, whether as a result of new information, future events or otherwise.