Download as PDF August 05, 2026 7:00am EDT Related Documents Webcast Earnings Webcast Earnings Call Presentation PDF Launched Perciz brand to serve the defense and homeland security market; six partnership announcements in the past three months…
Download as PDF August 05, 2026 7:00am EDT
Related Documents
Webcast
Earnings Webcast
Earnings Call Presentation
PDF
-
Launched Perciz brand to serve the defense and homeland security market; six partnership announcements in the past three months across counter-UAS and perimeter security applications
-
Received first multimillion-dollar orders from a defense customer; perimeter security solutions installed and fully operational in multiple locations
-
Announced the development of a LiDAR-based perception stack with a top 10 global OEM; automotive customer programs with VW, Mobileye, and Daimler Truck on track to SOP
-
Record revenue of $18.1 million in Q2; FY 2026 revenue outlook unchanged at $67–$73 million
-
Appointed Maj. Gen. (Ret.) Yoav Har-Even, former President and CEO of Rafael Advanced Defense Systems, to the Board of Directors to support efforts in defense and security
TEL AVIV, Israel, Aug. 5, 2026 /PRNewswire/ -- Innoviz Technologies Ltd. (NASDAQ: INVZ) (the "Company", "we", or "Innoviz"), a leading supplier of high performance, automotive-grade LiDAR sensor platforms for the automotive, security, defense and industrial markets, today provided commercial and strategic updates on its business, reported its financial results for the quarter ended June 30, 2026, and reiterated its financial and operational targets for 2026.

"In recent months Innoviz began its expansion into the defense and homeland security markets, which we believe have the potential to be a significant driver of long-term growth," said Omer Keilaf, CEO and Founder of Innoviz. "For the past decade, we developed and built our LiDARs to meet the toughest bar in the auto industry, meeting functional safety requirements and achieving automotive qualification. Now, our precise, robust, automotive-grade sensors are starting to be adopted in the defense and security markets across applications such as counter-UAS and perimeter protection. As governments around the world allocate billions of dollars to address new threats, our newly launched dedicated defense and security brand, Perciz, aims to meet today's urgent needs. In the past three months, we have added six collaborations spanning a variety of use cases, and systems with our sensors have already been deployed in several locations, serving as potentially life-saving defenses. We are in conversations with dozens of prospective customers, and on July 30, we received our first multimillion-dollar orders from a defense customer totaling approximately $3.5 million. We believe this early traction, combined with our execution experience in the automotive market, positions us to pursue what we see as a significant opportunity in defense. In addition, in the automotive space, our partnerships with VW, Mobileye, Daimler Truck, and others are on track, and we recently announced the development of a LiDAR-based perception stack with a top 10 global OEM. We believe the combination of the automotive market and the defense and security markets has the potential to create a flywheel effect, and over time may support stronger growth and improved financial performance as we work to become a premier worldwide supplier of best-in-class LiDAR solutions."
Commercial and Strategic Updates
-
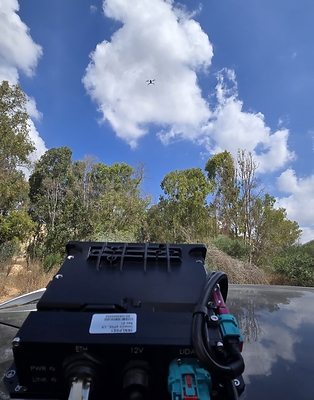
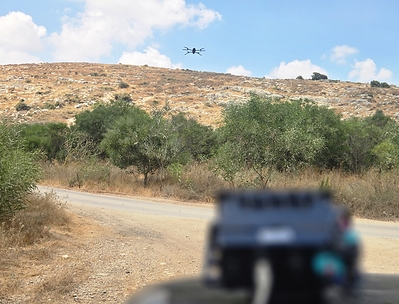
Launched Perciz– Perciz, Innoviz's new dedicated brand for the defense and homeland security markets, utilizes the Company's commercially available LiDAR sensors and brings the Company's expertise in centimeter-level 3D sensing, AI, and machine intelligence to counter-UAS, perimeter security, and situational awareness applications.
-
Six New Engagements in Defense and Security– Kela, Drive Group, Regulus, Givon Defense, Cogniteam, and AeroNous each announced engagements with Innoviz in the past three months across counter-UAS and perimeter security applications.
-
Received First Large Defense Orders – On July 30, we received initial defense orders for $3.5 million from a major defense customer for several hundred LiDAR units, with the potential for additional units upon the successful completion of the first deployment.
-
Appointed Yoav Har-Even to the Board of Directors – The appointment of Maj. Gen. (Ret.) Yoav Har-Even, the former President and CEO of Rafael Advanced Defense Systems, is expected to advance Innoviz's growing momentum in defense and security markets.
-
Automotive Programs Progressing– The VW ID. Buzz, based on the Mobileye Drive platform featuring nine LiDARs, is being tested in LA, Orlando, Austin, Munich, Hamburg, and Oslo; Mobileye's new robotaxi business on the Drive platform represents a potential opportunity of approximately 150,000 LiDAR units incremental to Innoviz's existing programs with Mobileye, VW, Daimler Truck, and others.
-
Announced Development of LiDAR-Based Perception Stack with Top 10 Global OEM – Under the terms of the engagement, Innoviz will develop and validate a LiDAR-based perception stack including Innoviz's LiDAR sensor and perception capabilities powered by NVIDIA hardware.
Q2 2026 Financial Results
Revenues in Q2 2026 were a record $18.1 million compared to revenues of $9.7 million in Q2 2025. The revenues resulted from a combination of NRE services and sales of LiDAR units.
Operating expenses in Q2 2026 were $19.1 million, an increase of 3% compared to operating expenses of $18.5 million in Q2 2025.
Liquidity as of June 30, 2026 was approximately $48.5 million, consisting of cash and cash equivalents, short-term deposits, marketable securities, and short-term restricted cash. Such amount does not reflect the gross proceeds of approximately $30 million for the Company's registered direct offering, which closed on July 29, 2026.
FY 2026 Financial and Operational TargetsThe Company is reiterating its FY 2026 targets of:
-
Revenues of $67-$73 million;
-
2-3 new program wins;
-
LiDAR sales for non-automotive Physical AI applications up to 10% of revenue; and
-
New NRE payment plans of $20-$30 million.
Conference Call
Innoviz management will hold a web conference today, August 5, 2026, at 9:00 a.m. Eastern Time (6:00 a.m. Pacific Time) to discuss commercial and strategic updates, financial results for Q2 2026, and financial and operational targets. Innoviz CEO Omer Keilaf and CFO Eldar Cegla will host the call, followed by a question-and-answer session.
Investors are invited to attend by registering in advance here. All relevant information will be sent upon registration.
A replay of the web conference will also be available shortly after the call in the Investors section of Innoviz's website for 90 days.
About Innoviz
Innoviz is a leading provider of LiDAR technology, serving as a Tier-1 supplier to the world's leading automotive manufacturers while extending its existing sensing solutions into defense, homeland security, industrial, and smart infrastructure markets.
Innoviz's LiDAR sensors and complementary software suite are designed to deliver exceptional range, resolution, and reliability, providing accurate 3D sensing even in harsh weather conditions. Built to meet the automotive industry's strict standards for performance and safety, Innoviz's sensors are increasingly supplied for applications that demand precise, real-time spatial awareness and continuous object localization.
Operating across the U.S., Europe, and Asia, Innoviz designs solutions for automotive OEMs, system integrators, municipalities, commercial enterprises, government organizations, and other customers worldwide. Under the Perciz brand, Innoviz offers its existing automotive-grade LiDAR sensors for defense, counter-UAS, perimeter intrusion detection, and homeland security applications. For more information, visit innoviz.tech.
Join the discussion: Facebook, LinkedIn, YouTube, X
Media Contact
[email protected]
Investor Contact
[email protected]
Forward Looking Statements
This announcement contains certain forward-looking statements within the meaning of the federal securities laws, including statements regarding the services and products offered by Innoviz, the anticipated technological capability of Innoviz's products, the markets in which Innoviz operates, and the Company's ability to successfully enter and compete in the defense and homeland security markets, expected NRE payments, the anticipated scaling of production and/or the potential volume of product units under third-party platform programs, and Innoviz's projected future operational and financial results, including revenue and NREs and the potential for synergies between the Company's automotive and defense market activities. These forward-looking statements generally are identified by the words "believe," "project," "expect," "anticipate," "estimate," "intend," "strategy," "future," "opportunity," "plan," "potential", "may," "should," "will," "would," "will be," "will continue," "will likely result," and similar expressions. Forward-looking statements are predictions, projections and other statements about future events that are based on current expectations and assumptions and, as a result, are subject to risks and uncertainties.
"NRE (Non-Recurring Engineering)" is booked services that may be ordered from Innoviz usually as part of a program design win and includes, among other things, application engineering, product adaptation services, testing and validation services, standards and qualification work and change requests (usually during the lifetime of a program). NREs may be paid based on milestones over the development phase of the project which may take a few years.
Many factors could cause actual future events, and, in the case of our forward-looking revenues and NRE bookings, actual orders or actual payments, to differ materially from the forward-looking statements in this announcement, including but not limited to, the ability to implement business plans, forecasts, and other expectations, the ability to convert design wins into definitive orders and the magnitude of such orders, the ability to achieve broader market adoption of Innoviz's products and solutions, the ability to maintain and scale initial deployments and evaluations into long-term commercial relationships, the risk that initial purchase orders do not convert into anticipated volumes and that results depend on the success of third party integrators and partners, the risks associated with the defense and homeland security market, including procurement cycles, budgetary constraints and regulatory and export control considerations, the early stage of the Company's defense and security business; the dependency on third-party platform decisions, regulatory approvals, and market conditions with respect to projected product volumes under programs; the risk that anticipated synergies between the automotive and defense markets may not materialize or that these markets have different sales cycles, regulatory regimes, and margin profiles, the ability of preliminary arrangements, including evaluation engagements and letters of intent, to result in definitive supply, development, or commercial agreements on expected terms and volumes, the possibility that NRE would be set off against liabilities and indemnities, the ability to identify and realize additional opportunities, potential changes and developments in the highly competitive LiDAR technology and related industries, and our expectations regarding the impact of geopolitical developments in the Middle East including the evolving conflict in Israel on our ongoing operations. The foregoing list is not exhaustive. You should carefully consider such risk and the other risks and uncertainties described in Innoviz's annual report on Form 20-F for the year ended December 31, 2025, filed with the U.S. Securities and Exchange Commission ("SEC") on March 4, 2026, and in other documents filed by Innoviz from time to time with the SEC. These filings identify and address other important risks and uncertainties that could cause actual events and results to differ materially from those contained in the forward-looking statements. The agreements and letters of intent referenced in this announcement are subject to various conditions, including, in certain cases, successful completion of evaluation phases, negotiation of definitive terms, and customer election to proceed. There can be no assurances that any such arrangement will result in definitive agreements, firm orders, payments, or series production, or that volumes, timing, or commercial terms will align with current expectations. Forward-looking statements speak only as of the date they are made. Readers are cautioned not to put undue reliance on forward-looking statements, and Innoviz assumes no obligation and does not intend to update or revise these forward-looking statements, whether as a result of new information, future events, or otherwise. Innoviz gives no assurance that it will achieve its expectations.
| INNOVIZ TECHNOLOGIES LTD. AND ITS SUBSIDIARIES CONSOLIDATED STATEMENTS OF OPERATIONS |
| U.S. dollars in thousands (except share and per share data) (Unaudited) |
| | | Six Months Ended June 30, | | Three Months Ended June 30, |
| | | 2026 | | 2025 | | 2026 | | 2025 |
| | | | | | | | | |
| Revenues | $ | 25,217 | $ | 27,137 | $ | 18,084 | $ | 9,747 |
| Cost of revenues | | (26,103) | | (18,595) | | (17,387) | | (8,187) |
| | | | | | | | | |
| Gross profit (loss) | | (886) | | 8,542 | | 697 | | 1,560 |
| | | | | | | | | |
| Operating expenses: | | | | | | | | |
| Research and development | | 28,458 | | 27,982 | | 11,701 | | 13,152 |
| Sales and marketing | | 4,096 | | 2,891 | | 1,821 | | 1,170 |
| General and administrative | | 11,453 | | 8,676 | | 5,596 | | 4,221 |
| | | | | | | | | |
| Total operating expenses | | 44,007 | | 39,549 | | 19,118 | | 18,543 |
| | | | | | | | | |
| Operating loss | | (44,893) | | (31,007) | | (18,421) | | (16,983) |
| | | | | | | | | |
| Financial income (expense), net | | 239 | | (29) | | (69) | | (1,445) |
| | | | | | | | | |
| Loss before taxes on income | | (44,654) | | (31,036) | | (18,490) | | (18,428) |
| Taxes on income | | (72) | | (85) | | (37) | | (51) |
| | | | | | | | | |
| Net loss | $ | (44,726) | $ | (31,121) | $ | (18,527) | $ | (18,479) |
| | | | | | | | | |
| Basic and diluted net loss per ordinary share | $ | (0.20) | $ | (0.16) | $ | (0.08) | $ | (0.09) |
| | | | | | | | | |
| Weighted average number of ordinary shares used in computing basic and diluted net loss per ordinary share | | 220,012,806 | | 192,642,299 | | 224,595,329 | | 200,079,493 |
| | | | | | | | | |
| INNOVIZ TECHNOLOGIES LTD. AND ITS SUBSIDIARIES****CONSOLIDATED BALANCE SHEETS | |
| U.S. dollars in thousands**(Unaudited)** | |
| | | June 30, | | December 31, | |
| | | 2026 | | 2025 | |
| ASSETS | | | | | |
| CURRENT ASSETS: | | | | | |
| Cash and cash equivalents | $ | 25,725 | $ | 8,638 | |
| Short-term restricted cash | | 16 | | 16 | |
| Bank deposits | | 13,085 | | 54,010 | |
| Marketable securities | | 9,628 | | 9,466 | |
| Trade receivables, net | | 13,782 | | 9,978 | |
| Inventory | | 5,361 | | 3,344 | |
| Prepaid expenses and other current assets | | 4,816 | | 4,780 | |
| Total current assets | | 72,413 | | 90,232 | |
| | | | | | |
| LONG-TERM ASSETS: | | | | | |
| Restricted deposits | | 3,336 | | 3,189 | |
| Property and equipment, net | | 19,641 | | 19,856 | |
| Operating lease right-of-use assets, net | | 23,746 | | 25,086 | |
| Other long-term assets | | 608 | | 89 | |
| Total long-term assets | | 47,331 | | 48,220 | |
| Total assets | $ | 119,744 | $ | 138,452 | |
| | | | | | |
| | | | | | |
| LIABILITIES AND SHAREHOLDERS' EQUITY | | | | | |
| CURRENT LIABILITIES: | | | | | |
| Trade payables | $ | 14,816 | $ | 8,599 | |
| Deferred revenues | | 3,022 | | 1,852 | |
| Employees and payroll accruals | | 11,327 | | 9,027 | |
| Accrued expenses and other current liabilities | | 6,247 | | 5,998 | |
| Operating lease liabilities | | 6,407 | | 5,949 | |
| Total current liabilities | | 41,819 | | 31,425 | |
| | | | | | |
| LONG-TERM LIABILITIES: | | | | | |
| Operating lease liabilities | | 29,225 | | 29,302 | |
| Warrants liability | | - | | 7 | |
| Total long-term liabilities | | 29,225 | | 29,309 | |
| | | | | | |
| SHAREHOLDERS' EQUITY: | | | | | |
| Ordinary Shares of no-par value | | - | | - | |
| Additional paid-in capital | | 891,266 | | 875,558 | |
| Accumulated deficit | | (842,566) | | (797,840) | |
| Total shareholders' equity | | 48,700 | | 77,718 | |
| Total liabilities and shareholders' equity | $ | 119,744 | $ | 138,452 | |
| | | | | | |
| INNOVIZ TECHNOLOGIES LTD. AND ITS SUBSIDIARIES CONSOLIDATED STATEMENTS OF CASH FLOWS |
| U.S. dollars in thousands (Unaudited) |
| |
| | | Six Months Ended June 30, | | Three Months Ended****June 30, |
| | | 2026 | | 2025 | | 2026 | | 2025 |
| Cash flows from operating activities: | | | | | | | | |
| Net loss | $ | (44,726) | $ | (31,121) | $ | (18,527) | $ | (18,479) |
| Adjustments required to reconcile net loss to net cash used in operating activities: | | | | | | | | |
| Depreciation and amortization | | 2,580 | | 2,715 | | 1,253 | | 1,338 |
| Remeasurement of warrants liability | | (7) | | (30) | | (1) | | 18 |
| Change in accrued interest on bank deposits | | 827 | | (654) | | 342 | | (317) |
| Change in marketable securities | | (16) | | (91) | | (10) | | (29) |
| Share-based compensation | | 7,678 | | 7,907 | | 3,966 | | 3,153 |
| Capital gain, net | | (8) | | - | | (4) | | - |
| Foreign exchange gain, net | | (198) | | (1,283) | | (247) | | (1,437) |
| Change in prepaid expenses and other assets | | (545) | | (131) | | 155 | | (2,260) |
| Change in trade receivables, net | | (3,804) | | (5,580) | | (8,486) | | 6,038 |
| Change in inventory | | (2,017) | | 383 | | (1,481) | | 182 |
| Change in operating lease assets and liabilities, net | | 1,721 | | 2,391 | | 1,766 | | 3,103 |
| Change in trade payables | | 6,187 | | (4,564) | | 4,321 | | (987) |
| Change in accrued expenses and other liabilities | | 43 | | 1,049 | | 437 | | 526 |
| Change in employees and payroll accruals | | 2,300 | | 776 | | 1,157 | | 622 |
| Change in deferred revenues | | 1,170 | | 3,175 | | 995 | | 2,231 |
| Net cash used in operating activities | | (28,815) | | (25,058) | | (14,364) | | (6,298) |
| Cash flows from investing activities: | | | | | | | | |
| Purchase of property and equipment | | (2,218) | | (2,924) | | (862) | | (1,009) |
| Proceeds from sales of property and equipment | | 4 | | 3 | | - | | 3 |
| Investment in bank deposits | | (19,930) | | (58,700) | | - | | (14,400) |
| Withdrawal of bank deposits | | 60,100 | | 33,450 | | 32,750 | | 20,950 |
| Investment in marketable securities | | (9,689) | | (22,931) | | (4,308) | | (8,039) |
| Proceeds from sales and maturities of marketable securities | | 9,543 | | 25,707 | | 4,230 | | 7,970 |
| Net cash provided by (used in) investing activities | | 37,810 | | (25,395) | | 31,810 | | 5,475 |
| Cash flows from financing activities: | | | | | | | | |
| Issuance of ordinary shares and warrants, net of issuance costs | | - | | 37,289 | | - | | (307) |
| Issuance of ordinary shares, net of paid issuance costs | | 8,070 | | - | | 3,839 | | - |
| Proceeds from exercise of options | | 43 | | 265 | | 25 | | 123 |
| Net cash provided by (used in) financing activities | | 8,113 | | 37,554 | | 3,864 | | (184) |
| Effect of exchange rate changes on cash, cash equivalents and restricted cash | | (21) | | 1,069 | | 53 | | 1,173 |
| Increase (decrease) in cash, cash equivalents and restricted cash | | 17,087 | | (11,830) | | 21,363 | | 166 |
| Cash, cash equivalents and restricted cash at the beginning of the period | | 8,654 | | 25,381 | | 4,378 | | 13,385 |
| Cash, cash equivalents and restricted cash at the end of the period | $ | 25,741 | $ | 13,551 | $ | 25,741 | $ | 13,551 |
| Share-based compensation expenses: |
| |
| | | Six Months Ended June 30, | | Three Months Ended June 30, |
| | | 2026 | | 2025 | | 2026 | | 2025 |
| | | | | | | | | |
| Cost of revenues | $ | 1,917 | $ | 2,609 | $ | 1,435 | $ | 835 |
| Research and development | | 2,459 | | 3,255 | | 937 | | 1,367 |
| Sales and marketing | | 436 | | 372 | | 176 | | 165 |
| General and administrative | | 2,866 | | 1,671 | | 1,418 | | 786 |
| | | | | | | | | |
| | $ | 7,678 | $ | 7,907 | $ | 3,966 | $ | 3,153 |
Logo - https://mma.prnewswire.com/media/1496323/Innoviz_Technologies_Logo.jpg
 View original content:https://www.prnewswire.com/news-releases/innoviz-reports-second-quarter-2026-results-302843599.html
SOURCE Innoviz Technologies
Released August 5, 2026



 View original content to download multimedia:

 View original content to download multimedia:


 View original content to download multimedia:

 View original content to download multimedia:
 View original content: