November 5, 2026
-
Delivers Revenue of $70.2M, exceeding midpoint of the outlook, and core business revenue up 14% sequentially to $40.7M
-
Guides Q4 2026 Y-o-Y revenue growth to 33% with core revenue up 64% at the midpoint
-
Radar chipset selected by one of the top three North American OEMs
ALISO VIEJO, Calif.--(BUSINESS WIRE)-- indie Semiconductor, Inc. (Nasdaq: INDI), a Physical AI and automotive market leader with the industry’s broadest multi-modal sensor portfolio, today announced third quarter results for the period ended September 30, 2026. Q3 revenue was $70.2 million, up 31 percent year over year. On a GAAP basis operating loss for the third quarter of 2026 was $39.0 million, compared to $38.3 million a year ago. Non-GAAP operating loss for the third quarter of 2026 was $7.2 million, compared to $11.3 million a year ago, representing continued significant progress towards achieving profitability. Third quarter 2026 GAAP loss per share was $0.18, while Non-GAAP loss per share was $0.05.
“We reported strong third quarter results, with revenue up 31 percent year-over-year, ahead of our outlook, and our non-GAAP operating loss narrowed by more than a third,” said Donald McClymont, indie’s co-founder and chief executive officer. “Our radar chipset, in high-volume production, has been selected by one of the top three North American OEMs, our sensing and perception portfolio is expanding rapidly into Physical AI, and with our fourth quarter outlook implying approximately 33 percent year-over-year growth, indie is very well positioned for the future.”
Business Highlights
- Secured 40+ vision design wins YTD in 2026, including Physical AI (humanoid robots, drones)
- Won eMirror and side-view mirror designs at major Indian and Korean OEMs
- Won emotion3D in-cabin software program for an Australian-market vehicle with production starting in 2027
- Delivered record quantum revenue and bookings, including largest CV-QKD order and two integrated laser NRE contracts
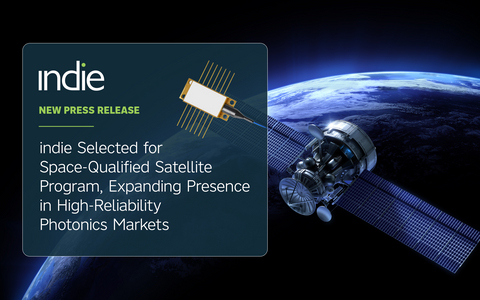
- Photonic SLED products selected for CHIME satellite space program
- Named “In-Cabin Solution of the Year” by AutoTech Breakthrough for our combined SoC and perception software solution
Q4 2026 Outlook
We provide guidance on a non-GAAP basis only because certain information necessary to reconcile such results and guidance to GAAP is difficult to estimate and dependent on future events outside of our control and, therefore, is not available without unreasonable efforts. Please refer to the header captioned “Discussion Regarding the Use of Non-GAAP Financial Measures” in this release for a further discussion of our use of non-GAAP measures.
For the fourth quarter of 2026, indie expects revenue to be between $73 million and $81 million. At the midpoint of this outlook, the Company anticipates approximately 33 percent year-over-year growth with approximately $47 million from the core business and $30 million from Wuxi indie Micro.
indie’s Q3 2026 Conference Call
indie Semiconductor will host a conference call with analysts to discuss its third quarter 2026 results and business outlook today at 5:00 p.m. Eastern time.
To listen to the conference call via the Internet, please go to the Financials tab on the Investors page of indie’s website. To listen to the conference call via telephone, please call (877) 451-6152 (domestic) or (201) 389-0879 (international).
A replay of the conference call will be available beginning at 9:00 p.m. Eastern time on November 5, 2026, until 11:59 p.m. Eastern time on November 19, 2026, under the Financials tab on the Investors page of indie’s website, or by calling (844) 512-2921 (domestic) or (412) 317-6671 (international), Access ID: 13762494.
About indie
Headquartered in Aliso Viejo, CA, indie is a leader in Physical AI and automotive, offering the industry’s broadest multi-modal sensor portfolio spanning radar, computer vision, LiDAR, and ultrasonic technologies. Through high-performance, highly integrated semiconductors, photonics, system solutions, and perception software, indie enables perception, understanding, and interaction with the physical world. Our platforms power advanced safety, automation, and positioning capabilities for leading automotive OEMs, intelligent machines, and emerging AI-driven systems, including quantum applications, worldwide.
Please visit us at www.indie.inc to learn more.
#indieSemi_earnings
Safe Harbor Statement
This communication contains “forward-looking statements” (including within the meaning of Section 21E of the United States Securities Exchange Act of 1934, as amended, and Section 27A of the Securities Act of 1933, as amended). Such statements can be identified by words such as “will likely result,” “expect,” “anticipate,” “estimate,” “believe,” “intend,” “plan,” “project,” “outlook,” “should,” “could,” “may” or words of similar meaning and include, but are not limited to, projected financial information, statements regarding our future revenue, future business and financial performance and prospects, including statements regarding our fourth quarter 2026 outlook, our product portfolio expansion, including into Physical AI, and our positioning for future growth. Such forward-looking statements are based upon the current beliefs and expectations of our management and are inherently subject to significant business, economic and competitive uncertainties and contingencies, many of which are difficult to predict and generally beyond our control. Actual results and the timing of events may differ materially from the results included in such forward-looking statements. In addition to the factors previously disclosed in our Annual Report on Form 10-K for the fiscal year ended December 31, 2025 filed with the SEC on February 27, 2026, as supplemented by our Quarterly Reports on Form 10-Q and in our other public reports filed with the SEC (including those identified under “Risk Factors” therein), the following factors, among others, could cause actual results and the timing of events to differ materially from the anticipated results or other expectations expressed in the forward-looking statements: macroeconomic conditions, including inflation, rising interest rates and volatility in the credit and financial markets, our reliance on contract manufacturing and outsourced supply chain and the availability of semiconductors and manufacturing capacity; competitive products and pricing pressures; our ability to win competitive bid selection processes and achieve additional design wins; the impact and completion of the pending sale of our entire equity interest in Wuxi indie Microelectronics Technology Co., Ltd., including the timing of regulatory approvals and closing, and any potential adverse effects of such sale on our business, financial condition, operating results and stock price; the impact of recent acquisitions made and any other acquisitions we may make, including the announced acquisition of the CMOS Imaging Sensor Business from ams-OSRAM AG and the ability to complete such acquisition; our ability to develop, market and gain acceptance for new and enhanced products and expand into new technologies and markets; current and potential trade restrictions and trade tensions, including trade and tariff actions taken or proposed by the US government affecting the countries where we operate; and political or economic instability in our target markets. All forward-looking statements in this press release are expressly qualified in their entirety by the foregoing cautionary statements.
Investors are cautioned not to place undue reliance on the forward-looking statements in this press release, which information set forth herein speaks only as of the date hereof. We do not undertake, and we expressly disclaim, any intention or obligation to update any forward-looking statements made in this announcement or in our other public filings, whether as a result of new information, future events or otherwise, except as required by law.
| INDIE SEMICONDUCTOR, INC. | ||||||||||||||||
| PRELIMINARY CONDENSED CONSOLIDATED STATEMENTS OF OPERATIONS | ||||||||||||||||
| (Amounts in thousands, except share and per share amounts) | ||||||||||||||||
| (Unaudited) | ||||||||||||||||
| Three Months Ended September 30, | Nine Months Ended September 30, | |||||||||||||||
| 2026 | 2025 | 2026 | 2025 | |||||||||||||
| Revenue: | ||||||||||||||||
| Product revenue | $ | 67,491 | $ | 51,073 | $ | 179,565 | $ | 151,213 | ||||||||
| Contract revenue | 2,750 | 2,603 | 10,142 | 8,174 | ||||||||||||
| Total revenue | 70,241 | 53,676 | 189,707 | 159,387 | ||||||||||||
| Operating expenses: | ||||||||||||||||
| Cost of goods sold | 47,874 | 32,173 | 123,176 | 94,394 | ||||||||||||
| Research and development | 40,347 | 37,987 | 116,684 | 118,574 | ||||||||||||
| Selling, general, and administrative | 21,017 | 20,816 | 62,795 | 58,538 | ||||||||||||
| Restructuring costs | — | 1,042 | — | 8,149 | ||||||||||||
| Total operating expenses | 109,238 | 92,018 | 302,655 | 279,655 | ||||||||||||
| Loss from operations | (38,997 | ) | (38,342 | ) | (112,948 | ) | (120,268 | ) | ||||||||
| Other income (expense), net: | ||||||||||||||||
| Interest income | 878 | 1,655 | 2,968 | 6,148 | ||||||||||||
| Interest expense | (4,721 | ) | (4,348 | ) | (13,752 | ) | (13,391 | ) | ||||||||
| Gain from change in fair value of contingent considerations and acquisition-related holdbacks | 4,320 | 6 | 3,047 | 4,899 | ||||||||||||
| Gain (loss) from extinguishment of debt | — | — | (3,656 | ) | 2,623 | |||||||||||
| Other income (expense) | (851 | ) | (28 | ) | (1,873 | ) | 764 | |||||||||
| Total other income (expense), net | (374 | ) | (2,715 | ) | (13,266 | ) | 1,043 | |||||||||
| Net loss before income taxes | (39,371 | ) | (41,057 | ) | (126,214 | ) | (119,225 | ) | ||||||||
| Income tax benefit (provision) | (535 | ) | 363 | 232 | (258 | ) | ||||||||||
| Net loss | (39,906 | ) | (40,694 | ) | (125,982 | ) | (119,483 | ) | ||||||||
| Less: Net loss attributable to noncontrolling interest | (1,123 | ) | (2,405 | ) | (6,932 | ) | (7,610 | ) | ||||||||
| Net loss attributable to indie Semiconductor, Inc. | $ | (38,783 | ) | $ | (38,289 | ) | $ | (119,050 | ) | $ | (111,873 | ) | ||||
| Net loss attributable to common shares — basic | $ | (38,783 | ) | $ | (38,289 | ) | $ | (119,050 | ) | $ | (111,873 | ) | ||||
| Net loss attributable to common shares — diluted | $ | (38,783 | ) | $ | (38,289 | ) | $ | (119,050 | ) | $ | (111,873 | ) | ||||
| Net loss per share attributable to common shares — basic | $ | (0.18 | ) | $ | (0.19 | ) | $ | (0.56 | ) | $ | (0.57 | ) | ||||
| Net loss per share attributable to common shares — diluted | $ | (0.18 | ) | $ | (0.19 | ) | $ | (0.56 | ) | $ | (0.57 | ) | ||||
| Weighted average common shares outstanding — basic | 219,304,478 | 199,326,145 | 212,825,421 | 195,286,712 | ||||||||||||
| Weighted average common shares outstanding — diluted | 219,304,478 | 199,326,145 | 212,825,421 | 195,286,712 |
| INDIE SEMICONDUCTOR, INC. | ||||||||
| PRELIMINARY CONDENSED CONSOLIDATED BALANCE SHEETS | ||||||||
| (Amounts in thousands) | ||||||||
| (Unaudited) | ||||||||
| September 30, 2026 | December 31, 2025 | |||||||
| Assets | ||||||||
| Current assets: | ||||||||
| Cash and cash equivalents | $ | 134,249 | $ | 145,456 | ||||
| Restricted cash | 10,023 | 10,285 | ||||||
| Accounts receivable, net of allowance for doubtful accounts | 79,272 | 57,485 | ||||||
| Inventory | 80,039 | 48,618 | ||||||
| Prepaid expenses and other current assets | 27,369 | 23,924 | ||||||
| Total current assets | 330,952 | 285,768 | ||||||
| Property and equipment, net | 43,619 | 43,349 | ||||||
| Intangible assets, net | 170,639 | 195,908 | ||||||
| Goodwill | 282,642 | 292,644 | ||||||
| Operating lease right-of-use assets | 12,947 | 14,363 | ||||||
| Other assets and deposits | 8,262 | 8,754 | ||||||
| Total assets | $ | 849,061 | $ | 840,786 | ||||
| Liabilities and stockholders' equity | ||||||||
| Accounts payable | $ | 27,893 | $ | 21,832 | ||||
| Accrued payroll liabilities | 11,834 | 9,889 | ||||||
| Contingent considerations | — | 611 | ||||||
| Accrued expenses and other current liabilities | 29,331 | 24,772 | ||||||
| Intangible asset contract liability | 5,875 | 5,875 | ||||||
| Current debt obligations | 25,523 | 13,567 | ||||||
| Total current liabilities | 100,456 | 76,546 | ||||||
| Long-term debt, net of current portion | 404,475 | 339,834 | ||||||
| Intangible asset contract liability, net of current portion | 173 | 5,705 | ||||||
| Deferred tax liabilities, non-current | 14,661 | 14,198 | ||||||
| Operating lease liability, non-current | 10,875 | 13,046 | ||||||
| Other long-term liabilities | 1,664 | 7,444 | ||||||
| Total liabilities | 532,304 | 456,773 | ||||||
| Commitments and contingencies | ||||||||
| Stockholders' equity | ||||||||
| Preferred stock | — | — | ||||||
| Class A common stock | 23 | 20 | ||||||
| Class V common stock | 1 | 2 | ||||||
| Additional paid-in capital | 1,059,013 | 998,730 | ||||||
| Accumulated deficit | (756,160 | ) | (637,110 | ) | ||||
| Accumulated other comprehensive loss | (16,614 | ) | (3,611 | ) | ||||
| indie's stockholders' equity | 286,263 | 358,031 | ||||||
| Noncontrolling interest | 30,494 | 25,982 | ||||||
| Total stockholders' equity | 316,757 | 384,013 | ||||||
| Total liabilities and stockholders' equity | $ | 849,061 | $ | 840,786 |
**INDIE SEMICONDUCTOR, INC.
****RECONCILIATION OF PRELIMINARY NON-GAAP MEASURES TO GAAP
**(Unaudited)
GAAP refers to financial information presented in accordance with U.S. Generally Accepted Accounting Principles. This press release includes non-GAAP financial measures, as defined in Regulation G promulgated by the Securities and Exchange Commission. We believe that our presentation of non-GAAP financial measures provides useful supplementary information to investors. The presentation of non-GAAP financial measures is not meant to be considered in isolation from or as a substitute for results prepared in accordance with GAAP.
The reconciliations of our preliminary GAAP to non-GAAP measures are as follows (in thousands, except share and per share amounts):
| Three Months Ended September 30, | Nine Months Ended September 30, | |||||||||||||||
| 2026 | 2025 | 2026 | 2025 | |||||||||||||
| Computation of non-GAAP operating loss: | ||||||||||||||||
| GAAP loss from operations | $ | (38,997 | ) | $ | (38,342 | ) | $ | (112,948 | ) | $ | (120,268 | ) | ||||
| Acquisition related and other non-recurring professional expenses | 205 | 301 | 682 | 524 | ||||||||||||
| Amortization of intangible assets | 7,302 | 6,710 | 22,201 | 19,211 | ||||||||||||
| Share-based compensation | 24,294 | 18,985 | 62,776 | 51,486 | ||||||||||||
| Restructuring | — | 1,042 | — | 8,149 | ||||||||||||
| Non-GAAP operating loss | $ | (7,196 | ) | $ | (11,304 | ) | $ | (27,289 | ) | $ | (40,898 | ) |
| Three Months Ended September 30, | Nine Months Ended September 30, | |||||||||||||||
| 2026 | 2025 | 2026 | 2025 | |||||||||||||
| Computation of non-GAAP net loss: | ||||||||||||||||
| Net loss | $ | (39,906 | ) | $ | (40,694 | ) | $ | (125,982 | ) | $ | (119,483 | ) | ||||
| Acquisition related and other non-recurring professional expenses | 205 | 301 | 682 | 524 | ||||||||||||
| Amortization of intangible assets | 7,302 | 6,710 | 22,201 | 19,211 | ||||||||||||
| Share-based compensation | 24,294 | 18,985 | 62,776 | 51,486 | ||||||||||||
| Restructuring | — | 1,042 | — | 8,149 | ||||||||||||
| Gain from change in fair value of contingent considerations and acquisition-related holdbacks | (4,320 | ) | (6 | ) | (3,047 | ) | (4,899 | ) | ||||||||
| (Gain) loss from extinguishment of debt | — | — | 3,656 | (2,623 | ) | |||||||||||
| Other (income) expense | 851 | 28 | 1,873 | (764 | ) | |||||||||||
| Non-cash interest expense | 779 | 738 | 2,133 | 2,067 | ||||||||||||
| Income tax (benefit) expense | 535 | (363 | ) | (232 | ) | 258 | ||||||||||
| Non-GAAP net loss | $ | (10,260 | ) | $ | (13,259 | ) | $ | (35,940 | ) | $ | (46,074 | ) |
| Three Months Ended September 30, | Nine Months Ended September 30, | |||||||||||||||
| 2026 | 2025 | 2026 | 2025 | |||||||||||||
| Computation of Adjusted EBITDA: | ||||||||||||||||
| Net loss | $ | (39,906 | ) | $ | (40,694 | ) | $ | (125,982 | ) | $ | (119,483 | ) | ||||
| Interest income | (878 | ) | (1,655 | ) | (2,968 | ) | (6,148 | ) | ||||||||
| Interest expense | 4,721 | 4,348 | 13,752 | 13,391 | ||||||||||||
| Gain from change in fair value of contingent considerations and acquisition-related holdbacks | (4,320 | ) | (6 | ) | (3,047 | ) | (4,899 | ) | ||||||||
| (Gain) loss from extinguishment of debt | — | — | 3,656 | (2,623 | ) | |||||||||||
| Other (income) expense | 851 | 28 | 1,873 | (764 | ) | |||||||||||
| Acquisition related and other non-recurring professional expenses | 205 | 301 | 682 | 524 | ||||||||||||
| Depreciation and amortization | 9,880 | 8,903 | 29,489 | 25,385 | ||||||||||||
| Share-based compensation | 24,294 | 18,985 | 62,776 | 51,486 | ||||||||||||
| Restructuring | — | 1,042 | — | 8,149 | ||||||||||||
| Income tax (benefit) expense | 535 | (363 | ) | (232 | ) | 258 | ||||||||||
| Adjusted EBITDA | $ | (4,618 | ) | $ | (9,111 | ) | $ | (20,001 | ) | $ | (34,724 | ) |
| For the Three Months Ended September 30, 2026 | ||||
| Computation of non-GAAP share count: | ||||
| Weighted Average Class A common stock - Basic | 219,304,478 | |||
| Weighted Average Class V common stock - Basic | 13,681,420 | |||
| TeraXion Unexercised Options | 463,138 | |||
| Non-GAAP share count | 233,449,036 | |||
| Non-GAAP net loss | $ | (10,260 | ) | |
| Less: Non-GAAP net income attributable to noncontrolling interest in Wuxi | 1,304 | |||
| Non-GAAP net loss attributable to indie Semiconductor, Inc. | $ | (11,564 | ) | |
| Non-GAAP net loss per share attributable to indie Semiconductor, Inc. | $ | (0.05 | ) |
Discussion Regarding the Use of Non-GAAP Financial Measures
Our earnings release contains some or all of the following financial measures that have not been calculated in accordance with United States Generally Accepted Accounting Principles (“GAAP”): (i) non-GAAP operating loss, (ii) non-GAAP net loss, (iii) Adjusted EBITDA, (iv) non-GAAP share count and (v) non-GAAP net loss per share. As set forth in the tables above, we derive such non-GAAP financial measures by excluding certain expenses and other items from the respective GAAP financial measure that is most directly comparable to each non-GAAP financial measure. Management may use these non-GAAP financial measures to, amongst other things, evaluate operating performance and compare it against past periods or against peer companies, make operating decisions, forecast for future periods and to determine payments under compensation programs. These non-GAAP financial measures provide management with additional means to understand and evaluate the operating results and trends in our ongoing business by eliminating certain expenses and other items that management believes might otherwise make comparisons of our ongoing business with prior periods and competitors more difficult, obscure trends in ongoing operations or improve management’s ability to forecast future periods.
We provide investors with non-GAAP operating loss, non-GAAP net loss and non-GAAP net loss per share because we believe it is important for investors to be able to closely monitor and understand changes in our ability to generate income from ongoing business operations. We believe these non-GAAP financial measures give investors an additional method to evaluate historical operating performance and identify trends, an additional means of evaluating period-over-period operating performance and a method to facilitate certain comparisons of our operating results to those of our peer companies. We further believe these non-GAAP financial measures allow investors to assess the overall financial performance of our ongoing operations by eliminating the impact of (i) acquisition-related and other non-recurring professional expenses (including acquisition-related or other non-recurring professional fees and legal expenses, deemed compensation expense and expenses recognized in relation to changes in contingent consideration obligations), (ii) amortization of acquisition-related intangibles and certain license rights, (iii) restructuring costs, (iv) gains or losses recognized in relation to changes in the fair value of contingent considerations issued by indie, acquisition-related holdbacks and unrealized gains or losses from currency hedging contracts, (v) non-cash interest expenses related to the amortization of debt discounts and issuance costs, (vi) share-based compensation, and (vii) income tax benefit (provision). We believe that disclosing these non-GAAP financial measures contributes to enhanced financial reporting transparency and provides investors with added clarity about complex financial performance measures.
We do not report a GAAP measure of gross profit or gross margin because certain costs related to contract revenues are expensed as incurred and included in research and development expenses, and not in cost of sales, as it is not practicable for us to bifurcate these expenses. We calculate non-GAAP operating loss by excluding from GAAP operating loss, any (i) acquisition-related and other non-recurring professional expenses (including acquisition-related or other non-recurring professional fees and legal expenses, deemed compensation expense and expenses recognized in relation to changes in contingent consideration obligations), (ii) amortization of acquisition-related intangibles and certain license rights, (iii) restructuring costs and (iv) share-based compensation. We calculate non-GAAP net loss by excluding from GAAP net income (loss), any (i) acquisition-related and other non-recurring professional expenses (including acquisition-related or non-recurring professional fees and legal expenses, deemed compensation expense and expenses recognized in relation to changes in contingent consideration obligations), (ii) amortization of acquisition-related intangibles and certain license rights, (iii) restructuring costs, (iv) gains or losses recognized in relation to changes in the fair value of contingent considerations issued by indie, acquisition-related holdbacks and unrealized gains or losses from currency hedging contracts, (v) non-cash interest expenses related to the amortization of debt discounts and issuance costs, (vi) share-based compensation, and (vii) income tax benefit (provision). We calculate Adjusted EBITDA by excluding from GAAP net income (loss), any (i) acquisition-related and other non-recurring professional expenses (including acquisition-related or non-recurring professional fees and legal expenses, deemed compensation expense and expenses recognized in relation to changes in contingent consideration obligations), (ii) amortization of acquisition-related intangibles and certain license rights, (iii) depreciation of fixed assets, (iv) restructuring costs, (v) gains or losses recognized in relation to changes in the fair value of contingent considerations issued by indie, acquisition-related holdbacks and unrealized gains or losses from currency hedging contracts, (vi) non-cash interest expenses related to the amortization of debt discounts and issuance costs, (vii) share-based compensation, and (viii) income tax benefit (provision). We calculate non-GAAP share count by adding (i) weighted average Class A common stock, (ii) weighted average Class V common stock held by minority shareholders, which are exchangeable into Class A common stock and (iii) vested but unexercised options issued as part of the TeraXion acquisition. While both weighted average Class V common stock and vested but unexercised options issued as part of the TeraXion acquisition are considered anti-dilutive under ASC 260, therefore excluded from the GAAP earnings per share calculation, management includes both categories in this non-GAAP presentation because they will convert into Class A common stock over time. Management believes that including these categories provides investors with a more transparent view of the Company’s capital structure and potential impact of such conversions. Non-GAAP net loss per share is calculated by dividing non-GAAP net loss by non-GAAP share count.
We exclude the items identified above from the respective non-GAAP financial measure referenced above for the reasons set forth with respect to each such excluded item below:
Acquisition-related and other non-recurring professional expenses - including such items as, when applicable, fair value charges incurred upon the sale of acquired inventory, accounting impact to the cost of goods sold due to one-time inventory costing realignment with a specific supplier, acquisition-related professional fees and legal expenses and other professional fees that are non-recurring in nature because they are not considered by management in making operating decisions and we believe that such expenses do not have a direct correlation to our future business operations and thereby including such charges do not necessarily reflect the performance of our ongoing operations for the period in which such charges or reversals are incurred.
Amortization expenses - related to the amortization expense for acquired intangible assets and certain license rights.
Depreciation expenses - related to the depreciation expenses for all property and equipment on hand.
Share-based compensation - related to the non-cash compensation expense associated with equity awards granted to our employees (including those granted in lieu of cash compensation) and employer tax related to employee stock transactions. These expenses are not considered by management in making operating decisions and such expenses do not have a direct correlation to our future business operations.
Restructuring costs - related to the one-time expenses the Company incurs to reorganize its operations, which is primarily related to workforce reduction, long-lived intangible asset impairment, facilities and other purchase commitment charges.
Gain (loss) from change in fair values - because these adjustments (1) are not considered by management in making operating decisions, (2) are not directly controlled by management, (3) do not necessarily reflect the performance of our ongoing operations for the period in which such charges are recognized and (4) cannot make comparisons between peer company performance less reliable.
Non-cash interest expense - related to the amortization of debt discounts and issuance costs because (1) these expenses are not considered by management in making decision with respect to financing decisions, and (2) these generally reflect non-cash costs.
Income tax benefit (provision) - related to the estimated income tax benefit (provision) that does not result in a current period tax refunds (payments).
The non-GAAP financial measures presented should not be considered in isolation and are not an alternative for the respective GAAP financial measure that is most directly comparable to each such non-GAAP financial measure. Investors are cautioned against placing undue reliance on these non-GAAP financial measures and are urged to review and consider carefully the adjustments made by management to the most directly comparable GAAP financial measures to arrive at these non-GAAP financial measures. Non-GAAP financial measures may have limited value as analytical tools because they may exclude certain expenses that some investors consider important in evaluating our operating performance or ongoing business performance. Further, non-GAAP financial measures are likely to have limited value for purposes of drawing comparisons between companies as a result of different companies potentially calculating similarly titled non-GAAP financial measures in different ways because non-GAAP measures are not based on any comprehensive set of accounting rules or principles.
Adjusted EBITDA is calculated by removing non-recurring, irregular and one-time items that may distort EBITDA, to the current non-GAAP financial measures. We calculate Adjusted EBITDA by excluding from GAAP net income (loss), any (i) acquisition-related and other non-recurring expenses (including acquisition-related or other non-recurring professional fees and legal expenses, deemed compensation expense and expenses recognized in relation to changes in contingent consideration obligations), (ii) amortization of acquisition-related intangibles and certain license rights, (iii) depreciation of property, plant and equipment, (iv) restructuring costs, (v) gains or losses recognized in relation to changes in the fair value of contingent considerations issued by indie, acquisition-related holdbacks and unrealized gains or losses from currency hedging contracts, (vi) non-cash interest expenses related to the amortization of debt discounts and issuance costs, (vii) share-based compensation, and (viii) income tax benefit (provision).
To the extent our disclosures contain forward-looking estimates of non-GAAP financial measures, these measures are provided to investors on a prospective basis for the same reasons (set forth above) we provide them to investors on a historical basis. We are generally unable to provide a reconciliation of our forward-looking non-GAAP measures because certain information needed to make a reasonable forward-looking estimate of such non-GAAP measures are difficult to predict and estimate and is often dependent on future events that may be uncertain or outside of our control and, therefore, is not available without unreasonable efforts. Such events may include unanticipated changes in our GAAP effective tax rate, unanticipated one-time charges related to asset impairments (fixed assets, inventory, intangibles, or goodwill), unanticipated acquisition-related and other non-recurring professional expenses, unanticipated settlements, gains, losses and impairments and other unanticipated items not reflective of ongoing operations. Our forward-looking estimates of both GAAP and non-GAAP measures of our financial performance may differ materially from our actual results and should not be relied upon as statements of fact.
Media Inquiries
[email protected]
Investor Relations
[email protected]
Source: indie Semiconductor
Quick Links
IR Contact
[contact us by phone +1 949-418-8637](tel:+1 949-418-8637)
Investor Email Alerts


© 2026 indie Semiconductor - All rights reserved