Independent Bank Corp. — Current report on Form 8-K
Bull 0
Bear 0
Routine
|
Independent Bank Corp. is a bank holding company incorporated in 1985 that serves as the sole stockholder of Rockland Trust Company, a Massachusetts trust company chartered in 1907. The company operates a single reportable segment providing banking, investment, and financial services through a network of retail branches, commercial and residential lending centers, and investment management offices. Its primary market area includes Eastern Massachusetts, Worcester County, southern New Hampshire, and Rhode Island, where it serves small-to-upper middle market businesses and consumers. Key products include commercial real estate loans, commercial and industrial loans, consumer real estate loans, checking and savings accounts, and treasury management services. The company offers digital banking capabilities through mobile, online, and telephone channels. Notable subsidiaries include Bright Rock Capital Management LLC, a registered investment advisor, and Compass Exchange Advisors LLC, which provides like-kind exchange services. The company also sponsors several statutory trusts for issuing trust preferred securities and maintains subsidiaries for low-income housing tax credit investments and foreclosed property management. In July 2025, the company completed the acquisition of Enterprise Bancorp, Inc. Summarised from the company's own disclosures, fiscal year ended Feb 2026 |
Industry Banks - Regional | Homepage rocklandtrust.com |
| Sector Financial Services | IR page rocklandtrust.com/wealth-and-investments/insights | |
|
Tags
commercial real estate lending, consumer banking, treasury management, investment advisory, digital banking, business banking, mortgage lending, wealth management, Rockland Trust Company, Rockland Borrowing Collateral Securities Corp., Rockland Deposit Collateral Securities Corp., Taunton Avenue Securities Corp., Goddard Ave Securities Corp., MFLR Securities Corporation, B.H. Security Corporation, RTC LIHTC Investments LLC, Rockland MHEF Fund LLC, EBTC NMTC Investment Fund - CHC LLC, Rockland Trust Phoenix LLC, Bright Rock Capital Management LLC, Compass Exchange Advisors LLC, Independent Capital Trust V, Central Bancorp Capital Trust I, Central Bancorp Statutory Trust II, Enterprise Bancorp Inc., Elavon
|
Press page rocklandtrust.com/about-us/explore/news-and-media |
Metrics
| Valuation | |
|---|---|
| Market cap | $ 3.958B |
| Market cap (USD) | $ 3.958B |
| P/E | 12.51 |
| PEG | — |
| P/BV | 1.15 |
| P/S | 4.66 |
| P/OCF | 10.53 |
| P/FCF | 11.19 |
| Dividend yield | 3.0% |
| Turnover / mcap | — |
| Returns | |
|---|---|
| ROE | 6.3% |
| ROI | 5.2% |
| ROIC | 5.2% |
| Profit margin | 24.2% |
| Growth | |
|---|---|
| Revenue growing | Yes |
| Profits growing | No |
| Revenue up 3y | No |
| Revenue up 5y | — |
| Earnings growth 3y (net profit CAGR) | -8.0% |
| Quality | |
|---|---|
| Profitable | Yes |
| Margin expanding | No |
| Buying back stock | No |
| Diluting (TTM) | No |
| Debt/Equity | — |
| Podcast bulls (TTM) | Sign up |
| Podcast bears (TTM) | Sign up |
| Podcast sentiment (TTM) | Sign up |
| Podcast sentiment % (TTM) | Sign up |
| News sentiment (TTM) | 42 |
| Quality score | 11.1% |
| Insiders | |
|---|---|
| Buys, 1w | Sign up |
| Buys, 1m | Sign up |
| Buys, 1y | Sign up |
| Sells, 1w | Sign up |
| Sells, 1m | Sign up |
| Sells, 1y | Sign up |
Sign up to see this company's insider trades
| Figure | FY 2025 | FY 2024 | FY 2023 | FY 2022 | FY 2021 | FY 2020 | FY 2019 | FY 2018 | FY 2017 | FY 2016 | FY 2015 | FY 2014 | FY 2013 | FY 2012 | FY 2011 | FY 2010 | FY 2009 | FY 2008 | FY 2007 | FY 2006 | FY 2005 | FY 2004 | FY 2003 | FY 2002 | FY 2001 | FY 2000 |
|---|---|---|---|---|---|---|---|---|---|---|---|---|---|---|---|---|---|---|---|---|---|---|---|---|---|---|
| Revenue | 849.028M | 683.113M | 722.127M | 720.246M | 502.265M | — | — | 338.888M | — | — | — | — | — | — | — | — | — | — | — | — | — | — | — | — | — | — |
| Net profit | 205.122M | 192.081M | 239.502M | 263.813M | 120.992M | 121.167M | 165.175M | 121.622M | 87.204M | 76.648M | 64.96M | 59.845M | 50.254M | 42.627M | 45.436M | 40.24M | 22.989M | 23.964M | 28.381M | 32.851M | 33.205M | 30.767M | 26.431M | 25.066M | 22.052M | 15.19M |
| Free cash flow | 239.025M | 209.486M | 261.15M | 399.128M | 165.02M | 52.05M | 199.939M | 130.731M | 105.829M | 82.941M | 79.055M | 77.061M | 132.042M | 35.421M | 47.214M | 39.631M | 30.914M | 13.937M | 31.806M | 29.16M | 40.384M | 14.535M | 37.071M | — | — | — |
| Figure | FY 2025 | FY 2024 | FY 2023 | FY 2022 | FY 2021 | FY 2020 | FY 2019 | FY 2018 | FY 2017 | FY 2016 | FY 2015 | FY 2014 | FY 2013 | FY 2012 | FY 2011 | FY 2010 | FY 2009 | FY 2008 | FY 2007 | FY 2006 | FY 2005 | FY 2004 | FY 2003 | FY 2002 | FY 2001 | FY 2000 |
|---|---|---|---|---|---|---|---|---|---|---|---|---|---|---|---|---|---|---|---|---|---|---|---|---|---|---|
| Share price | 73.08 | 64.19 | 65.81 | 84.43 | 81.53 | 73.04 | 83.25 | 70.31 | 69.85 | 70.45 | 46.52 | 42.81 | 39.13 | 28.95 | 28.11 | 24.73 | 20.86 | 24.13 | 28.5 | 34.88 | — | — | — | — | — | — |
| Price performance 12m | 0.14 | -0.02 | -0.22 | 0.04 | 0.12 | -0.12 | 0.18 | 0.01 | -0.01 | 0.51 | 0.09 | 0.09 | 0.35 | 0.03 | 0.14 | 0.19 | -0.14 | -0.15 | -0.18 | — | — | — | — | — | — | — |
Filed figures
Lines the statements and their notes report beside the headline figures, read from the filings' XBRL as filed (no restatement applied), with figures computed from one filing's own lines. Cash-flow lines carry their cash direction: an outflow is negative. Each period links to its filing; a figure's period, report date and tag are in its tooltip.
| Figure | Dec 2016 | Dec 2017 | Dec 2018 | Dec 2019 | Dec 2020 | Dec 2021 | Dec 2022 | Dec 2023 | Dec 2024 | Dec 2025 |
|---|---|---|---|---|---|---|---|---|---|---|
| Balance sheet detail | ||||||||||
| Borrowings, current (USD) | — | — | 0.00 | 50M | — | — | — | — | — | — |
| Borrowings, non-current (USD) | 108M | 108M | 111M | 187M | 145M | 127M | 113M | 113M | 62.9M | 359M |
| Lease liabilities (USD) | — | — | 34.1M | 58.3M | 56.4M | 63.9M | 60.7M | 56.3M | 56.5M | 75.4M |
| Cash and deposits (USD) | — | — | — | 151M | 1.3B | 2.24B | 353M | 224M | 220M | 772M |
| Intangible assets (USD) | 9.85M | 9.34M | 15.3M | 29.3M | 23.1M | 32.8M | 25.1M | 18.2M | 12.3M | 134M |
| Right-of-use assets (USD) | — | — | 32.8M | 56.6M | 49.7M | 60.2M | 58.9M | 54.1M | 54.5M | 73.2M |
| Net debt (borrowings + leases - cash) (USD) | — | — | — | — | — | -2.11B | -179M | -55.2M | -100M | -337M |
| Cash flow detail | ||||||||||
| Operating cash flow (USD) | 93.3M | 131M | 142M | 217M | 64.6M | 190M | 421M | 277M | 230M | 251M |
| Purchases of property, plant and equipment (USD) | -10.4M | -25.1M | -11.1M | -16.6M | -12.6M | -25.2M | -22.1M | -15.8M | -20.4M | -12.1M |
| Dividends paid (cash effect) (USD) | -29.7M | -34M | -40.2M | -53.3M | -60.8M | -62.7M | -93.7M | -98M | -96.2M | -104M |
| Share buybacks (cash effect) (USD) | — | — | 0.00 | 0.00 | -95.1M | 0.00 | -140M | -189M | -31M | -60.8M |
| Interest paid (cash effect) (USD) | -19M | -18.6M | -25.3M | -49.7M | -36.7M | -14M | -26.4M | -183M | -292M | -307M |
| Income taxes paid (cash effect) (USD) | -33.5M | -32.9M | -27.8M | -39.6M | -48.2M | -23.4M | -44.3M | -43.7M | -51.1M | -34.8M |
| Share-based compensation (USD) | 2.97M | 3.33M | 4.23M | 4.4M | 4.12M | 4.31M | 4.46M | 6.38M | 6.52M | 8.99M |
| Free cash flow (OCF - PPE - intangibles) (USD) | 82.9M | 106M | 131M | 200M | 52.1M | 165M | 399M | 261M | 209M | 239M |
| Income detail | ||||||||||
| Total comprehensive income (USD) | 77.8M | 86.7M | 124M | 185M | 144M | 82.5M | 98.5M | 288M | 217M | 255M |
| Comprehensive income to owners (USD) | 77.8M | 86.7M | 124M | 185M | 144M | 82.5M | 98.5M | 288M | 217M | 255M |
| Reported | Feb 28, 2017 | Feb 27, 2018 | Feb 26, 2021 | Feb 28, 2023 | Nov 3, 2022 | Feb 28, 2023 | Feb 28, 2023 | Feb 28, 2024 | Feb 28, 2025 | Feb 27, 2026 |
Sign up to see institutional holdings
Sign UpPodcast Mentions
Sign up to see podcast mentions and sentiment
Sign UpMaterial events reported to the SEC on Form 8-K or 6-K, newest first. The link opens the filing itself on EDGAR. Press releases from the company's own website, newest first.

 (Opens in a new Window)
 (Opens in a new Window)


 Equal Housing Lender


 Salem, NH – October 19, 2026 – Rockland Trust is pleased to share that Chris Macomber has been appointed as Senior Vice President, Commercial Banking Officer. Macomber will develop and strengthen commercial real estate relationships, providing customized banking, credit, and treasury management solutions to help businesses grow throughout southern New Hampshire and the Merrimack Valley. "Chris brings extensive commercial and small business banking expertise along with a deep understanding of the southern New Hampshire market," said Peter Rayno, SVP, Commercial Regional Executive. "His relationship-focused approach and commitment to helping businesses achieve their goals make him an excellent addition to our team and a valuable resource for our customers." Macomber is an accomplished professional with more than 15 years of experience in commercial banking and lending, specializing in commercial real estate, construction, commercial and industrial, SBA, and non-profit financing. He has built strong relationships with business owners throughout southern New Hampshire and the Merrimack Valley, helping organizations secure financing solutions that support growth and long-term success. Most recently, he served as a commercial lender at StonehamBank. Earlier in his career, he held positions with East Boston Savings Bank, Bank of America and, Citibank. Macomber will be working out of Rockland Trust’s Salem New Hampshire office.
 Boston, MA – October 15, 2026 – Rockland Trust is pleased to announce the appointment of Frank Call as Senior Vice President, Commercial Banking Center Manager. Based in Boston, Call will lead a regional team of commercial bankers serving commercial and industrial (C&I) companies in and around Greater Boston.
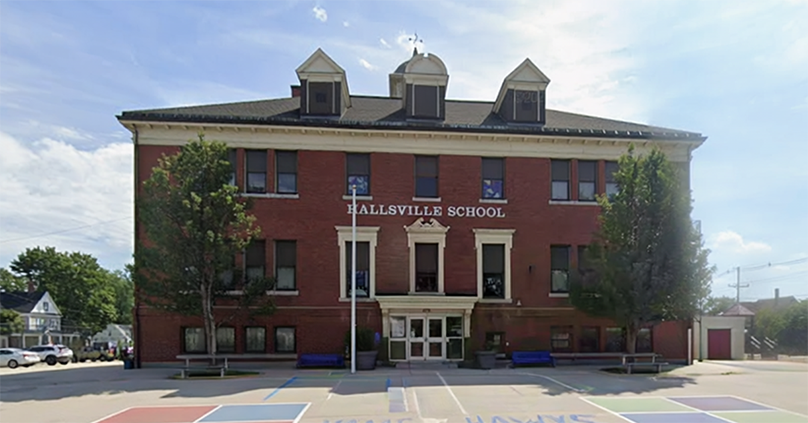 Manchester, NH – October 15, 2026 – Rockland Trust announced today that it has provided $9.4 million in financing to support the financing and redevelopment of the historic Hallsville School at 275 Jewett Street in Manchester, New Hampshire. The project will transform the vacant 1891 elementary school into Hallsville School Apartments, a 36-unit mixed-income residential community that combines affordable housing creation with historic preservation.
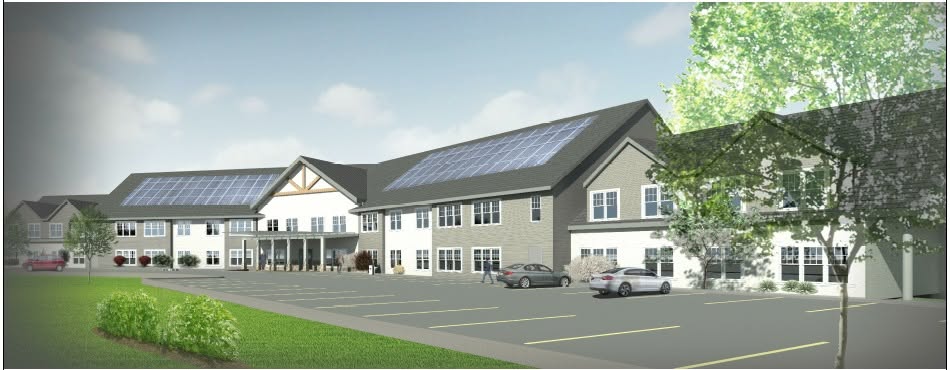 Topsfield, Mass. – October 14, 2026 – Rockland Trust has provided a $14.8 million financing package for The Caleb Group, to support the development of Emerson Homes, a new affordable housing for older adults’ community in Topsfield, Massachusetts. Located on High Street, Emerson Homes will consist of 44 rental apartments for adults aged 62 and older, helping address the growing need for affordable housing options for older adults in Essex County. The development is the first newly constructed multifamily affordable housing community in Topsfield in several decades.


 October 6, 2026 - Nashua N.H. – Rockland Trust has promoted Deborah Novotny to Senior Vice President, Commercial Banking Center Manager. Based in the Bank's commercial office in Nashua, New Hampshire, she will lead a team of commercial bankers focused on delivering personalized financial solutions to businesses throughout Hillsborough County. In her new role, Novotny will help deepen customer relationships, support local business growth, and provide strategic guidance to commercial real estate investors and commercial and industrial businesses.
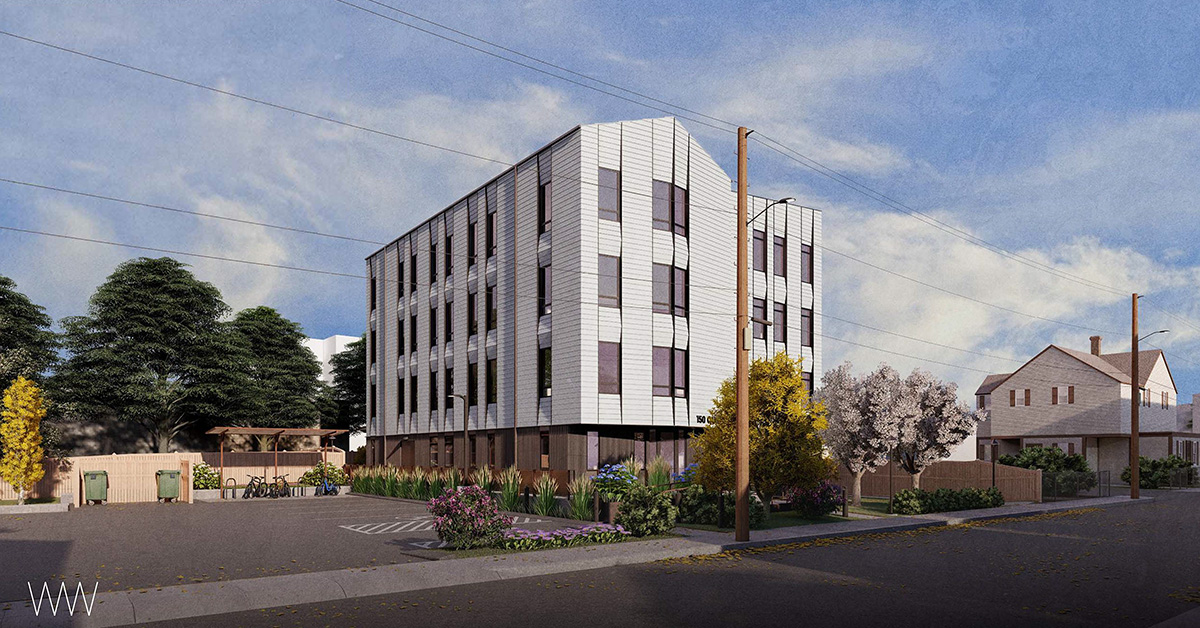 Quincy, MA – October 06, 2026 - Rockland Trust is providing a financing package of $7.4 million to Father Bill's & MainSpring (FBMS) for the development of a new 24-unit affordable housing community at 150-156 Quincy Street in Quincy, helping expand access to stable housing for some of the region's most vulnerable residents. The Quincy Street Apartments project will transform the site into a multifamily residential community designed to expand access to housing in a region facing significant housing affordability challenges.
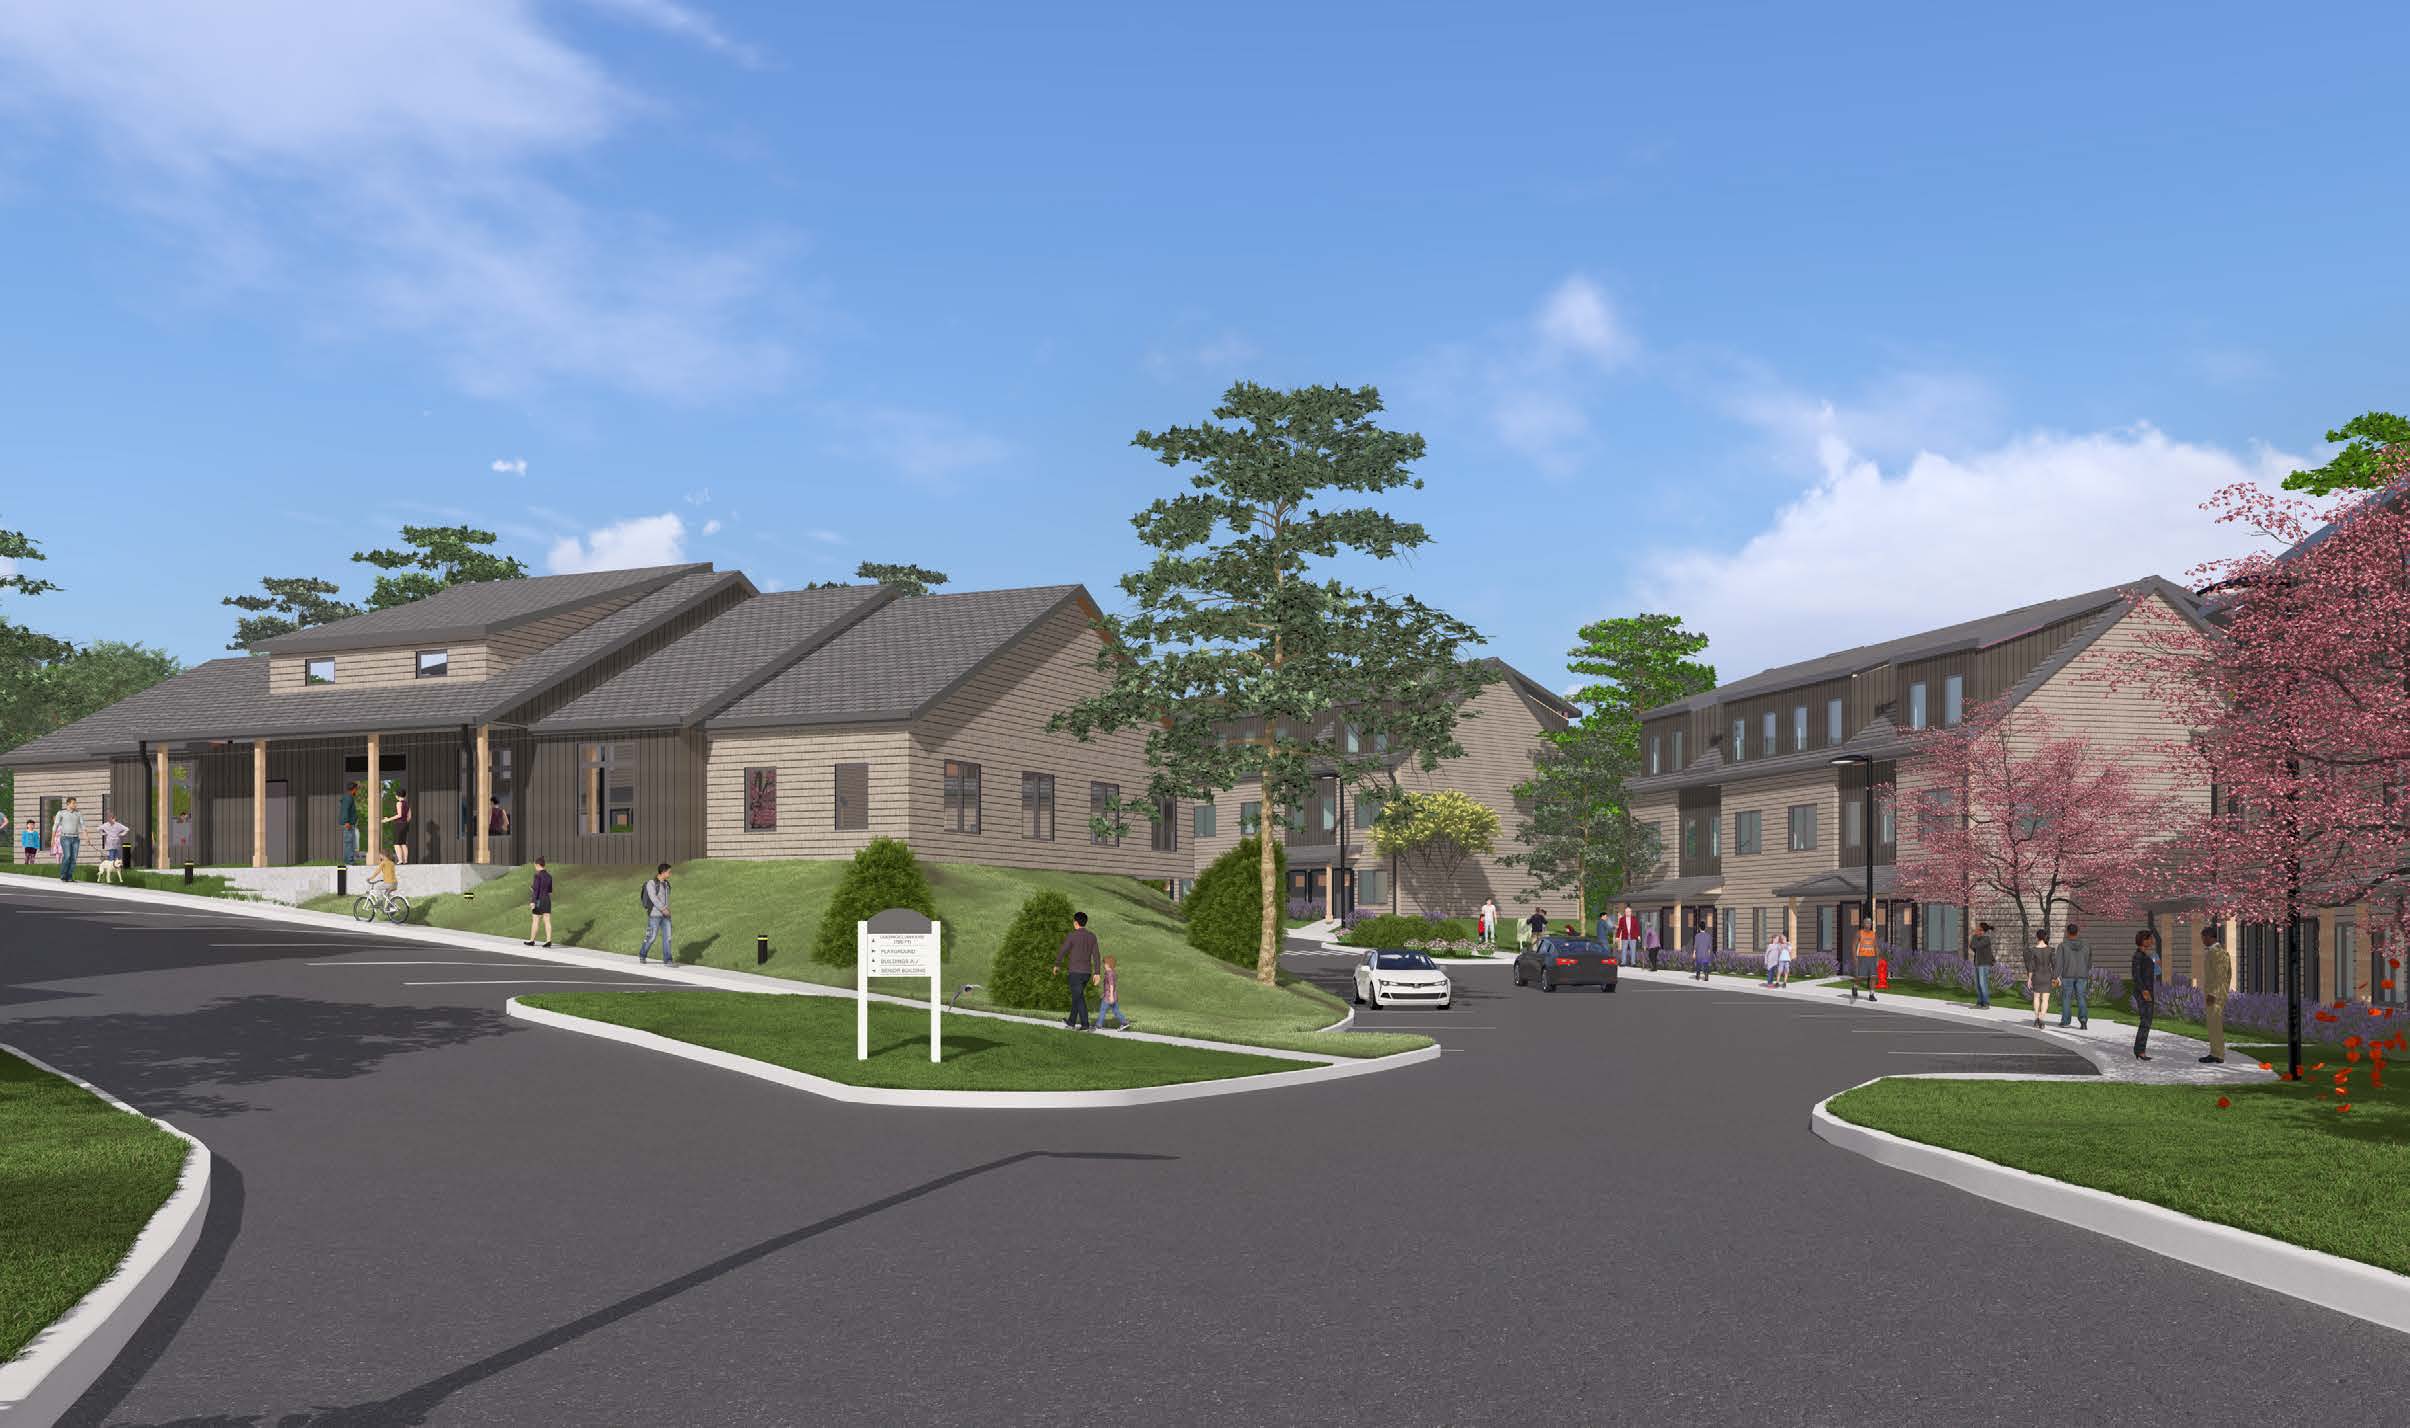 Lenox, Mass. – September 29, 2026 – Rockland Trust announced today that it is providing a $22 million financing package to support Pennrose's development of a new 68-unit mixed-income residential community at 238 Pittsfield Road in Lenox, Massachusetts. The project will expand affordable and workforce housing opportunities in Berkshire County, helping address one of the region's most pressing housing challenges.
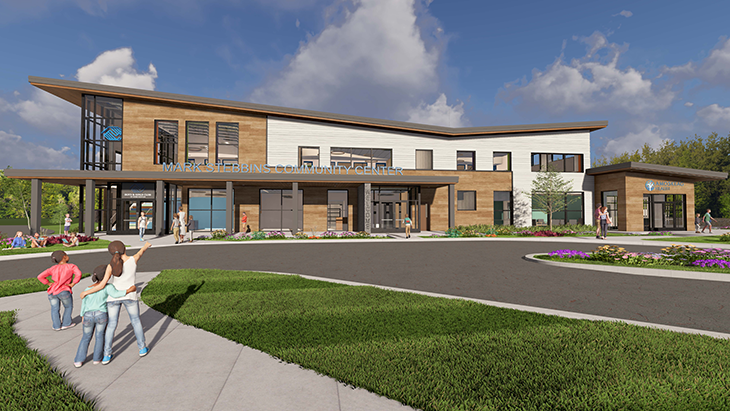 on September 9, 2026, will bring healthcare, youth programming, food access, and family support services together under one roof, creating a centralized hub for children and families in one of the city's most underserved neighborhoods.
 August 7, 2026 – Rockland Trust today announced the appointment of Eric Johnson as Senior Vice President and Commercial Banking Center Manager. Stationed in the Bank's commercial office in Braintree, Massachusetts, Johnson will oversee the Commercial Real Estate (CRE) Team and lead efforts to strengthen relationships with existing customers, cultivate new business opportunities, and support the commercial real estate financing needs of businesses and investors throughout the South Shore.


Prompts
Click prompts to add them under the company line, click again to take one out, then copy the result into your AI chat. Shared by Asian Century Stocks and Uncovered Thai Stocks. Thank you.
Independent Bank Corp. (ticker INDB), listed in United States.
Copied
ETFs Holding Independent Bank Corp.
Exchange-traded funds whose newest published daily portfolio holds one of the company's listings, largest weight first.
| ETF | Weight in ETF | Shares | Market value | As of |
|---|---|---|---|---|
| CVAR | 0.87% | 4,469 | $ 374.636K | Jul 31, 2026 |
| SMIZ | 0.77% | 25,977 | $ 2.109M | Aug 31, 2026 |
| ESSC | 0.51% | 2,188 | $ 183.42K | Jul 31, 2026 |
| HSMV | 0.38% | 249 | $ 20.923K | Nov 16, 2026 |
| DFSV | 0.27% | 889,746 | $ 74.845M | Nov 12, 2026 |
| AVSC | 0.23% | 87,953 | $ 7.391M | Nov 16, 2026 |
| RUSC | 0.21% | 2,000 | $ 167.44K | Jun 30, 2026 |
| DFAT | 0.15% | 561,873 | $ 47.265M | Nov 12, 2026 |
| MSSM | 0.13% | 11,361 | $ 922.286K | Aug 31, 2026 |
| VFMF | 0.11% | 13,695 | $ 1.112M | Aug 31, 2026 |
| DFAS | 0.09% | 371,562 | $ 31.256M | Nov 12, 2026 |
| VFVA | 0.08% | 9,592 | $ 778.679K | Aug 31, 2026 |
| DXUV | 0.04% | 29,469 | $ 2.479M | Nov 12, 2026 |
| SMDX | 0.03% | 456 | $ 38.318K | Nov 17, 2026 |
| AVSU | 0.02% | 1,050 | $ 88.232K | Nov 16, 2026 |
| DFAC | 0.02% | 184,297 | $ 15.503M | Nov 12, 2026 |
| DFUV | 0.01% | 26,769 | $ 2.252M | Nov 12, 2026 |
| DCOR | 0.01% | 73,706 | $ 6.2M | Nov 12, 2026 |
| AVUS | 0.01% | 19,863 | $ 1.669M | Nov 16, 2026 |
| DFSU | 0.01% | 2,270 | $ 190.952K | Nov 12, 2026 |
| DFAU | 0.01% | 11,398 | $ 958.8K | Nov 12, 2026 |
| DFUS | 0.01% | 14,665 | $ 1.234M | Nov 12, 2026 |
| EBI | 0.00% | 418 | $ 33.933K | Aug 31, 2026 |