October 27, 2026 PDF Version 187.8 KB Third Quarter 2026 Key Highlights Strong commercial performance with net business wins in the quarter of $3,150 million; a net book-to-bill of 1.56x and closing backlog of $24.5 billion, up 4.8% sequentially.…
October 27, 2026
PDF Version
187.8 KB
Third Quarter 2026
Key Highlights
- Strong commercial performance with net business wins in the quarter of $3,150 million; a net book-to-bill of 1.56x and closing backlog of $24.5 billion, up 4.8% sequentially.
- Revenue of $2,024.8 million and adjusted EBITDA of $336.9 million, representing an adjusted EBITDA margin of 16.6%.
- GAAP net income of $122.1 million or $1.58 diluted earnings per share. Adjusted net income of $205.8 million or $2.66 adjusted diluted earnings per share, an increase of 3.9% on quarter two 2026 adjusted diluted earnings per share.
- Generated free cash flow of $302.4 million, supporting continued investment in the business and return of capital to shareholders.
- $400.0 million worth of stock repurchased in quarter three at an average price of $170 per share.
- Board of Directors approved an increase in the share buyback authorization bringing the total value of authorized share repurchases to $750.0 million to be opportunistically deployed.
- Updating 2026 full-year financial guidance issued with revenue expected in the range of $8,100 - $8,200 million and adjusted diluted earnings per share* expected in the range of $10.35 - $10.65.
DUBLIN--(BUSINESS WIRE)--Oct. 27, 2026-- ICON plc
(NASDAQ: ICLR), a world-leading clinical research organization, today reported its financial results for the third quarter ended September 30, 2026.
Chief Executive Officer Commentary
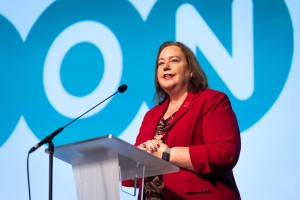
“I am pleased with ICON’s third quarter results, which demonstrated continued financial, operational, and commercial execution. Adjusted EBITDA grew 3% sequentially, reflecting improved business mix and strong cost discipline, while sustained commercial excellence supported another quarter of exceptional bookings performance. I am particularly pleased that our AI-enabled digital platform continues to resonate with customers, many of whom choose ICON because of its impact on productivity, predictability and speed.
We remained focused on disciplined capital allocation, returning $400 million to shareholders through share repurchases in the third quarter, while continuing to invest in the capabilities that are driving future growth.
Our updated full-year financial guidance reflects sustained operational progress and higher pass-through activity. Together, strong commercial performance, disciplined execution and ongoing strategic investments reinforce our confidence in delivering revenue growth, significant earnings progression, and shareholder value creation in 2027 and beyond.”
— Barry Balfe**, Chief Executive Officer**
Third Quarter 2026 Results
In quarter three 2026, gross bookings were $3,789 million, an increase of 26.9% on quarter three 2025, with cancellations of $639 million. This resulted in net business wins of $3,150 million and a book-to-bill of 1.56x. Backlog as at September 30, 2026 was $24.5 billion.
Revenue for the third quarter was $2,024.8 million. This represents a decrease of 2.9% on quarter three 2025, or a decrease of 2.5% on a constant currency basis.
GAAP net income was $122.1 million, resulting in diluted earnings per share of $1.58 in quarter three 2026, compared to diluted earnings per share of $(3.67) in quarter three 2025. Adjusted net income for the quarter was $205.8 million, resulting in adjusted diluted earnings per share of $2.66 compared to $3.20 per share in quarter three 2025.
Adjusted EBITDA for the third quarter was $336.9 million or 16.6% of revenue, a decrease of 13.1% on quarter three 2025.
The effective tax rate on adjusted net income in quarter three 2026 was 18.6%.
Free cash flow was $302.4 million in the quarter. Cash generated from operating activities for the quarter was $340.4 million. During the quarter, $38.0 million was spent on capital expenditure. $400.0 million worth of stock was repurchased at an average price of $170 per share. In August 2026, ICON completed a successful investment grade bond issuance of $2.15 billion. The Company applied the net proceeds from the issuance to repay all the outstanding Senior Secured Term Loan of $900 million, redeem in full the outstanding May 2027 Notes of $750 million and repay all outstanding borrowings under the Bridge Secured Credit Facility of $500 million. At September 30, 2026, the Group had cash and cash equivalents of $809.0 million, compared to cash and cash equivalents of $928.4 million at June 30, 2026 and $468.9 million at September 30, 2025. Net debt as at September 30, 2026 was $2.6 billion.
Year to Date 2026 Results
Gross business wins year to date were $10,733 million and cancellations were $1,584 million. This resulted in net business wins of $9,149 million and a book-to-bill of 1.49x.
Revenue year to date was $6,122.2 million. This represents a year on year decrease of 0.3% or a decrease of 1.4% on a constant currency basis.
GAAP net income year to date was $299.5 million, resulting in $3.87 diluted earnings per share. Year to date adjusted net income was $597.2 million, resulting in adjusted diluted earnings per share of $7.72 compared to $9.99 per share for the equivalent prior year period.
Adjusted EBITDA year to date was $981.9 million or 16.0% of revenue, a year on year decrease of 18.4%.
The effective tax rate on adjusted net income year to date was 18.1%.
Earnings Conference Call
ICON will hold a conference call on October 28, 2026 at 08:00 EDT [12:00 Ireland & UK]. This call and linked slide presentation can be accessed live from our website at https://investor.iconplc.com
. A recording will also be available on the website for 90 days following the call. In addition, a calendar of company events, including upcoming conference presentations, is available on our website, under “Investors”. This calendar will be updated regularly.
About ICON plc
ICON plc
is a world-leading clinical research organization. Offering deep operational and medical expertise we accelerate innovation, driving emerging therapies forward to improve patient outcomes. From molecule to medicine, we deliver integrated consulting, clinical development, commercialization and post-marketing solutions to pharmaceutical, biotechnology, medical device, government and public health organizations worldwide. With headquarters in Dublin, Ireland, ICON employed approximately 40,250 employees in 98 locations in 55 countries as at September 30, 2026. For further information about ICON, visit: www.iconplc.com
.
Other Information
Cautionary Statement Regarding Forward-Looking Statements
Statements included herein which are not historical facts are forward-looking statements. Such forward-looking statements are made pursuant to the safe harbor provisions of the U.S. Private Securities Litigation Reform Act of 1995. Examples of forward-looking statements include, but are not limited to, statements regarding the following: anticipated financial results for 2026, 2027 and beyond; contracted revenue; the Company's expectations regarding business momentum, market opportunity, demand trends, growth, and commercial performance; and the Company's expectations with respect to its long-term value creation and competitive positioning. You can identify many forward-looking statements by words such as “aims,” “anticipates,” “believes,” “continues,” “could,” “estimates,” “expects,” “focused,” “guidance,” “intends,” “look,” “may,” “opportunities,” “plans,” “positions,” “potential,” “predicts,” “projects,” “seeks,” “should,” “will,” “would” and other similar expressions and the negatives of such expressions. However, not all forward-looking statements contain these words. These statements are based on management's current expectations and information currently available, including current economic and industry conditions. The forward-looking statements involve a number of risks and uncertainties and are subject to change at any time. In the event such risks or uncertainties materialize, our results could be materially adversely affected. The risks and uncertainties include, but are not limited to, dependence on the pharmaceutical industry and certain clients, the need to regularly win projects and then to execute them efficiently and correctly, the challenges presented by rapid growth, competition and the continuing consolidation of the industry, the impact of market conditions on demand for the Company's services, risks related to the Company's ability to execute on its commercial strategy and maintain relationships with large pharmaceutical customers, and risks relating to the Company's strategic partnerships, the dependence on certain key executives, changes in the regulatory environment, exchange rate fluctuations, inflation and rising labor costs. Please also refer to the section entitled "Risk Factors" of our Annual Report on Form 20-F for the year ended December 31, 2025 filed on May 27, 2026 for a discussion of some of the principal risks that could adversely affect our business, operations and financial results. The Company’s forward-looking statements speak only as of the date of this report or as of the date they are made, and the Company undertakes no obligation to update its forward-looking statements.
Non-GAAP Financial Measures
In addition to the financial measures prepared in accordance with generally accepted accounting principles (GAAP), this press release contains certain non-GAAP financial measures, including adjusted EBITDA, adjusted net income, adjusted diluted earnings per share and free cash flow. Adjusted EBITDA excludes stock-based compensation, foreign currency gains and losses, restructuring and related costs, transaction, integration related and other adjustments, gain on investments, loss on disposal of subsidiary undertaking, goodwill impairment and impairment of non-financial assets. Adjusted net income and adjusted diluted earnings per share exclude amortization of intangible assets, stock-based compensation, foreign currency gains and losses, restructuring and related costs, transaction, integration related and other adjustments, transaction-related financing costs, gain on investments, goodwill impairment, impairment of non-financial assets, loss on disposal of subsidiary undertaking and their related taxation effect. Free cash flow reflects cash generated from operating activities less capital expenditure. While non-GAAP financial measures are not superior to or a substitute for the comparable GAAP measures, ICON believes certain non-GAAP information is useful to investors for historical comparison purposes.
*Adjusted diluted earnings per share to exclude amortization of intangible assets, stock-based compensation, foreign currency gains and losses, restructuring and related costs, transaction, integration related and other adjustments, transaction-related financing costs, gain on investments, goodwill impairment, impairment of non-financial assets, loss on disposal of subsidiary undertaking and their related taxation effect.
Our full-year 2026 guidance adjusted diluted earnings per share measures are provided on a non-GAAP basis without a reconciliation to the most directly comparable GAAP measure because the Company is unable to predict with a reasonable degree of certainty certain items contained in the measures without unreasonable efforts. For the same reasons, the Company is unable to address the probable significance of the unavailable information.
|
|
|
|
|
|
|
|
|
|
|
|
|
|
|
|
|
|
| ICON plcCONDENSED CONSOLIDATED STATEMENTS OF OPERATIONSFOR THE THREE AND NINE MONTHS ENDED SEPTEMBER 30, 2026 AND SEPTEMBER 30, 2025(UNAUDITED) |
|
|
|
|
|
|
|
|
|
|
|
|
|
|
|
|
|
|
Three Months Ended |
|
|
|
|
|
|
|
|
Nine Months Ended |
|
|
|
|
|
|
|
|
|
September 30**,** 2026 |
|
|
|
September 30**,** 2025 |
|
|
|
September 30**,** 2026 |
|
|
|
September 30**,** 2025 |
|
|
|
|
(in thousands except share and per share data) |
|
|
|
|
|
|
|
|
|
|
|
|
|
|
|
|
|
|
|
|
|
|
|
|
|
|
|
|
|
|
|
|
|
|
| Revenue |
|
$ |
2,024,757 |
|
|
$ |
2,084,415 |
|
|
$ |
6,122,242 |
|
|
$ |
6,138,823 |
|
|
|
|
|
|
|
|
|
|
|
|
|
|
|
|
|
|
|
|
| Costs and expenses: |
|
|
|
|
|
|
|
|
|
|
|
|
|
|
|
|
|
| Direct costs |
|
|
1,532,925 |
|
|
|
1,538,951 |
|
|
|
4,673,190 |
|
|
|
4,443,967 |
|
|
| Selling, general and administrative |
|
|
196,850 |
|
|
|
197,049 |
|
|
|
591,766 |
|
|
|
600,439 |
|
|
| Depreciation and amortization of intangible assets |
|
|
94,422 |
|
|
|
99,030 |
|
|
|
275,520 |
|
|
|
292,706 |
|
|
| Transaction and integration related |
|
|
233 |
|
|
|
7,020 |
|
|
|
5,949 |
|
|
|
19,141 |
|
|
| Restructuring |
|
|
1,486 |
|
|
|
— |
|
|
|
32,466 |
|
|
|
82,296 |
|
|
| Loss on disposal of subsidiary undertaking |
|
|
— |
|
|
|
— |
|
|
|
32,947 |
|
|
|
— |
|
|
| Goodwill impairment |
|
|
— |
|
|
|
364,248 |
|
|
|
— |
|
|
|
364,248 |
|
|
| Impairment of non-financial assets |
|
|
— |
|
|
|
101,027 |
|
|
|
— |
|
|
|
101,027 |
|
|
| Total costs and expenses |
|
|
1,825,916 |
|
|
|
2,307,325 |
|
|
|
5,611,838 |
|
|
|
5,903,824 |
|
|
|
|
|
|
|
|
|
|
|
|
|
|
|
|
|
|
|
|
| Income / (loss) from operations |
|
|
198,841 |
|
|
|
(222,910 |
) |
|
|
510,404 |
|
|
|
234,999 |
|
|
| Interest income |
|
|
5,612 |
|
|
|
1,761 |
|
|
|
10,588 |
|
|
|
5,617 |
|
|
| Interest expense |
|
|
(66,175 |
) |
|
|
(50,243 |
) |
|
|
(162,959 |
) |
|
|
(148,003 |
) |
|
|
|
|
|
|
|
|
|
|
|
|
|
|
|
|
|
|
|
| Income / (loss) before income tax expense |
|
|
138,278 |
|
|
|
(271,392 |
) |
|
|
358,033 |
|
|
|
92,613 |
|
|
| Income tax expense |
|
|
(32,446 |
) |
|
|
(12,791 |
) |
|
|
(74,868 |
) |
|
|
(12,468 |
) |
|
|
|
|
|
|
|
|
|
|
|
|
|
|
|
|
|
|
|
| Income / (loss) before share of net gains from equity method investments |
|
|
105,832 |
|
|
|
(284,183 |
) |
|
|
283,165 |
|
|
|
80,145 |
|
|
| Share of net gains from equity method investments |
|
|
16,298 |
|
|
|
— |
|
|
|
16,298 |
|
|
|
— |
|
|
| Net income / (loss) |
|
$ |
122,130 |
|
|
$ |
(284,183 |
) |
|
$ |
299,463 |
|
|
$ |
80,145 |
|
|
|
|
|
|
|
|
|
|
|
|
|
|
|
|
|
|
|
|
| Net income / (loss) per Ordinary Share: |
|
|
|
|
|
|
|
|
|
|
|
|
|
|
|
|
|
|
|
|
|
|
|
|
|
|
|
|
|
|
|
|
|
|
|
| Basic |
|
$ |
1.59 |
|
|
$ |
(3.67 |
) |
|
$ |
3.90 |
|
|
$ |
1.01 |
|
|
| Diluted |
|
$ |
1.58 |
|
|
$ |
(3.67 |
) |
|
$ |
3.87 |
|
|
$ |
1.01 |
|
|
|
|
|
|
|
|
|
|
|
|
|
|
|
|
|
|
|
|
| Weighted average number of ordinary shares outstanding: |
|
|
|
|
|
|
|
|
|
|
|
|
|
|
|
|
|
|
|
|
|
|
|
|
|
|
|
|
|
|
|
|
|
|
|
| Basic |
|
|
76,932,640 |
|
|
|
77,373,534 |
|
|
|
76,785,939 |
|
|
|
79,057,239 |
|
|
| Diluted |
|
|
77,404,061 |
|
|
|
77,373,534 |
|
|
|
77,345,757 |
|
|
|
79,518,086 |
|
|
|
|
|
|
|
|
|
|
|
|
|
|
|
|
|
|
|
|
|
|
|
|
|
|
|
|
|
| ICON plcCONDENSED CONSOLIDATED BALANCE SHEETSAS AT SEPTEMBER 30, 2026 AND DECEMBER 31, 2025 |
|
|
|
|
|
|
|
|
|
(Unaudited) |
|
|
|
(Audited) |
|
|
|
|
September 30**,** 2026 |
|
|
|
December 31**,** 2025 |
|
|
|
| ASSETS |
(in thousands) |
|
|
|
|
|
|
|
| Current assets: |
|
|
|
|
|
|
|
|
| Cash and cash equivalents |
$ |
808,984 |
|
|
$ |
647,295 |
|
|
| Accounts receivable, net of allowance for credit losses |
|
1,510,045 |
|
|
|
1,474,898 |
|
|
| Unbilled revenue |
|
1,023,170 |
|
|
|
1,096,592 |
|
|
| Other receivables |
|
100,669 |
|
|
|
116,750 |
|
|
| Prepayments and other current assets |
|
116,521 |
|
|
|
105,316 |
|
|
| Income taxes receivable |
|
81,990 |
|
|
|
60,824 |
|
|
| Total current assets |
$ |
3,641,379 |
|
|
$ |
3,501,675 |
|
|
|
|
|
|
|
|
|
|
|
| Non-current assets: |
|
|
|
|
|
|
|
|
| Property, plant and equipment, net |
|
375,265 |
|
|
|
395,724 |
|
|
| Goodwill |
|
8,721,911 |
|
|
|
8,731,689 |
|
|
| Intangible assets, net |
|
3,100,266 |
|
|
|
3,247,118 |
|
|
| Operating right-of-use assets |
|
103,064 |
|
|
|
128,948 |
|
|
| Other receivables |
|
73,658 |
|
|
|
75,707 |
|
|
| Deferred tax asset |
|
105,538 |
|
|
|
106,871 |
|
|
| Investments in equity |
|
121,251 |
|
|
|
82,050 |
|
|
| Total Assets |
$ |
16,242,332 |
|
|
$ |
16,269,782 |
|
|
|
|
|
|
|
|
|
|
|
| LIABILITIES AND SHAREHOLDERS’ EQUITY |
|
|
|
|
|
|
|
|
| Current liabilities: |
|
|
|
|
|
|
|
|
| Accounts payable |
$ |
86,003 |
|
|
$ |
192,117 |
|
|
| Unearned revenue |
|
1,727,355 |
|
|
|
1,550,471 |
|
|
| Other liabilities |
|
936,745 |
|
|
|
904,826 |
|
|
| Income taxes payable |
|
18,553 |
|
|
|
18,999 |
|
|
| Current bank credit lines, loan facilities and notes |
|
— |
|
|
|
529,762 |
|
|
| Total current liabilities |
$ |
2,768,656 |
|
|
$ |
3,196,175 |
|
|
|
|
|
|
|
|
|
|
|
| Non-current liabilities: |
|
|
|
|
|
|
|
|
| Non-current bank credit lines, loan facilities and notes, net |
|
3,379,107 |
|
|
|
2,872,616 |
|
|
| Lease liabilities |
|
97,144 |
|
|
|
117,122 |
|
|
| Non-current other liabilities |
|
79,362 |
|
|
|
72,807 |
|
|
| Non-current income taxes payable |
|
109,800 |
|
|
|
103,251 |
|
|
| Deferred tax liability |
|
680,944 |
|
|
|
714,427 |
|
|
| Commitments and contingencies |
|
— |
|
|
|
— |
|
|
| Total Liabilities |
$ |
7,115,013 |
|
|
$ |
7,076,398 |
|
|
|
|
|
|
|
|
|
|
|
| Shareholders' Equity: |
|
|
|
|
|
|
|
|
| Ordinary shares, par value 6 euro cents per share; 100,000,000 shares authorized, |
|
|
|
|
|
|
|
|
| 74,916,724 shares issued and outstanding at September 30, 2026 and |
|
|
|
|
|
|
|
|
| 76,567,325 shares issued and outstanding at December 31, 2025 |
|
6,189 |
|
|
|
6,305 |
|
|
| Additional paid‑in capital |
|
7,208,291 |
|
|
|
7,131,956 |
|
|
| Other undenominated capital |
|
1,771 |
|
|
|
1,606 |
|
|
| Accumulated other comprehensive loss |
|
(110,352 |
) |
|
|
(68,534 |
) |
|
| Retained earnings |
|
2,021,420 |
|
|
|
2,122,051 |
|
|
| Total Shareholders' Equity |
$ |
9,127,319 |
|
|
$ |
9,193,384 |
|
|
| Total Liabilities and Shareholders' Equity |
$ |
16,242,332 |
|
|
$ |
16,269,782 |
|
|
|
|
|
|
|
|
|
|
|
| ICON plcCONDENSED CONSOLIDATED STATEMENTS OF CASH FLOWSFOR THE NINE MONTHS ENDED SEPTEMBER 30, 2026 AND SEPTEMBER 30, 2025(UNAUDITED) |
|
|
|
|
|
|
|
|
|
Nine Months Ended |
|
|
|
|
|
|
|
|
September 30**,** 2026 |
|
|
|
September 30**,** 2025 |
|
|
|
|
(in thousands) |
|
|
|
|
|
|
|
| Cash flows provided by operating activities: |
|
|
|
|
|
|
|
|
| Net income |
$ |
299,463 |
|
|
$ |
80,145 |
|
|
|
|
|
|
|
|
|
|
|
| Adjustments to reconcile net income to net cash provided by operating activities: |
|
|
|
|
|
|
|
|
| Depreciation and amortization of intangible assets |
|
275,520 |
|
|
|
292,706 |
|
|
| Goodwill impairment |
|
— |
|
|
|
364,248 |
|
|
| Impairment of non-financial assets |
|
— |
|
|
|
101,027 |
|
|
| Impairment of operating right-of-use assets and related property, plant and equipment |
|
— |
|
|
|
5,573 |
|
|
| Reduction in carrying value of operating right-of-use assets |
|
34,596 |
|
|
|
29,473 |
|
|
| Share of net gains from equity method investments |
|
(16,298 |
) |
|
|
— |
|
|
| Loss on disposal of subsidiary undertaking |
|
32,947 |
|
|
|
— |
|
|
| Amortization of financing costs |
|
8,108 |
|
|
|
4,470 |
|
|
| Loss on extinguishment of debt |
|
12,233 |
|
|
|
— |
|
|
| Share-based compensation expense |
|
63,319 |
|
|
|
72,529 |
|
|
| Deferred tax benefit |
|
(32,986 |
) |
|
|
(114,257 |
) |
|
| Unrealized foreign exchange movements |
|
(24,963 |
) |
|
|
24,661 |
|
|
| Other non-cash items |
|
4,195 |
|
|
|
20,561 |
|
|
| Changes in operating assets and liabilities: |
|
|
|
|
|
|
|
|
| Accounts receivable |
|
(99,754 |
) |
|
|
(8,212 |
) |
|
| Unbilled revenue |
|
64,474 |
|
|
|
(157,162 |
) |
|
| Unearned revenue |
|
235,605 |
|
|
|
64,542 |
|
|
| Other net assets |
|
(63,045 |
) |
|
|
21,739 |
|
|
| Net cash provided by operating activities |
|
793,414 |
|
|
|
802,043 |
|
|
| Cash flows used in investing activities: |
|
|
|
|
|
|
|
|
| Purchase of property, plant and equipment |
|
(111,183 |
) |
|
|
(114,885 |
) |
|
| Purchase of subsidiary undertakings (net of cash acquired) |
|
— |
|
|
|
(2,537 |
) |
|
| Cash outflow on disposal of subsidiary undertaking (including cash sold) |
|
(57,142 |
) |
|
|
— |
|
|
| Proceeds from investments in equity |
|
2,908 |
|
|
|
2,114 |
|
|
| Purchase of investments in equity |
|
(32,939 |
) |
|
|
(16,286 |
) |
|
| Net cash used in investing activities |
|
(198,356 |
) |
|
|
(131,594 |
) |
|
| Cash flows used in financing activities: |
|
|
|
|
|
|
|
|
| Debt issuance costs |
|
(16,679 |
) |
|
|
— |
|
|
| Early repayment fee |
|
(7,841 |
) |
|
|
— |
|
|
| Drawdown of credit lines and loan facilities |
|
2,650,000 |
|
|
|
50,000 |
|
|
| Repayment of credit lines and loan facilities |
|
(2,666,688 |
) |
|
|
(72,321 |
) |
|
| Proceeds from shares issued under equity compensation plans |
|
13,080 |
|
|
|
7,319 |
|
|
| Share issuance costs |
|
(15 |
) |
|
|
(14 |
) |
|
| Repurchase of ordinary shares |
|
(400,000 |
) |
|
|
(750,000 |
) |
|
| Share repurchase costs |
|
(94 |
) |
|
|
(450 |
) |
|
| Net cash used in financing activities |
|
(428,237 |
) |
|
|
(765,466 |
) |
|
| Effect of exchange rate movements on cash |
|
(5,132 |
) |
|
|
25,120 |
|
|
| Net increase / (decrease) in cash and cash equivalents |
|
161,689 |
|
|
|
(69,897 |
) |
|
| Cash and cash equivalents at beginning of period |
|
647,295 |
|
|
|
538,785 |
|
|
| Cash and cash equivalents at end of period |
|
808,984 |
|
|
|
468,888 |
|
|
|
|
|
|
|
|
|
|
|
|
|
|
|
|
|
|
|
| ICON plcRECONCILIATION OF NON-GAAP MEASURESFOR THE THREE MONTHS AND NINE MONTHS ENDED SEPTEMBER 30, 2026 AND SEPTEMBER 30, 2025(UNAUDITED) |
|
|
|
|
|
|
|
|
|
|
|
|
|
|
|
|
|
Three Months Ended |
|
|
|
|
|
|
|
Nine Months Ended |
|
|
|
|
|
|
|
|
September 30**,** 2026 |
|
|
|
September 30**,** 2025 |
|
|
|
September 30**,** 2026 |
|
|
|
September 30**,** 2025 |
|
|
|
|
(in thousands except share and per share data) |
|
|
|
|
|
|
|
|
|
|
|
|
|
|
|
|
|
|
|
|
|
|
|
|
|
|
|
|
|
|
|
|
| Adjusted EBITDA |
|
|
|
|
|
|
|
|
|
|
|
|
|
|
|
|
| Net income / (loss) |
$ |
122,130 |
|
|
$ |
(284,183 |
) |
|
$ |
299,463 |
|
|
$ |
80,145 |
|
|
| Income tax expense |
|
32,446 |
|
|
|
12,791 |
|
|
|
74,868 |
|
|
|
12,468 |
|
|
| Net interest expense |
|
60,563 |
|
|
|
48,482 |
|
|
|
152,371 |
|
|
|
142,386 |
|
|
| Depreciation and amortization of intangible assets |
|
94,422 |
|
|
|
99,030 |
|
|
|
275,520 |
|
|
|
292,706 |
|
|
| Stock-based compensation expense (a) |
|
18,006 |
|
|
|
46,191 |
|
|
|
64,424 |
|
|
|
73,918 |
|
|
| Foreign currency losses / (gains), net (b) |
|
6,553 |
|
|
|
(6,860 |
) |
|
|
(1,152 |
) |
|
|
35,250 |
|
|
| Restructuring and related costs (c) |
|
10,720 |
|
|
|
— |
|
|
|
41,700 |
|
|
|
82,296 |
|
|
| Transaction, integration related and other (d) |
|
10,664 |
|
|
|
7,020 |
|
|
|
66,724 |
|
|
|
19,141 |
|
|
| Gain on investments (f) |
|
(18,631 |
) |
|
|
— |
|
|
|
(25,009 |
) |
|
|
— |
|
|
| Loss on disposal of subsidiary undertaking (g) |
|
— |
|
|
|
— |
|
|
|
32,947 |
|
|
|
— |
|
|
| Goodwill impairment (h) |
|
— |
|
|
|
364,248 |
|
|
|
— |
|
|
|
364,248 |
|
|
| Impairment of non-financial assets (i) |
|
— |
|
|
|
101,027 |
|
|
|
— |
|
|
|
101,027 |
|
|
| Adjusted EBITDA |
$ |
336,873 |
|
|
$ |
387,746 |
|
|
$ |
981,856 |
|
|
$ |
1,203,585 |
|
|
|
|
|
|
|
|
|
|
|
|
|
|
|
|
|
|
|
| Adjusted net income and adjusted diluted net income per Ordinary Share |
|
|
|
|
|
|
|
|
|
|
|
|
|
|
|
|
| Net income / (loss) |
$ |
122,130 |
|
|
$ |
(284,183 |
) |
|
$ |
299,463 |
|
|
$ |
80,145 |
|
|
| Income tax expense |
|
32,446 |
|
|
|
12,791 |
|
|
|
74,868 |
|
|
|
12,468 |
|
|
| Amortization of intangible assets |
|
46,244 |
|
|
|
58,688 |
|
|
|
146,631 |
|
|
|
176,691 |
|
|
| Stock-based compensation expense (a) |
|
18,006 |
|
|
|
46,191 |
|
|
|
64,424 |
|
|
|
73,918 |
|
|
| Foreign currency losses / (gains), net (b) |
|
6,553 |
|
|
|
(6,860 |
) |
|
|
(1,152 |
) |
|
|
35,250 |
|
|
| Restructuring and related costs (c) |
|
18,136 |
|
|
|
— |
|
|
|
49,116 |
|
|
|
82,296 |
|
|
| Transaction, integration related and other (d) |
|
10,664 |
|
|
|
7,020 |
|
|
|
66,724 |
|
|
|
19,141 |
|
|
| Transaction-related financing costs (e) |
|
17,322 |
|
|
|
1,499 |
|
|
|
21,023 |
|
|
|
4,470 |
|
|
| Gain on investments (f) |
|
(18,631 |
) |
|
|
— |
|
|
|
(25,009 |
) |
|
|
— |
|
|
| Loss on disposal of subsidiary undertaking (g) |
|
— |
|
|
|
— |
|
|
|
32,947 |
|
|
|
— |
|
|
| Goodwill impairment (h) |
|
— |
|
|
|
364,248 |
|
|
|
— |
|
|
|
364,248 |
|
|
| Impairment of non-financial assets (i) |
|
— |
|
|
|
101,027 |
|
|
|
— |
|
|
|
101,027 |
|
|
| Adjusted tax expense (j) |
|
(47,034 |
) |
|
|
(50,771 |
) |
|
|
(131,852 |
) |
|
|
(154,918 |
) |
|
| Adjusted net income |
$ |
205,836 |
|
|
$ |
249,650 |
|
|
$ |
597,183 |
|
|
$ |
794,736 |
|
|
|
|
|
|
|
|
|
|
|
|
|
|
|
|
|
|
|
| Diluted weighted average number of Ordinary Shares outstanding |
|
77,404,061 |
|
|
|
78,082,459 |
|
|
|
77,345,757 |
|
|
|
79,518,086 |
|
|
|
|
|
|
|
|
|
|
|
|
|
|
|
|
|
|
|
| Adjusted diluted net income per Ordinary Share |
$ |
2.66 |
|
|
$ |
3.20 |
|
|
$ |
7.72 |
|
|
$ |
9.99 |
|
|
|
|
|
|
|
|
|
|
|
|
|
|
|
|
|
|
|
|
|
| (a) |
Stock-based compensation expense represents the amount of expense related to the Company’s equity compensation programs (inclusive of employer related taxes). |
| (b) |
Foreign currency losses / (gains), net relates to gains or losses that arise in connection with the revaluation, or settlement, of non-US dollar denominated assets and liabilities. We exclude these gains and losses from adjusted EBITDA and adjusted net income because fluctuations from period-to-period do not necessarily correspond to changes in our operating results. |
| (c) |
Restructuring and related costs relate to charges incurred in connection with the Company's realignment of its workforce, with the elimination of redundant positions as well as reviewing its global office footprint and optimizing its locations to best fit the requirements of the Company. Costs relating to accelerated amortization of operating right-of-use assets and related contract costs are recorded within selling, general and administrative expenses. Costs related to an accelerated depreciation charge on related property, plant and equipment was recorded within depreciation and amortization of intangible assets in the Consolidated Statements of Operations and, accordingly, is reflected in the depreciation and amortization of intangible assets adjustment within Adjusted EBITDA, while being included within the restructuring and related costs adjustment in Adjusted Net Income. |
| (d) |
Transaction, integration related and other costs include expenses associated with our acquisitions and any other costs incurred related to the integration of these acquisitions. Further, costs incurred in 2026 relating to the Investigation, including out of scope audit fees resulting from the impact of the investigation, and in defense of the Putative Class Action are classified within this category. These costs are recorded within selling, general and administrative expenses. |
| (e) |
Transaction-related financing costs include costs incurred in connection with changes to our long-term debt and amortization of financing fees including the loss on extinguishment of debt. We exclude these costs from adjusted net income because they result from financing decisions rather than from decisions made related to our ongoing operations. |
| (f) |
Gain on investments relates to Net Asset Value (NAV) movement on investments in equity recorded within the income statement and share of net gains from equity method investments. We exclude these movements from adjusted EBITDA and adjusted net income because fluctuations from period-to-period do not necessarily correspond to changes in our operating results. |
| (g) |
On May 8, 2026, ICON completed the disposal of Symphony Health Solutions Corporation. The Company recognized a pre-tax loss on disposal, including transaction costs, of $32.9 million. This loss is excluded from adjusted EBITDA and adjusted net income. |
| (h) |
Goodwill impairment relates to an impairment of goodwill allocated to the Company's Data Solutions reporting unit. |
| (i) |
Impairment of non-financial assets relates to an impairment of the carrying amount of the property, plant and equipment and intangible assets of the Company's Data Solutions reporting unit. |
| (j) |
Represents the tax effect of adjusted pre-tax income at our estimated effective tax rate. |
ICON plc
ICON/ICLR-F

View source version on businesswire.com
: https://www.businesswire.com/news/home/20261027115066/en/
Investor Relations +1 888 381 7923
Nigel Clerkin Chief Financial Officer | +353 1 291 2000
Kate Haven Vice President Investor Relations | +1 888 381 7923
All at ICON | Source: ICON plc | ICON/ICLR-F
Source: ICON plc

For Clients
ICON For
News & Events
Search Investor
×

ICON Cookies
By clicking “Accept All Cookies,” you agree to the storing of cookies on your device to enhance site navigation and user experience, analyze site usage, and assist in our marketing efforts.
Accept All Cookies
Cookies Settings

ICON Privacy Preference Centre
-
Your Privacy
-
Strictly Necessary Cookies
-
Performance Cookies
-
Functional Cookies
-
Targeting Cookies
Your Privacy
When you visit any website, it may store or retrieve information on your browser, mostly in the form of cookies. This information might be about you, your preferences or your device and is mostly used to make the site work as you expect it to. The information does not usually directly identify you, but it can give you a more personalized web experience. Because ICON respects your right to privacy, you can choose not to allow some types of cookies. Click on the different category headings to find out more and change our default settings. Note, however, that blocking some types of cookies may impact your experience of the site and the services we are able to offer.
Cookie Notice
User ID: cb092299-caf9-4ffa-8439-bbb2ff27047b
Strictly Necessary Cookies
Always Active
These cookies are necessary for the website to function and cannot be switched off in our systems. They are usually only set in response to actions made by you which amount to a request for services, such as setting your privacy preferences, logging in or filling in forms. You can set your browser to block or alert you about these cookies, but some parts of the site will not then work. These cookies do not store any personally identifiable information.
Cookies Details
Performance Cookies
Performance Cookies
These cookies allow us to count visits and traffic sources so we can measure and improve the performance of our site. They help us to know which pages are the most and least popular and see how visitors move around the site. All information these cookies collect is aggregated and therefore anonymous. If you do not allow these cookies we will not know when you have visited our site, and will not be able to monitor its performance.
Cookies Details
Functional Cookies
Functional Cookies
These cookies enable the website to provide enhanced functionality and personalisation. They may be set by us or by third party providers whose services we have added to our pages. If you do not allow these cookies then some or all of these services may not function properly.
Cookies Details
Targeting Cookies
Targeting Cookies
These cookies may be set through our site by our advertising partners. They may be used by those companies to build a profile of your interests and show you relevant adverts on other sites. They do not store directly personal information, but are based on uniquely identifying your browser and internet device. If you do not allow these cookies, you will experience less targeted advertising.
Cookies Details
Back Button
Cookie List
Filter Button
Consent Leg.Interest
checkbox label label
checkbox label label
checkbox label label
Clear
checkbox label label
Apply Cancel
Confirm My Choices
Reject All Allow All


 *