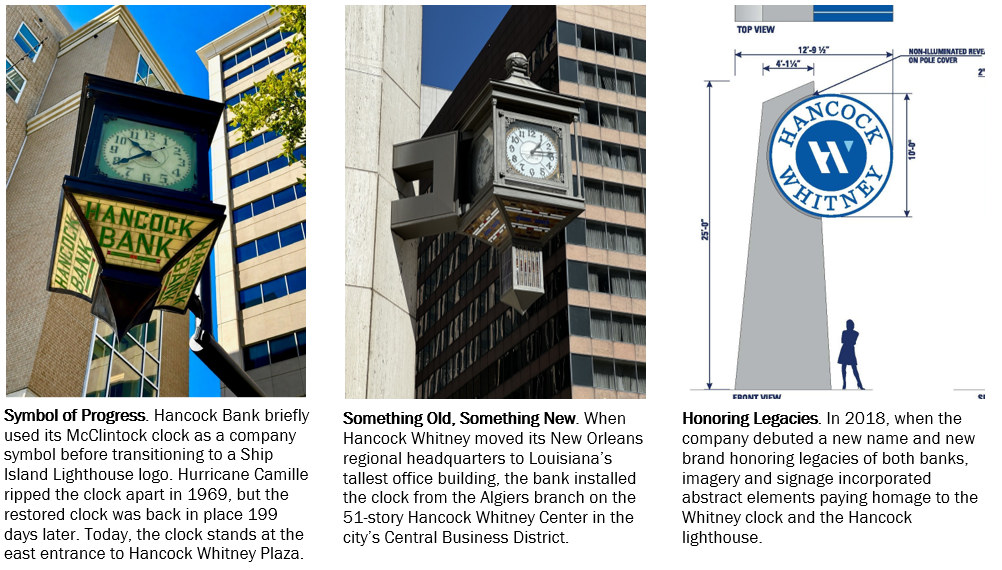
October 20, 2026 GULFPORT, Miss.--(BUSINESS WIRE)-- Hancock Whitney Corporation (Nasdaq: HWC) (“Hancock Whitney”) today announced its financial results for the third quarter of 2026. Net income for the third quarter of 2026 totaled $110.1 million, or…
October 20, 2026
GULFPORT, Miss.--(BUSINESS WIRE)-- Hancock Whitney Corporation
(Nasdaq: HWC) (“Hancock Whitney”) today announced its financial results for the third quarter of 2026. Net income for the third quarter of 2026 totaled $110.1 million, or $1.36 per diluted common share (EPS), compared to $127.0 million, or $1.55 per diluted common share, in the second quarter of 2026. On August 1, 2026, Hancock Whitney closed the acquisition of OFB Bancshares, Inc., the parent company of One Florida Bank (“OFB”). Third quarter 2026 results include a pretax charge of $30.4 million, or $0.30 per share, of supplemental disclosure items related to the acquisition of OFB. Excluding the impact of these supplemental disclosure items, EPS would be $1.66, up $0.11 linked-quarter. There were no supplemental disclosure items in the second quarter of 2026. The company reported net income for the third quarter of 2025 of $127.5 million, or $1.49 per diluted common share. There were no supplemental disclosure items in the third quarter of 2025.
Third Quarter 2026 Highlights
- Net income totaled $110.1 million, or $1.36 per diluted common share, compared to $127.0 million, or $1.55 per diluted common share in the second quarter of 2026; adjusted net income totaled $134.1 million, or $1.66 per diluted share
- Adjusted pre-provision net revenue (PPNR) totaled $189.3 million, up $11.2 million, or 6% from the prior quarter
- Loans increased $2.0 billion
- Deposits increased $2.5 billion
- Criticized commercial loans decreased and nonaccrual loans increased compared to the second quarter of 2026
- ACL coverage remained at 1.42%, unchanged from the prior quarter
- NIM of 3.61%, up 5 bp from the prior quarter
- CET1 ratio estimated at 11.53%, compared to 13.19% in the prior quarter; TCE ratio of 8.05% compared to 9.78% in the prior quarter
- Efficiency ratio of 54.46%, down 85 bps linked-quarter, compared to 55.31% in the prior quarter
“We are pleased to share another quarter of solid results for the third quarter of 2026,” said John M. Hairston, President & CEO. “Profitability remains strong with adjusted EPS of $1.66, up 7% from prior quarter, adjusted ROA of 1.41%, and an improved efficiency ratio of 54.46%. We delivered strong loan and deposit growth, while NIM expanded 5 basis points to 3.61%. Our criticized loan levels decreased during the quarter and our ACL remains robust at 1.42%. On August 1, we were pleased to welcome new colleagues and clients through the acquisition of One Florida Bank. As 2026 draws to a close, we remain committed to executing on our organic growth plan and maintaining operational efficiency and a strong capital position.”
**Loans
**Total loans were $26.5 billion at September 30, 2026, up $2.0 billion, or 8%, from June 30, 2026. Loan growth included $1.7 billion in loans acquired from OFB, as well as a legacy and post-acquisition increase in commercial real estate across multiple products and continued growth in equipment finance.
Average loans totaled $25.8 billion for the third quarter of 2026, up $1.4 billion, or 6%, linked-quarter.
**Deposits
**Total deposits at September 30, 2026 were $32.2 billion, up $2.5 billion, or 9%, from June 30, 2026. Deposit growth included $1.9 billion in deposits acquired from OFB, as well as legacy and post-acquisition activity including an increase in interest-bearing transactions and savings deposits, offset by decreases in noninterest-bearing deposits, retail time deposits and interest-bearing public fund deposits.
Noninterest-bearing deposits totaled $10.6 billion at September 30, 2026, up $217.9 million, or 2%, from June 30, 2026, and comprised 33% of total period-end deposits. This increase included $418.7 million of noninterest-bearing deposits acquired from OFB.
Interest-bearing transaction and savings deposits totaled $15.5 billion at the end of the third quarter of 2026, up $2.5 billion, or 19%, linked-quarter, including $1.2 billion acquired from OFB, and legacy and post-acquisition increases due to competitive products and pricing.
Interest-bearing public fund deposits totaled $2.6 billion at September 30, 2026, down $309.0 million, or 11%, linked-quarter, including $15.5 million acquired from OFB, and decreases due largely to seasonal outflows from our legacy public funds. Compared to June 30, 2026, retail time deposits of $3.6 billion were up $174.2 million, or 5%, including $203.0 million acquired from OFB, partially offset by a net reduction driven by maturities and repricing during the third quarter of 2026.
Average deposits for the third quarter of 2026 were $30.9 billion, up $2.1 billion, or 7%, linked-quarter.
**Asset Quality
**The total allowance for credit losses (ACL) was $375.8 million at September 30, 2026, up $27.8 million, or 8% from June 30, 2026. The increase in the ACL includes $21.9 million recorded through purchase accounting for OFB acquired loans. During the third quarter of 2026, the company recorded a provision for credit losses of $16.1 million, which includes a $1.0 million supplemental disclosure item for unfunded commitments acquired from OFB, compared to $13.8 million in the second quarter of 2026. There were no supplemental disclosure items in the second quarter of 2026. There were $10.2 million of net charge-offs in the third quarter of 2026, or 0.16% of average total loans on an annualized basis, compared to net charge-offs of $9.4 million, or 0.16% of average total loans in the second quarter of 2026. The ratio of ACL to period-end loans was 1.42% at both September 30, 2026 and June 30, 2026.
Criticized commercial loans totaled $485.3 million, or 2.29% of total commercial loans, at September 30, 2026, down $6.7 million from $492.0 million, or 2.55% of total commercial loans, at June 30, 2026. Nonaccrual loans totaled $133.3 million, or 0.50% of total loans, at September 30, 2026, compared to $113.7 million, or 0.46% of total loans, at June 30, 2026. ORE and foreclosed assets were $10.9 million at September 30, 2026, down $2.0 million, or 15%, from $12.9 million at June 30, 2026.
**Net Interest Income and Net Interest Margin (NIM) (TE)
**Net interest income (TE) for the third quarter of 2026 was $314.9 million, an increase of $19.7 million, or 7%, from the second quarter of 2026. The net interest margin (NIM) (TE) was 3.61% in the third quarter of 2026, up 5 bps linked-quarter, driven by the impact from purchase accounting accretion related to OFB (+4 bps), favorable level of other borrowings (+1 bps), and change in earning asset yield and mix (+8 bps) offset by higher cost of deposits (-8 bps).
Average earning assets were $34.8 billion for the third quarter of 2026, up $1.6 billion, or 5%, from the second quarter of 2026.
**Noninterest Income
**Noninterest income totaled $107.0 million for the third quarter of 2026, down $1.4 million from the second quarter of 2026. The third quarter of 2026 included $0.6 million of post-acquisition noninterest income from OFB.
Service charges on deposit accounts totaled $27.1 million for the third quarter of 2026, up $1.2 million, or 5%, including $0.2 million post-acquisition activity from OFB. Bank card and ATM fees were down $0.2 million, or 1%, from the second quarter of 2026, partially offset by $0.1 million post-acquisition activity from OFB.
Investment and annuity income and insurance fees were down $0.8 million, or 5%, linked-quarter. Trust fees were down $1.1 million, or 4%, linked-quarter due partially to seasonality. Fees from secondary mortgage operations totaled $2.9 million for the third quarter of 2026, down $1.2 million, or 30%, linked-quarter, due to the current rate environment.
Other noninterest income was $15.2 million in the third quarter of 2026, up $0.7 million, or 5%, from the second quarter of 2026. The increase in other noninterest income was primarily due to $0.3 million post-acquisition activity from OFB, higher SBIC income, syndications fees, and FHLB stock income, partially offset by lower derivative and BOLI income.
**Noninterest Expense & Taxes
**Noninterest expense totaled $262.0 million for the third quarter of 2026, up $36.6 million, or 16% linked-quarter. The third quarter of 2026 included $5.8 million of post-acquisition noninterest expense from OFB and $29.4 million of supplemental disclosure items related to the acquisition of OFB. There were no supplemental disclosure items in the second quarter of 2026.
Personnel expense totaled $144.8 million in the third quarter of 2026, up $14.6 million, or 11%, linked-quarter. This increase included $8.3 million of supplemental disclosure items related to the acquisition of OFB and $3.6 million of post-acquisition expense from OFB. The remaining increase in personnel expense was primarily related to the impact of new hires associated with our organic growth plan.
Net occupancy and equipment expense totaled $20.1 million in the third quarter of 2026, up $1.8 million, or 10%, from the second quarter of 2026. The increase included $0.1 million of supplemental disclosure items related to the acquisition of OFB and $0.4 million of post-acquisition expense from OFB.
Amortization of intangibles totaled $2.9 million for the third quarter of 2026, up $0.7 million, or 30%, linked-quarter, including $1.2 million of post-acquisition expense from OFB.
Net expense on ORE and other foreclosed assets totaled $0.6 million in the third quarter of 2026, compared to $0.2 million in the second quarter of 2026.
Other expenses totaled $93.7 million in the third quarter of 2026, up $19.2 million, or 26%, linked-quarter. This increase included $21.0 million of supplemental disclosure items related to the acquisition of OFB and $0.6 million of post-acquisition expense from OFB.
The effective income tax rate for the third quarter of 2026 was 22.5%, compared to 21.7% in the second quarter of 2026.
**Capital
**Common stockholders’ equity at September 30, 2026 totaled $4.2 billion, down $209.8 million, or 5%, from June 30, 2026. The tangible common equity (TCE) ratio was 8.05%, down 173 bps linked-quarter. The company’s CET1 ratio is estimated to be 11.53% at September 30, 2026, down 166 bps linked-quarter.
During the third quarter of 2026, the company repurchased one million shares of its common stock at an average price of $77.91 per share. These stock repurchases were pursuant to the company’s share buyback program (which authorizes the repurchase of up to 5%, or approximately 4.1 million shares, of the company’s outstanding common stock), which expires on December 31, 2026. Since the share buyback program’s inception, the company has repurchased 3,112,966 shares of its common stock under this share buyback program.
**Conference Call and Slide Presentation
**Management will host a conference call for analysts and investors at 3:30 p.m. Central Time on Tuesday, October 20, 2026 to review third quarter 2026 results. A live listen-only webcast of the call will be available under the Investor Relations section of Hancock Whitney’s website at investors.hancockwhitney.com
. A link to the release with additional financial tables, and a link to a slide presentation related to third quarter 2026 results are also posted as part of the webcast link. To participate in the Q&A portion of the call, dial 833-461-5787, access code 662024071.
A replay of the conference call will be available under the Investor Relations section of our website.
**About Hancock Whitney
**Since the late 1800s, Hancock Whitney has embodied core values of Honor & Integrity, Strength & Stability, Commitment to Service, Teamwork, and Personal Responsibility. Hancock Whitney offices and financial centers in Mississippi, Alabama, Florida, Louisiana, and Texas offer comprehensive financial products and services, including traditional and online banking; commercial and small business banking; private banking; trust and investment services; healthcare banking; and mortgage services. The company also operates combined loan and deposit production offices in the greater metropolitan areas of Nashville, Tennessee, and Atlanta, Georgia. More information is available at www.hancockwhitney.com
.
**Non-GAAP Financial Measures
**This news release includes non-GAAP financial measures to describe Hancock Whitney’s performance. These non-GAAP financial measures should not be considered alternatives to GAAP-basis financial statements and other bank holding companies may define or calculate these non-GAAP measures or similar measures differently. The reconciliations of those measures to GAAP measures are provided either in the financial tables or in Appendix A thereto.
Consistent with the provisions of subpart 229.1400 of the Securities and Exchange Commission’s Regulation S-K, “Disclosures by Bank and Savings and Loan Registrants,” the company presents net interest income, net interest margin and efficiency ratios on a fully taxable equivalent (“TE”) basis. The TE basis adjusts for the tax-favored status of net interest income from certain loans and investments using the statutory federal tax rate to increase tax-exempt interest income to a taxable equivalent basis. The company believes this measure to be the preferred industry measurement of net interest income and it enhances comparability of net interest income arising from taxable and tax-exempt sources.
The company presents certain additional non-GAAP financial measures to assist the reader with a better understanding of the company’s performance period over period, as well as to provide investors with assistance in understanding the success management has experienced in executing its strategic initiatives. The company highlights certain items that are outside of our principal business and/or are not indicative of forward-looking trends in supplemental disclosures items below our GAAP financial data and presents certain “Adjusted” ratios that exclude these disclosed items. These adjusted ratios provide management or the reader with a measure that may be more indicative of forward-looking trends in our business, as well as demonstrates the effects of significant gains or losses and changes.
We define Adjusted Pre-Provision Net Revenue as net income excluding provision expense and income tax expense, plus the taxable equivalent adjustment (as defined above), less supplemental disclosure items (as defined above). Management believes that adjusted pre-provision net revenue is a useful financial measure because it enables investors and others to assess the company’s ability to generate capital to cover credit losses through a credit cycle. We define Adjusted Revenue as net interest income (te) and noninterest income less supplemental disclosure items. We define Adjusted Noninterest Expense as noninterest expense less supplemental disclosure items. We define our Efficiency Ratio as noninterest expense to total net interest income (te) and noninterest income, excluding amortization of purchased intangibles and supplemental disclosure items, if applicable. We define Adjusted Earnings Per Common Share – Diluted as GAAP diluted earnings per common share, adjusted for the after-tax effect of supplemental disclosure items using the applicable federal statutory tax rate. Management believes adjusted revenue, adjusted noninterest expense, the efficiency ratio and adjusted earnings per common share - diluted are useful measures as they provide a greater understanding of ongoing operations and enhance comparability with prior periods.
**Important Cautionary Statement about Forward-Looking Statements
**This release contains forward-looking statements within the meaning of section 27A of the Securities Act of 1933, as amended, and section 21E of the Securities Exchange Act of 1934, as amended. Forward-looking statements that we may make include statements regarding our expectations of our performance and financial condition, balance sheet and revenue growth, the provision for credit losses, capital levels, deposits (including growth, pricing, and betas), investment portfolio, other sources of liquidity, loan growth expectations, management’s predictions about charge-offs for loans, the impact of current and future economic conditions, including the effects of declines in the real estate market, tariffs or trade wars (including reduced consumer spending, lower economic growth or recession, reduced demand for U.S. exports, disruptions to supply chains, and decreased demand for other banking products and services), high unemployment, inflationary pressures, increasing insurance costs, fluctuations in interest rates, including the impact of changes in interest rates on our financial projections, models and guidance and slowdowns in economic growth, as well as the financial stress on borrowers as a result of the foregoing, general economic business conditions in our local markets, Federal Reserve action with respect to interest rates, the effects of war or other conflicts, acts of terrorism, climate change, the impact of natural or man-made disasters, the adequacy of our enterprise risk management framework, potential claims, damages, penalties, fines and reputational damage resulting from pending or future litigation, regulatory proceedings, assessments, and enforcement actions, as well as the impact of negative developments affecting the banking industry and the resulting media coverage; the timing, benefits, costs and synergies of the merger with One Florida Bank, as well as statements regarding the potential impact of current or future business combinations on our performance and financial condition, including our ability to successfully identify acquisition targets and integrate the businesses, success of revenue-generating and cost reduction initiatives, the potential impact of third-party business combinations in our footprint on our performance and financial condition, the effectiveness of derivative financial instruments and hedging activities to manage risks, projected tax rates, increased cybersecurity risks, including potential business disruptions or financial losses, and the impact of artificial intelligence on our business operations, the adequacy of our internal controls over financial and non-financial reporting, the impact of changes in U.S. laws or policies, including those related to credit card interest rates, the financial impact of regulatory requirements and tax reform legislation, deposit trends, credit quality trends, net interest margin trends, future expense levels, future profitability, supplemental disclosure items, improvements in expense to revenue (efficiency) ratio, purchase accounting impacts and expected returns. Also, any statement that does not describe historical or current facts is a forward-looking statement. These statements often include the words “believes,” “expects,” “anticipates,” “estimates,” “intends,” “plans,” “forecast,” “goals,” “targets,” “initiatives,” “focus,” “potentially,” “probably,” “projects,” “outlook," or similar expressions or future conditional verbs such as “may,” “will,” “should,” “would,” and “could.” Forward-looking statements are based upon the current beliefs and expectations of management and on information currently available to management. Our statements speak as of the date hereof, and we do not assume any obligation to update these statements or to update the reasons why actual results could differ from those contained in such statements in light of new information or future events.
Forward-looking statements are subject to significant risks and uncertainties. Any forward-looking statement made in this release is subject to the safe harbor protections set forth in the Private Securities Litigation Reform Act of 1995. Investors are cautioned against placing undue reliance on such statements. Actual results may differ materially from those set forth in the forward-looking statements. Additional factors that could cause actual results to differ materially from those described in the forward-looking statements can be found in Part I, “Item 1A. Risk Factors” in our Annual Report on Form 10-K for the year ended December 31, 2025, and in other periodic reports that we file with the SEC.
|
|
|
|
|
|
|
|
|
|
|
|
|
|
|
|
|
|
|
|
|
|
|
|
|
|
|
|
|
|
|
|
|
|
|
|
|
|
|
|
|
|
|
|
|
|
|
|
|
|
|
|
|
|
|
|
|
|
|
|
|
|
|
|
|
|
|
|
|
|
|
|
|
|
|
|
|
|
|
|
|
|
|
|
| HANCOCK WHITNEY CORPORATION |
|
|
|
|
|
|
|
|
|
|
|
|
|
|
|
|
|
|
|
|
| FINANCIAL HIGHLIGHTS |
|
|
|
|
|
|
|
|
|
|
|
|
|
|
|
|
|
|
|
|
| (Unaudited) |
|
|
|
|
|
|
|
|
|
|
|
|
|
|
|
|
|
|
|
|
|
|
|
|
|
|
|
|
|
|
|
|
|
|
|
|
|
|
|
|
|
|
|
Three Months Ended |
|
|
|
|
|
|
|
|
|
|
|
Nine Months Ended |
|
|
|
|
|
|
| (dollars and common share data in thousands, except per share amounts) |
|
9/30/2026 |
|
|
|
6/30/2026 |
|
|
|
9/30/2025 |
|
|
|
9/30/2026 |
|
|
|
9/30/2025 |
|
|
| NET INCOME |
|
|
|
|
|
|
|
|
|
|
|
|
|
|
|
|
|
|
|
|
| Net interest income |
|
$ |
313,107 |
|
|
$ |
293,012 |
|
|
$ |
279,738 |
|
|
$ |
891,284 |
|
|
$ |
826,602 |
|
| Net interest income (TE) (a) |
|
|
314,898 |
|
|
|
295,225 |
|
|
|
282,309 |
|
|
|
897,689 |
|
|
|
834,475 |
|
| Provision for credit losses |
|
|
16,097 |
|
|
|
13,775 |
|
|
|
12,651 |
|
|
|
43,044 |
|
|
|
38,038 |
|
| Noninterest income |
|
|
107,011 |
|
|
|
108,350 |
|
|
|
106,001 |
|
|
|
222,843 |
|
|
|
299,316 |
|
| Noninterest expense |
|
|
262,001 |
|
|
|
225,436 |
|
|
|
212,753 |
|
|
|
708,185 |
|
|
|
633,791 |
|
| Income tax expense |
|
|
31,964 |
|
|
|
35,190 |
|
|
|
32,869 |
|
|
|
78,459 |
|
|
|
93,588 |
|
| Net income |
|
$ |
110,056 |
|
|
$ |
126,961 |
|
|
$ |
127,466 |
|
|
$ |
284,439 |
|
|
$ |
360,501 |
|
| Supplemental disclosure items - included above, pre-tax |
|
|
|
|
|
|
|
|
|
|
|
|
|
|
|
|
|
|
|
|
| Included in provision for credit losses |
|
|
|
|
|
|
|
|
|
|
|
|
|
|
|
|
|
|
|
|
| OFB Bancshares, Inc. acquired unfunded provision |
|
$ |
1,036 |
|
|
$ |
— |
|
|
$ |
— |
|
|
$ |
1,036 |
|
|
$ |
— |
|
| Included in noninterest income |
|
|
|
|
|
|
|
|
|
|
|
|
|
|
|
|
|
|
|
|
| Loss on securities portfolio restructure |
|
|
— |
|
|
|
— |
|
|
|
— |
|
|
|
98,595 |
|
|
|
— |
|
| Included in noninterest expense |
|
|
|
|
|
|
|
|
|
|
|
|
|
|
|
|
|
|
|
|
| OFB Bancshares, Inc. acquisition expense |
|
|
29,350 |
|
|
|
— |
|
|
|
— |
|
|
|
29,350 |
|
|
|
— |
|
| Sabal Trust Company acquisition expense |
|
|
— |
|
|
|
— |
|
|
|
— |
|
|
|
— |
|
|
|
5,911 |
|
| PERIOD-END BALANCE SHEET DATA |
|
|
|
|
|
|
|
|
|
|
|
|
|
|
|
|
|
|
|
|
| Loans |
|
$ |
26,540,423 |
|
|
$ |
24,580,173 |
|
|
$ |
23,596,565 |
|
|
$ |
26,540,423 |
|
|
$ |
23,596,565 |
|
| Securities |
|
|
7,758,273 |
|
|
|
7,891,359 |
|
|
|
7,991,281 |
|
|
|
7,758,273 |
|
|
|
7,991,281 |
|
| Earning assets |
|
|
34,962,230 |
|
|
|
33,039,464 |
|
|
|
32,532,320 |
|
|
|
34,962,230 |
|
|
|
32,532,320 |
|
| Total assets |
|
|
38,583,463 |
|
|
|
36,345,972 |
|
|
|
35,766,407 |
|
|
|
38,583,463 |
|
|
|
35,766,407 |
|
| Noninterest-bearing deposits |
|
|
10,554,777 |
|
|
|
10,336,866 |
|
|
|
10,305,303 |
|
|
|
10,554,777 |
|
|
|
10,305,303 |
|
| Total deposits |
|
|
32,177,308 |
|
|
|
29,629,760 |
|
|
|
28,659,750 |
|
|
|
32,177,308 |
|
|
|
28,659,750 |
|
| Common stockholders' equity |
|
|
4,234,341 |
|
|
|
4,444,134 |
|
|
|
4,474,479 |
|
|
|
4,234,341 |
|
|
|
4,474,479 |
|
| AVERAGE BALANCE SHEET DATA |
|
|
|
|
|
|
|
|
|
|
|
|
|
|
|
|
|
|
|
|
| Loans |
|
$ |
25,766,152 |
|
|
$ |
24,339,904 |
|
|
$ |
23,425,895 |
|
|
$ |
24,697,277 |
|
|
$ |
23,249,212 |
|
| Securities (b) |
|
|
8,284,750 |
|
|
|
8,285,594 |
|
|
|
8,383,771 |
|
|
|
8,278,745 |
|
|
|
8,299,542 |
|
| Earning assets |
|
|
34,766,919 |
|
|
|
33,205,847 |
|
|
|
32,213,632 |
|
|
|
33,564,776 |
|
|
|
32,106,914 |
|
| Total assets |
|
|
37,591,325 |
|
|
|
35,881,537 |
|
|
|
34,751,209 |
|
|
|
36,305,606 |
|
|
|
34,546,116 |
|
| Noninterest-bearing deposits |
|
|
10,383,038 |
|
|
|
10,104,015 |
|
|
|
10,121,707 |
|
|
|
10,174,635 |
|
|
|
10,200,640 |
|
| Total deposits |
|
|
30,924,820 |
|
|
|
28,780,937 |
|
|
|
28,492,076 |
|
|
|
29,521,157 |
|
|
|
28,630,511 |
|
| Common stockholders' equity |
|
|
4,389,908 |
|
|
|
4,420,837 |
|
|
|
4,368,746 |
|
|
|
4,423,927 |
|
|
|
4,279,294 |
|
| COMMON SHARE DATA |
|
|
|
|
|
|
|
|
|
|
|
|
|
|
|
|
|
|
|
|
| Earnings per share - diluted |
|
$ |
1.36 |
|
|
$ |
1.55 |
|
|
$ |
1.49 |
|
|
$ |
3.48 |
|
|
$ |
4.17 |
|
| Cash dividends per share |
|
|
0.50 |
|
|
|
0.50 |
|
|
|
0.45 |
|
|
|
1.50 |
|
|
|
1.35 |
|
| Book value per share (period-end) |
|
|
53.27 |
|
|
|
55.23 |
|
|
|
52.82 |
|
|
|
53.27 |
|
|
|
52.82 |
|
| Tangible book value per share (period-end) |
|
|
37.83 |
|
|
|
42.95 |
|
|
|
41.07 |
|
|
|
37.83 |
|
|
|
41.07 |
|
| Weighted average number of shares - diluted |
|
|
80,612 |
|
|
|
81,485 |
|
|
|
85,453 |
|
|
|
81,445 |
|
|
|
85,977 |
|
| Period-end number of shares |
|
|
79,493 |
|
|
|
80,471 |
|
|
|
84,711 |
|
|
|
79,493 |
|
|
|
84,711 |
|
| Market data |
|
|
|
|
|
|
|
|
|
|
|
|
|
|
|
|
|
|
|
|
| High sales price |
|
$ |
80.13 |
|
|
$ |
75.25 |
|
|
$ |
64.66 |
|
|
$ |
80.13 |
|
|
$ |
64.66 |
|
| Low sales price |
|
|
71.67 |
|
|
|
62.16 |
|
|
|
56.87 |
|
|
|
59.97 |
|
|
|
43.90 |
|
| Period-end closing price |
|
|
72.04 |
|
|
|
74.72 |
|
|
|
62.61 |
|
|
|
72.04 |
|
|
|
62.61 |
|
| Trading volume |
|
|
53,095 |
|
|
|
55,444 |
|
|
|
51,077 |
|
|
|
162,212 |
|
|
|
136,219 |
|
| PERFORMANCE RATIOS |
|
|
|
|
|
|
|
|
|
|
|
|
|
|
|
|
|
|
|
|
| Return on average assets |
|
|
1.16 |
% |
|
|
1.42 |
% |
|
|
1.46 |
% |
|
|
1.05 |
% |
|
|
1.40 |
% |
| Return on average common equity |
|
|
9.95 |
% |
|
|
11.52 |
% |
|
|
11.58 |
% |
|
|
8.60 |
% |
|
|
11.26 |
% |
| Return on average tangible common equity |
|
|
13.46 |
% |
|
|
14.84 |
% |
|
|
15.00 |
% |
|
|
11.25 |
% |
|
|
14.48 |
% |
| Tangible common equity ratio (c) |
|
|
8.05 |
% |
|
|
9.78 |
% |
|
|
10.01 |
% |
|
|
8.05 |
% |
|
|
10.01 |
% |
| Net interest margin (TE) |
|
|
3.61 |
% |
|
|
3.56 |
% |
|
|
3.49 |
% |
|
|
3.57 |
% |
|
|
3.47 |
% |
| Noninterest income as a percentage of total revenue (TE) |
|
|
25.36 |
% |
|
|
26.85 |
% |
|
|
27.30 |
% |
|
|
19.89 |
% |
|
|
26.40 |
% |
| Efficiency ratio (d) |
|
|
54.46 |
% |
|
|
55.31 |
% |
|
|
54.10 |
% |
|
|
55.05 |
% |
|
|
54.73 |
% |
| Average loan/deposit ratio |
|
|
83.32 |
% |
|
|
84.57 |
% |
|
|
82.22 |
% |
|
|
83.66 |
% |
|
|
81.20 |
% |
| Allowance for loan losses as a percentage of period-end loans |
|
|
1.28 |
% |
|
|
1.27 |
% |
|
|
1.33 |
% |
|
|
1.28 |
% |
|
|
1.33 |
% |
| Allowance for credit losses as a percentage of period-end loans (e) |
|
|
1.42 |
% |
|
|
1.42 |
% |
|
|
1.45 |
% |
|
|
1.42 |
% |
|
|
1.45 |
% |
| Annualized net charge-offs to average loans |
|
|
0.16 |
% |
|
|
0.16 |
% |
|
|
0.19 |
% |
|
|
0.17 |
% |
|
|
0.23 |
% |
| Allowance for loan losses as a % of nonaccrual loans |
|
|
254.74 |
% |
|
|
274.99 |
% |
|
|
276.20 |
% |
|
|
254.74 |
% |
|
|
276.20 |
% |
| FTE headcount |
|
|
3,803 |
|
|
|
3,674 |
|
|
|
3,603 |
|
|
|
3,803 |
|
|
|
3,603 |
|
|
|
|
|
|
|
|
|
|
|
|
|
|
|
|
|
|
|
|
|
|
| (a) Taxable equivalent (TE) amounts are calculated using a federal income tax rate of 21%. |
|
|
|
|
|
|
|
|
|
|
|
|
|
|
|
|
|
|
|
|
| (b) Average securities does not include unrealized holding gains/losses on available for sale securities. |
|
|
|
|
|
|
|
|
|
|
|
|
|
|
|
|
|
|
|
|
| (c) The tangible common equity ratio is common shareholders' equity less intangible assets divided by total assets less intangible assets. |
|
|
|
|
|
|
|
|
|
|
|
|
|
|
|
|
|
|
|
|
| (d) The efficiency ratio is noninterest expense to total net interest income (TE) and noninterest income, excluding amortization of purchased intangibles and supplemental disclosure items noted above. |
|
|
|
|
|
|
|
|
|
|
|
|
|
|
|
|
|
|
|
|
| (e) The allowance for credit losses includes the allowance for loan and lease losses and the reserve for unfunded lending commitments. |
|
|
|
|
|
|
|
|
|
|
|
|
|
|
|
|
|
|
|
|
|
|
|
|
|
|
|
|
|
|
|
|
|
|
|
|
|
|
|
|
|
|
|
|
|
|
|
|
|
|
|
|
|
|
|
|
|
|
|
|
|
|
|
|
|
|
|
|
|
|
|
|
|
|
|
|
|
|
|
|
|
|
|
|
|
|
|
|
|
|
|
|
|
|
|
|
|
|
|
|
|
|
|
|
|
|
|
|
|
|
|
|
|
|
|
|
|
|
|
|
|
|
|
|
|
| HANCOCK WHITNEY CORPORATION |
|
|
|
|
|
|
|
|
|
|
|
|
|
|
|
|
|
|
|
|
| QUARTERLY FINANCIAL HIGHLIGHTS |
|
|
|
|
|
|
|
|
|
|
|
|
|
|
|
|
|
|
|
|
| (Unaudited) |
|
|
|
|
|
|
|
|
|
|
|
|
|
|
|
|
|
|
|
|
|
|
|
|
|
|
|
|
|
|
|
|
|
|
|
|
|
|
|
|
|
|
|
Three Months Ended |
|
|
|
|
|
|
|
|
|
|
|
|
|
|
|
|
|
|
| (dollars and common share data in thousands, except per share amounts) |
|
9/30/2026 |
|
|
|
6/30/2026 |
|
|
|
3/31/2026 |
|
|
|
12/31/2025 |
|
|
|
9/30/2025 |
|
|
| NET INCOME |
|
|
|
|
|
|
|
|
|
|
|
|
|
|
|
|
|
|
|
|
| Net interest income |
|
$ |
313,107 |
|
|
$ |
293,012 |
|
|
$ |
285,165 |
|
|
$ |
282,170 |
|
|
$ |
279,738 |
|
| Net interest income (TE) (a) |
|
|
314,898 |
|
|
|
295,225 |
|
|
|
287,566 |
|
|
|
284,675 |
|
|
|
282,309 |
|
| Provision for credit losses |
|
|
16,097 |
|
|
|
13,775 |
|
|
|
13,172 |
|
|
|
13,145 |
|
|
|
12,651 |
|
| Noninterest income |
|
|
107,011 |
|
|
|
108,350 |
|
|
|
7,482 |
|
|
|
107,131 |
|
|
|
106,001 |
|
| Noninterest expense |
|
|
262,001 |
|
|
|
225,436 |
|
|
|
220,748 |
|
|
|
217,850 |
|
|
|
212,753 |
|
| Income tax expense |
|
|
31,964 |
|
|
|
35,190 |
|
|
|
11,305 |
|
|
|
32,734 |
|
|
|
32,869 |
|
| Net income |
|
$ |
110,056 |
|
|
$ |
126,961 |
|
|
$ |
47,422 |
|
|
$ |
125,572 |
|
|
$ |
127,466 |
|
| Supplemental disclosure items - included above, pre-tax |
|
|
|
|
|
|
|
|
|
|
|
|
|
|
|
|
|
|
|
|
| Included in provision for credit losses |
|
|
|
|
|
|
|
|
|
|
|
|
|
|
|
|
|
|
|
|
| OFB Bancshares, Inc. acquired unfunded provision |
|
$ |
1,036 |
|
|
$ |
— |
|
|
$ |
— |
|
|
$ |
— |
|
|
$ |
— |
|
| Included in noninterest income |
|
|
|
|
|
|
|
|
|
|
|
|
|
|
|
|
|
|
|
|
| Loss on securities portfolio restructure |
|
|
— |
|
|
|
— |
|
|
|
98,595 |
|
|
|
— |
|
|
|
— |
|
| Included in noninterest expense |
|
|
|
|
|
|
|
|
|
|
|
|
|
|
|
|
|
|
|
|
| OFB Bancshares, Inc. acquisition expense |
|
|
29,350 |
|
|
|
— |
|
|
|
— |
|
|
|
— |
|
|
|
— |
|
| PERIOD-END BALANCE SHEET DATA |
|
|
|
|
|
|
|
|
|
|
|
|
|
|
|
|
|
|
|
|
| Loans |
|
$ |
26,540,423 |
|
|
$ |
24,580,173 |
|
|
$ |
23,991,840 |
|
|
$ |
23,958,440 |
|
|
$ |
23,596,565 |
|
| Securities |
|
|
7,758,273 |
|
|
|
7,891,359 |
|
|
|
8,028,014 |
|
|
|
8,094,799 |
|
|
|
7,991,281 |
|
| Earning assets |
|
|
34,962,230 |
|
|
|
33,039,464 |
|
|
|
32,306,650 |
|
|
|
32,218,663 |
|
|
|
32,532,320 |
|
| Total assets |
|
|
38,583,463 |
|
|
|
36,345,972 |
|
|
|
35,542,126 |
|
|
|
35,472,762 |
|
|
|
35,766,407 |
|
| Noninterest-bearing deposits |
|
|
10,554,777 |
|
|
|
10,336,866 |
|
|
|
10,344,878 |
|
|
|
10,374,991 |
|
|
|
10,305,303 |
|
| Total deposits |
|
|
32,177,308 |
|
|
|
29,629,760 |
|
|
|
29,082,134 |
|
|
|
29,279,774 |
|
|
|
28,659,750 |
|
| Common stockholders' equity |
|
|
4,234,341 |
|
|
|
4,444,134 |
|
|
|
4,419,592 |
|
|
|
4,460,117 |
|
|
|
4,474,479 |
|
| AVERAGE BALANCE SHEET DATA |
|
|
|
|
|
|
|
|
|
|
|
|
|
|
|
|
|
|
|
|
| Loans |
|
$ |
25,766,152 |
|
|
$ |
24,339,904 |
|
|
$ |
23,965,993 |
|
|
$ |
23,715,763 |
|
|
$ |
23,425,895 |
|
| Securities (b) |
|
|
8,284,750 |
|
|
|
8,285,594 |
|
|
|
8,265,682 |
|
|
|
8,484,162 |
|
|
|
8,383,771 |
|
| Earning assets |
|
|
34,766,919 |
|
|
|
33,205,847 |
|
|
|
32,698,837 |
|
|
|
32,598,315 |
|
|
|
32,213,632 |
|
| Total assets |
|
|
37,591,325 |
|
|
|
35,881,537 |
|
|
|
35,420,096 |
|
|
|
35,227,286 |
|
|
|
34,751,209 |
|
| Noninterest-bearing deposits |
|
|
10,383,038 |
|
|
|
10,104,015 |
|
|
|
10,033,006 |
|
|
|
10,165,806 |
|
|
|
10,121,707 |
|
| Total deposits |
|
|
30,924,820 |
|
|
|
28,780,937 |
|
|
|
28,834,747 |
|
|
|
28,816,539 |
|
|
|
28,492,076 |
|
| Common stockholders' equity |
|
|
4,389,908 |
|
|
|
4,420,837 |
|
|
|
4,461,827 |
|
|
|
4,417,711 |
|
|
|
4,368,746 |
|
| COMMON SHARE DATA |
|
|
|
|
|
|
|
|
|
|
|
|
|
|
|
|
|
|
|
|
| Earnings per share - diluted |
|
$ |
1.36 |
|
|
$ |
1.55 |
|
|
$ |
0.57 |
|
|
$ |
1.49 |
|
|
$ |
1.49 |
|
| Cash dividends per share |
|
|
0.50 |
|
|
|
0.50 |
|
|
|
0.50 |
|
|
|
0.45 |
|
|
|
0.45 |
|
| Book value per share (period-end) |
|
|
53.27 |
|
|
|
55.23 |
|
|
|
54.46 |
|
|
|
54.22 |
|
|
|
52.82 |
|
| Tangible book value per share (period-end) |
|
|
37.83 |
|
|
|
42.95 |
|
|
|
42.26 |
|
|
|
|
|
|
|
41.07 |
|
| Weighted average number of shares - diluted |
|
|
80,612 |
|
|
|
81,485 |
|
|
|
82,261 |
|
|
|
83,791 |
|
|
|
85,453 |
|
| Period-end number of shares |
|
|
79,493 |
|
|
|
80,471 |
|
|
|
81,152 |
|
|
|
82,259 |
|
|
|
84,711 |
|
| Market data |
|
|
|
|
|
|
|
|
|
|
|
|
|
|
|
|
|
|
|
|
| High sales price |
|
$ |
80.13 |
|
|
$ |
75.25 |
|
|
$ |
75.43 |
|
|
$ |
67.10 |
|
|
$ |
64.66 |
|
| Low sales price |
|
|
71.67 |
|
|
|
62.16 |
|
|
|
59.97 |
|
|
|
54.05 |
|
|
|
56.87 |
|
| Period-end closing price |
|
|
72.04 |
|
|
|
74.72 |
|
|
|
63.59 |
|
|
|
63.68 |
|
|
|
62.61 |
|
| Trading volume |
|
|
53,095 |
|
|
|
55,444 |
|
|
|
53,673 |
|
|
|
55,269 |
|
|
|
51,077 |
|
| PERFORMANCE RATIOS |
|
|
|
|
|
|
|
|
|
|
|
|
|
|
|
|
|
|
|
|
| Return on average assets |
|
|
1.16 |
% |
|
|
1.42 |
% |
|
|
0.54 |
% |
|
|
1.41 |
% |
|
|
1.46 |
% |
| Return on average common equity |
|
|
9.95 |
% |
|
|
11.52 |
% |
|
|
4.31 |
% |
|
|
11.28 |
% |
|
|
11.58 |
% |
| Return on average tangible common equity |
|
|
13.46 |
% |
|
|
14.84 |
% |
|
|
5.54 |
% |
|
|
14.55 |
% |
|
|
15.00 |
% |
| Tangible common equity ratio (c) |
|
|
8.05 |
% |
|
|
9.78 |
% |
|
|
9.93 |
% |
|
|
10.06 |
% |
|
|
10.01 |
% |
| Net interest margin (TE) |
|
|
3.61 |
% |
|
|
3.56 |
% |
|
|
3.55 |
% |
|
|
3.48 |
% |
|
|
3.49 |
% |
| Noninterest income as a percentage of total revenue (TE) |
|
|
25.36 |
% |
|
|
26.85 |
% |
|
|
2.54 |
% |
|
|
27.34 |
% |
|
|
27.30 |
% |
| Efficiency ratio (d) |
|
|
54.46 |
% |
|
|
55.31 |
% |
|
|
55.43 |
% |
|
|
54.93 |
% |
|
|
54.10 |
% |
| Average loan/deposit ratio |
|
|
83.32 |
% |
|
|
84.57 |
% |
|
|
83.11 |
% |
|
|
82.30 |
% |
|
|
82.22 |
% |
| Allowance for loan losses as a percentage of period-end loans |
|
|
1.28 |
% |
|
|
1.27 |
% |
|
|
1.30 |
% |
|
|
1.28 |
% |
|
|
1.33 |
% |
| Allowance for credit losses as a percentage of period-end loans (e) |
|
|
1.42 |
% |
|
|
1.42 |
% |
|
|
1.43 |
% |
|
|
1.43 |
% |
|
|
1.45 |
% |
| Annualized net charge-offs to average loans |
|
|
0.16 |
% |
|
|
0.16 |
% |
|
|
0.19 |
% |
|
|
0.22 |
% |
|
|
0.19 |
% |
| Allowance for loan losses as a % of nonaccrual loans |
|
|
254.74 |
% |
|
|
274.99 |
% |
|
|
274.67 |
% |
|
|
287.95 |
% |
|
|
276.20 |
% |
| FTE headcount |
|
|
3,803 |
|
|
|
3,674 |
|
|
|
3,658 |
|
|
|
3,627 |
|
|
|
3,603 |
|
|
|
|
|
|
|
|
|
|
|
|
|
|
|
|
|
|
|
|
|
|
| (a) Taxable equivalent (TE) amounts are calculated using a federal income tax rate of 21%. |
|
|
|
|
|
|
|
|
|
|
|
|
|
|
|
|
|
|
|
|
| (b) Average securities does not include unrealized holding gains/losses on available for sale securities. |
|
|
|
|
|
|
|
|
|
|
|
|
|
|
|
|
|
|
|
|
| (c) The tangible common equity ratio is common shareholders' equity less intangible assets divided by total assets less intangible assets. |
|
|
|
|
|
|
|
|
|
|
|
|
|
|
|
|
|
|
|
|
| (d) The efficiency ratio is noninterest expense to total net interest income (TE) and noninterest income, excluding amortization of purchased intangibles and supplemental disclosure items noted above. |
|
|
|
|
|
|
|
|
|
|
|
|
|
|
|
|
|
|
|
|
| (e) The allowance for credit losses includes the allowance for loan and lease losses and the reserve for unfunded lending commitments. |
|
|
|
|
|
|
|
|
|
|
|
|
|
|
|
|
|
|
|
|
|
|
|
|
|
|
|
|
|
|
|
|
|
|
|
|
|
|
|
|
|
|
|
|
|
|
|
|
|
|
|
|
|
|
|
|
|
|
|
|
|
|
Ashleigh Flower Wilshire, SVP, Head of Investor Relations
504.299.5076 or [email protected]
Source: Hancock Whitney Corporation
View All News
Proud to be an Official Sponsor of

Quick Links
Investor Email Alerts
Personal Information
Email Address *Required Email Address is required. Email Address is invalid.
Investor Alert Options *
- News / Press Releases
- SEC Filings
- Stock Information
- Financial Documents
- Presentations
Investor Alert Options is required.
The captcha test has failed. Please try again.
Submit
Unsubscribe
Gap List Fix

© 2026 Hancock Whitney Corporation - All rights reserved
Powered By Q4 Inc. 5.191.0.1 (opens in new window)
Hancock Whitney Bank, Member FDIC and Equal Housing Lender Logo Equal Housing Lender. All loans and accounts subject to credit approval. Terms and conditions apply.
Hancock Whitney and the Hancock Whitney logo are federally-registered trademarks of Hancock Whitney Corporation. © Hancock Whitney 2025
















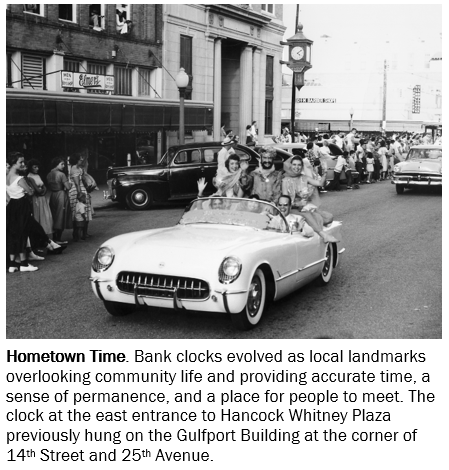
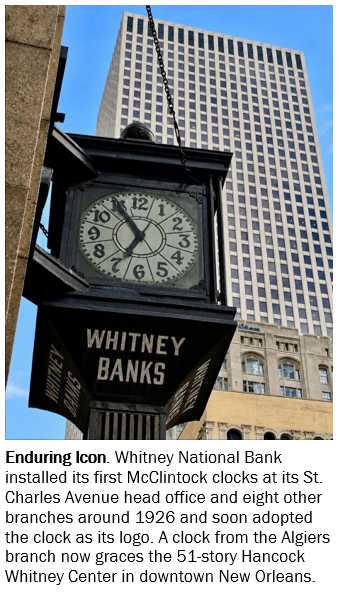 The clocks soon became so closely identified with the bank that Whitney adopted its clock as its logo.