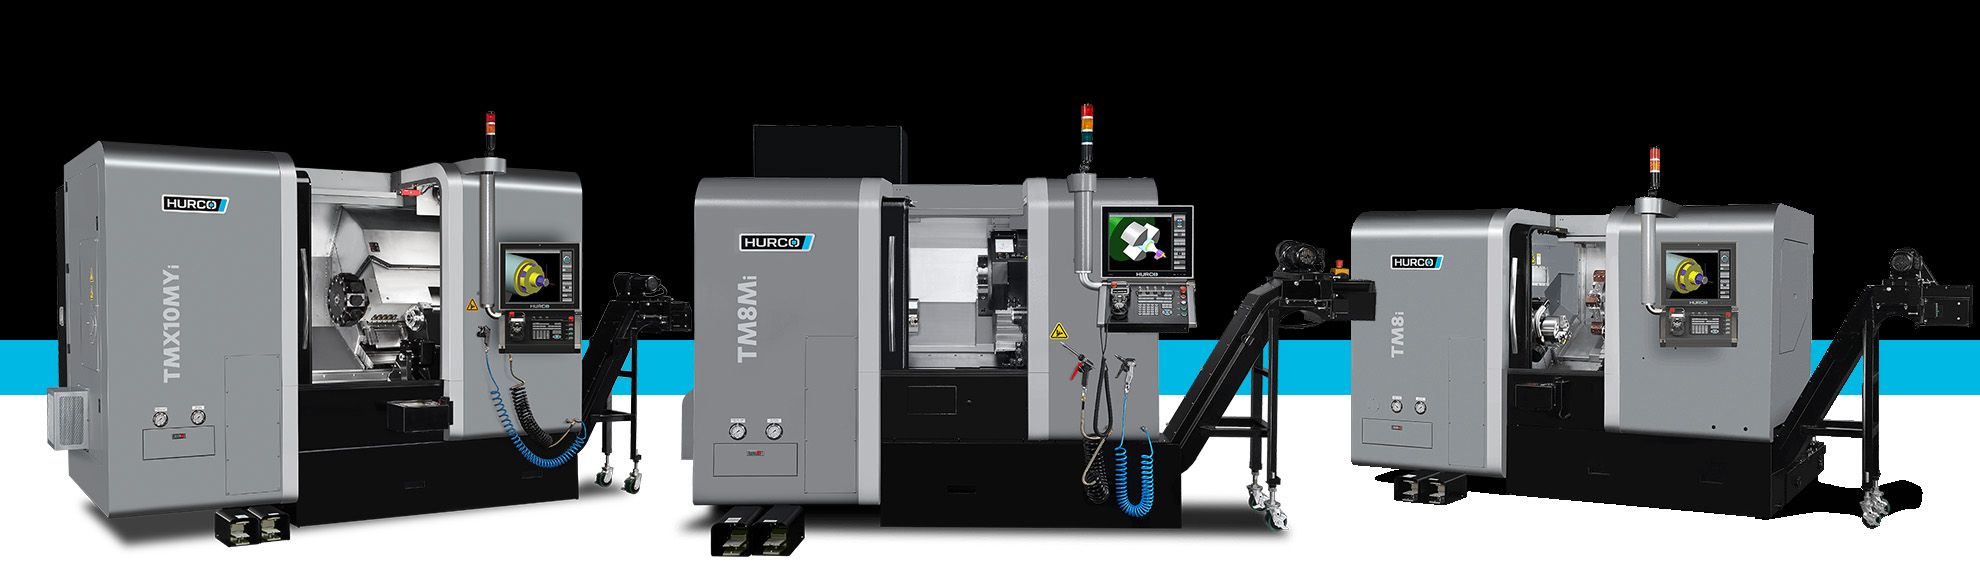
HURC
Fiscal year ends October Quarters are offset from the calendar — Q1 is Nov–Jan

Hurco Companies, Inc. is an industrial technology company that designs, manufactures, and sells computerized numerical control (CNC) machine tools, primarily vertical machining centers and turning centers, to the metal cutting industry. The company operates through three main brands: Hurco, which features proprietary interactive computer control systems and conversational programming software; Milltronics, a value-tier brand for cost-effective machining; and Takumi, which offers high-precision machines equipped with industry-standard controls for die and mold, aerospace, and medical applications. Hurco also provides automation integration solutions through its subsidiary ProCobots, including collaborative robots and machine tending systems, and manufactures high-value machine tool components via LCM Precision Technology. The company serves customers worldwide through a global sales, service, and distribution network, with manufacturing and assembly operations in the United States, Italy, and Taiwan. Founded in 1968, Hurco pioneered the application of microprocessor technology and interactive programming in machine tools, offering a comprehensive portfolio of capital goods, software, and support services for manufacturing productivity.

Summarised from the company's own disclosures, fiscal year ended Jan 2026

Industry Specialty Industrial Machinery Homepage hurco.com
Sector Industrials IR page global.hurco.com/gb/pages/singapore.aspx
Tags
cnc machine tools, vertical machining centers, turning centers, conversational programming, job shop automation, collaborative robots, die and mold, aerospace manufacturing, medical device manufacturing, metal cutting, Hurco, Milltronics, Takumi, ProCobots, LCM Precision Technology S.r.l., WinMax, MAX5 Control, Hurco Connect, Roeders
Press page global.hurco.com/en-us/about-hurco/press-releases

Metrics

Valuation  
Market cap $ 140.018M
Market cap (USD) $ 140.018M
P/E -20.99
PEG —
P/BV 0.73
P/S 0.76
P/OCF 15.53
P/FCF 16.67
Dividend yield 0.04%
Turnover / mcap —
Returns  
ROE -7.4%
ROI -9.6%
ROIC -4.9%
Profit margin -8.5%
Growth  
Revenue growing No
Profits growing No
Revenue up 3y No
Revenue up 5y No
Earnings growth 3y (net profit CAGR) —
Quality  
Profitable No
Margin expanding No
Buying back stock No
Diluting (TTM) Yes
Debt/Equity —
Podcast bulls (TTM) Sign up
Podcast bears (TTM) Sign up
Podcast sentiment (TTM) Sign up
Podcast sentiment % (TTM) Sign up
News sentiment (TTM) 7
Quality score -50.0%
Insiders  
Buys, 1w Sign up
Buys, 1m Sign up
Buys, 1y Sign up
Sells, 1w Sign up
Sells, 1m Sign up
Sells, 1y Sign up

Sign up to see this company's insider trades

Figure FY 2025 FY 2024 FY 2023 FY 2022 FY 2021 FY 2020 FY 2019 FY 2018 FY 2017 FY 2016 FY 2015 FY 2014 FY 2013 FY 2012 FY 2011 FY 2010 FY 2009 FY 2008 FY 2007 FY 2006 FY 2005 FY 2004 FY 2003 FY 2002 FY 2001 FY 2000
Revenue 178.554M 186.584M 227.807M 250.814M 235.195M 170.627M 263.377M 300.671M 243.667M 227.289M 219.383M 222.303M 192.804M 203.117M 180.4M 105.893M 91.016M 223.994M 188.047M 148.517M 125.509M 99.572M 75.532M 70.486M 92.267M 96.204M
Net profit -15.117M -16.608M 4.389M 8.226M 6.764M -6.247M 17.495M 21.49M 15.115M 13.292M 16.214M 15.143M 8.19M 15.638M 11.124M -5.744M -2.321M 22.52M 20.889M 15.479M 16.443M 6.269M 462K -8.263M -1.597M 5.035M
Free cash flow 16.651M -3.76M -14.107M -5.073M 30.915M 10.249M -9.582M 17.475M 28.191M -8.835M 25.417M 14.655M 12.961M -9.742M -2.94M 21.12M -3.162M -4.419M 10.868M 12.834M 10.098M 6.044M 1.74M 5.017M -4.735M 11.657M

Figure FY 2025 FY 2024 FY 2023 FY 2022 FY 2021 FY 2020 FY 2019 FY 2018 FY 2017 FY 2016 FY 2015 FY 2014 FY 2013 FY 2012 FY 2011 FY 2010 FY 2009 FY 2008 FY 2007 FY 2006 FY 2005 FY 2004 FY 2003 FY 2002 FY 2001 FY 2000
Share price 17.4 21.45 22.43 22.48 32.26 28.4 32.17 44.36 45 28.07 26.24 37.66 25.86 25.86 19.68 17.2 17.54 19.33 51.48 25.77 — — — — — —
Price performance 12m -0.19 -0.04 -0 -0.3 0.14 -0.12 -0.27 -0.01 0.6 0.07 -0.3 0.46 -0 0.31 0.14 -0.02 -0.09 -0.62 1 — — — — — — —

Filed figures

Figure Oct 2016 Oct 2017 Oct 2018 Oct 2019 Oct 2020 Oct 2021 Oct 2022 Oct 2023 Oct 2024 Oct 2025
Balance sheet detail
Trade receivables (USD) 48.6M 50.1M 54.4M 43.3M 27.7M 42.6M 38.4M 40M 36.7M 27.9M
↳ YoY growth +16.4% +3.0% +8.6% -20.5% -36.0% +53.9% -9.8% +4.0% -8.2% -23.9%
↳ 5y CAGR +12.4% +7.3% +8.5% -1.0% -7.9% -2.6% -5.2% -6.0% -3.3% +0.2%
Borrowings, current (USD) 1.48M 1.51M 1.43M — — — — — — —
Lease liabilities (USD) — — — 0.00 12.1M 11M 8.79M 11.3M 11.7M 11.9M
Cash and deposits (USD) 41.2M 66.3M 77.2M 56.9M 57.9M 84.1M 63.9M 41.8M 33.3M 48.7M
Intangible assets (USD) 1.15M 1.08M 938,000 1.1M 1.85M 1.57M 1.25M 994,000 763,000 627,000
Right-of-use assets (USD) — — — 0.00 11.7M 10.6M 8.46M 11M 11.3M 11.6M
Net debt (borrowings + leases - cash) (USD) -39.7M -64.8M -75.7M — — — — — — —
Cash flow detail
Operating cash flow (USD) -6.86M 30.4M 21M -6.41M 10.9M 32.2M -3.97M -12.8M -2.52M 17.6M
Purchases of property, plant and equipment (USD) -1.97M -2.18M -3.54M -3.17M -683,000 -1.26M -1.11M -1.29M -1.24M -910,000
Change in receivables (cash effect) (USD) -8.14M 563,000 -5.15M 11.2M 15.9M -15.2M 280,000 -84,000 4M 9.74M
Change in inventories (cash effect) (USD) -13.9M 1.64M -20.4M -10.5M 3.46M 2.17M -24.4M -648,000 8.38M 16.4M
Change in payables (cash effect) (USD) -6M 8.53M 10.8M -23.8M -2.56M 20.6M -2.28M -11.8M -5.27M 313,000
Dividends paid (cash effect) (USD) -2.31M -2.59M -2.9M -3.2M -3.42M -3.67M -3.92M -4.14M -2.09M —
Interest paid (cash effect) (USD) -56,000 -66,000 -64,000 -11,000 — — — — — —
Income taxes paid (cash effect) (USD) -4.33M -4.87M -6.17M -11M -487,000 -1.57M 1.63M -4.34M -3.02M -1.84M
Share-based compensation (USD) 1.61M 1.7M 2.5M 2.67M 2.06M 2.78M 2.69M 2.7M 1.65M 1.7M
Operating cash flow before change in receivables (USD) 1.28M 29.8M 26.2M -17.7M -4.98M 47.4M -4.25M -12.7M -6.52M 7.82M
Free cash flow (OCF - PPE - intangibles) (USD) -8.84M 28.2M 17.5M -9.58M 10.2M 30.9M -5.07M -14.1M -3.76M 16.7M
Income detail
Research and development expense (USD) 4.9M 4.2M 4.7M 4.4M 3.5M 3.2M 3.4M 4.2M 3.9M 4M
↳ 5y CAGR +14.4% +10.1% +9.4% +5.3% -2.1% -8.2% -4.1% -2.2% -2.4% +2.7%
Total comprehensive income (USD) 11.6M 18M 19.8M 18.4M -304,000 8.01M -11.6M 5.71M -12.5M -7.96M
Comprehensive income to owners (USD) 11.6M 18M 19.8M 18.4M -304,000 8.01M -11.6M 5.71M -12.5M -7.96M
Provision for credit losses (USD) -75,000 -25,000 388,000 -136,000 510,000 244,000 -159,000 32,000 -36,000 -250,000
Credit cost ratio (credit losses / average receivables) (%) 0.2% 0.1% 0.7% 0.3% 1.4% 0.7% 0.4% 0.1% 0.1% 0.8%
Reported Jan 6, 2017 Jan 5, 2018 Jan 4, 2019 Mar 6, 2020 Jan 8, 2021 Jan 7, 2022 Jan 6, 2023 Jan 5, 2024 Jan 10, 2025 Jan 9, 2026

Sign up to see institutional holdings

Sign Up

Podcast Mentions

Sign up to see podcast mentions and sentiment

Sign Up

INDIANAPOLIS, INDIANA – September 4, 2026 -- Hurco Companies, Inc. (Nasdaq: HURC) today reported results for the third fiscal quarter ended July 31, 2026. Hurco recorded net income of $2,314,000, or $0.35 per diluted share, for the third quarter of fiscal year 2026, compared to a net loss of $3,693,000, or $(0.58) per diluted share, for the corresponding period in fiscal year 2025. For the first nine months of fiscal year 2026, Hurco reported a net loss of $3,526,000, or $(0.55) per diluted share, compared to a net loss of $12,076,000, or $(1.87) per diluted share, for the corresponding period in fiscal year 2025.

Sales and service fees for the third quarter of fiscal year 2026 were $47,289,000, an increase of $1,483,000, or 3%, compared to the corresponding prior year period, and included an unfavorable currency impact of $20,000, or less than 1%, when translating foreign sales to U.S. dollars for financial reporting purposes.

INDIANAPOLIS, INDIANA – June 5, 2026 -- Hurco Companies, Inc. (Nasdaq: HURC) today reported results for the second fiscal quarter ended April 30, 2026. Hurco recorded a net loss of $2,372,000, or $0.37 per diluted share, for the second quarter of fiscal year 2026, compared to a net loss of $4,063,000, or $0.62 per diluted share, for the corresponding period in fiscal year 2025. For the first six months of fiscal year 2026, Hurco reported a net loss of $5,840,000, or $0.91 per diluted share, compared to a net loss of $8,383,000, or $1.29 per diluted share, for the corresponding period in fiscal year 2025.

Sales and service fees for the second quarter of fiscal year 2026 were $47,618,000, an increase of $6,751,000, or 17%, compared to the corresponding prior year period, and included a favorable currency impact of $1,352,000, or 3%, when translating foreign sales to U.S. dollars for financial reporting purposes. Sales and service fees for the first six months of fiscal year 2026 were $90,486,000, an increase of $3,205,000, or 4%, compared to the corresponding prior year period, and included a favorable currency impact of $3,165,000, or 4%, when translating foreign sales to U.S.

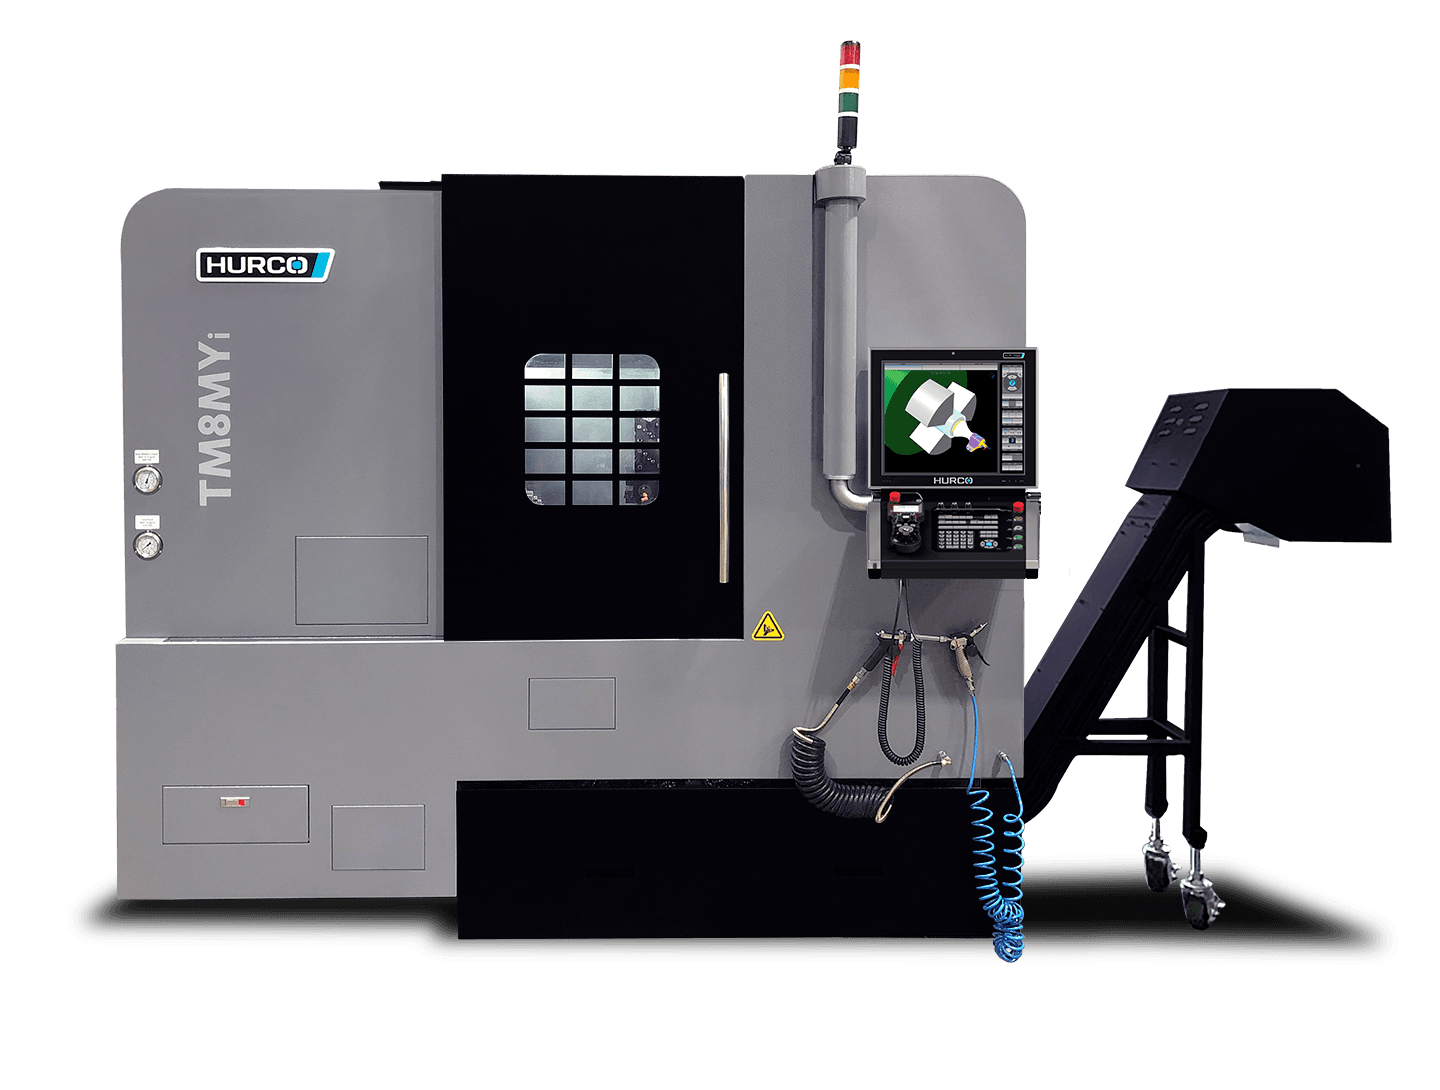
TM8MYi CNC Lathe with Y-Axis & Live Tooling Bull 1 Bear 0 Product/operations

Logo

  • Machines
  • Technology
  • Company
  • Resources
  • Support
  • Contact Us

Find a Distributor Build & Price Your Machine

News

New TM8MYi Lathe Offers Affordable Access to Multi-Axis Turning with Hurco Control

April 28, 2026

New TM8MYi Lathe Offers Affordable Access to Multi-Axis Turning with Hurco Control

CNC MachiningTurning Center

Share

New TM8MYi Lathe Offers Affordable Access to Multi-Axis Turning with Hurco Control

Indianapolis, Indiana – The newest addition to Hurco Companies, Inc.'s lathe lineup, the TM8MYi was built to fill the gap between Hurco's general purpose TM Series and high-performance TMX Series of turning centers.

Affordable Multi-Axis Turning

The TM8MYi offers shops an affordable entry point into multi-axis turning with Y-axis capability, live tooling, and the powerful Hurco WinMax control that machinists already know and love.

Key Features

  • Y-Axis Capability: Off-center milling operations without secondary setups
  • Live Tooling: Powered tool positions for milling, drilling, and tapping
  • Hurco WinMax Control: Intuitive conversational programming and NC/G-code flexibility
  • Compact Footprint: Designed for shops with limited floor space
  • Competitive Pricing: Affordable access to advanced turning capabilities

Bridging the Gap

The TM8MYi is positioned between the general-purpose TM Series lathes and the high-performance TMX Series, offering an ideal solution for shops ready to upgrade from basic turning to multi-axis machining without the premium price tag.

Key Features

This is a bold statement with italic text and a clickable link .

  • Advanced CNC technology
  • User-friendly interface
  • High precision machining

Hurco machines have transformed our manufacturing process.

Resource Link

Contact Us

Find more helpful resources, such as training videos and webinars here.

Find Resources

Logo

Find a Distributor Request a Quote

Follow us

Machines

Technology

Company

Resources

Support
Prompts

Hurco Companies, Inc. (ticker HURC), listed in United States.

ETFs Holding Hurco Companies, Inc.

ETF Weight in ETF Shares Market value As of
FSCC 0.10% 17,114 $ 367.609K Aug 31, 2026
BSVO 0.02% 27,952 $ 540K Nov 18, 2026
DFSV 0.01% 130,023 $ 2.711M Nov 12, 2026
FESM 0.01% 16,382 $ 375.066K Jun 30, 2026
DFAS 0.00% 47,712 $ 994.795K Nov 12, 2026
DXUV 0.00% 3,624 $ 75.56K Nov 12, 2026
DFSU 0.00% 894 $ 18.64K Nov 12, 2026
DFUV 0.00% 3,927 $ 81.878K Nov 12, 2026
DFAC 0.00% 18,887 $ 393.794K Nov 12, 2026
DCOR 0.00% 7,561 $ 157.647K Nov 12, 2026
DFUS 0.00% 883 $ 18.411K Nov 12, 2026
AVSC 0.00% 4,506 $ 87.101K Nov 16, 2026