On November 12, 2026, Host Hotels & Resorts, Inc. (the “Company”) entered into a distribution agreement (the “Distribution Agreement”) with (i) J.P. Morgan Securities LLC, BofA Securities, Inc., Wells Fargo Securities, LLC, BNY Mellon Capital Markets, LLC, Cantor Fitzgerald & Co., Capital One Securities, Inc., Goldman Sachs & Co. LLC, Jefferies LLC, M&T Securities, Inc., Morgan Stanley & Co. LLC and Scotia Capital (USA) Inc., as sales agents (in such capacity, each, a “Sales Agent” and collectively, the “Sales Agents”) or (other than Capital One Securities, Inc. and M&T Securities, Inc.), as forward sellers acting as sales agents for the respective Forward Purchasers (as defined below) (in such capacity, each a “Forward Seller,” and collectively, the “Forward Sellers”), and (ii) the Forward Purchasers (as defined below). Pursuant to the Distribution Agreement, the Company or any Forward Seller (as agent for its corresponding Forward Purchaser) may offer and sell, from time to time, shares of the Company’s common stock, par value $0.01 per share, having a combined aggregate offering price of up to $600 million (the “Shares”).
|
Host Hotels & Resorts, Inc. is a self-managed and self-administered real estate investment trust (REIT) that owns a portfolio of primarily luxury and upper-upscale hotels. The company operates through Host L.P., in which it holds a controlling interest, and focuses on major urban and resort destinations in the United States, with a small number of properties in Brazil and Canada. Its portfolio includes convention destination hotels, high-end urban hotels, and resorts, many of which are operated under the Marriott and Hyatt brand names. The company also holds non-controlling interests in domestic joint ventures focused on the lodging industry. Host Hotels & Resorts engages in value enhancement initiatives, return on investment projects, and renewal capital expenditures to maintain asset quality and competitiveness. It allocates capital through acquisitions, dispositions, and equity or debt financing to support its growth strategy. Summarised from the company's own disclosures, fiscal year ended Feb 2026 |
Industry REIT - Hotel & Motel | Homepage hosthotels.com |
| Sector Real Estate | IR page hosthotels.com/investor-relations/investor-overview | |
|
Tags
luxury hotels, upper-upscale hotels, resort hotels, urban hotels, convention hotels, lodging real estate, asset management, capital allocation, value enhancement, return on investment projects, Host L.P., Marriott, Hyatt, The Phoenician A Luxury Collection Resort Scottsdale, Hyatt Regency Austin
|
Press page hosthotels.com/Our-Company/News |
Metrics
| Valuation | |
|---|---|
| Market cap | $ 17.364B |
| Market cap (USD) | $ 17.364B |
| P/E | 16.90 |
| PEG | 2.59 |
| P/BV | 2.72 |
| P/S | 2.79 |
| P/OCF | 10.81 |
| P/FCF | 20.05 |
| Dividend yield | 6.6% |
| Turnover / mcap | — |
| Returns | |
|---|---|
| ROE | 11.6% |
| ROI | 8.7% |
| ROIC | 9.2% |
| Profit margin | 12.5% |
| Growth | |
|---|---|
| Revenue growing | Yes |
| Profits growing | Yes |
| Revenue up 3y | Yes |
| Revenue up 5y | Yes |
| Earnings growth 3y (net profit CAGR) | 6.5% |
| Quality | |
|---|---|
| Profitable | Yes |
| Margin expanding | No |
| Buying back stock | Yes |
| Diluting (TTM) | No |
| Debt/Equity | 34.6% |
| Podcast bulls (TTM) | Sign up |
| Podcast bears (TTM) | Sign up |
| Podcast sentiment (TTM) | Sign up |
| Podcast sentiment % (TTM) | Sign up |
| News sentiment (TTM) | 21 |
| Quality score | 52.6% |
| Insiders | |
|---|---|
| Buys, 1w | Sign up |
| Buys, 1m | Sign up |
| Buys, 1y | Sign up |
| Sells, 1w | Sign up |
| Sells, 1m | Sign up |
| Sells, 1y | Sign up |
Sign up to see this company's insider trades
| Figure | FY 2025 | FY 2024 | FY 2023 | FY 2022 | FY 2021 | FY 2020 | FY 2019 | FY 2018 | FY 2017 | FY 2016 | FY 2015 | FY 2014 | FY 2013 | FY 2012 | FY 2011 | FY 2010 | FY 2009 | FY 2008 | FY 2007 | FY 2006 | FY 2005 | FY 2004 | FY 2003 | FY 2002 | FY 2001 | FY 2000 | FY 1999 | FY 1998 |
|---|---|---|---|---|---|---|---|---|---|---|---|---|---|---|---|---|---|---|---|---|---|---|---|---|---|---|---|---|
| Revenue | 6.114B | 5.684B | 5.311B | 4.907B | 2.89B | 1.62B | 5.469B | 5.524B | 5.387B | 5.43B | 5.387B | 5.354B | 5.166B | 5.286B | 4.998B | 4.437B | 4.158B | 5.288B | 5.426B | 4.888B | 3.881B | 3.64B | 3.448B | 3.68B | 3.754B | 1.473B | 1.376B | 3.564B |
| Net profit | 765M | 697M | 740M | 633M | -11M | -732M | 920M | 1.087B | 564M | 762M | 558M | 732M | 317M | — | — | — | -252M | 427M | 727M | 738M | 166M | 0 | 14M | -16M | 51M | 156M | 211M | 47M |
| Free cash flow | 866M | 950M | 795M | 912M | -135M | — | — | 1.026B | 1.025B | 1.01B | 783M | 826M | 716M | — | — | — | 552M | 646M | 734M | 606M | 270M | 154M | 192M | 243M | — | — | — | — |
| Figure | FY 2025 | FY 2024 | FY 2023 | FY 2022 | FY 2021 | FY 2020 | FY 2019 | FY 2018 | FY 2017 | FY 2016 | FY 2015 | FY 2014 | FY 2013 | FY 2012 | FY 2011 | FY 2010 | FY 2009 | FY 2008 | FY 2007 | FY 2006 | FY 2005 | FY 2004 | FY 2003 | FY 2002 | FY 2001 | FY 2000 | FY 1999 | FY 1998 |
|---|---|---|---|---|---|---|---|---|---|---|---|---|---|---|---|---|---|---|---|---|---|---|---|---|---|---|---|---|
| Share price | 17.73 | 17.52 | 19.47 | 16.05 | 17.39 | 14.63 | 18.55 | 16.67 | 19.85 | 18.84 | 15.34 | 23.77 | 19.44 | 15.67 | 14.77 | 17.87 | 11.67 | 7.57 | 17.65 | 25.15 | — | — | — | — | — | — | — | — |
| Price performance 12m | 0.01 | -0.1 | 0.21 | -0.08 | 0.19 | -0.21 | 0.11 | -0.16 | 0.05 | 0.23 | -0.35 | 0.22 | 0.24 | 0.06 | -0.17 | 0.53 | 0.54 | -0.57 | -0.3 | — | — | — | — | — | — | — | — | — |
Filed figures
Lines the statements and their notes report beside the headline figures, read from the filings' XBRL as filed (no restatement applied), with figures computed from one filing's own lines. Cash-flow lines carry their cash direction: an outflow is negative. Each period links to its filing; a figure's period, report date and tag are in its tooltip.
| Figure | Dec 2016 | Dec 2017 | Dec 2018 | Dec 2019 | Dec 2020 | Dec 2021 | Dec 2022 | Dec 2023 | Dec 2024 | Dec 2025 |
|---|---|---|---|---|---|---|---|---|---|---|
| Balance sheet detail | ||||||||||
| Lease liabilities (USD) | — | — | — | 606M | 610M | 564M | 568M | 563M | 560M | 563M |
| Cash and deposits (USD) | 372M | 913M | 1.54B | 1.57B | 2.34B | 807M | 667M | 1.14B | 554M | 768M |
| Right-of-use assets (USD) | — | — | — | 595M | 597M | 551M | 556M | 550M | 559M | 560M |
| Cash flow detail | ||||||||||
| Operating cash flow (USD) | 1.3B | 1.23B | 1.3B | 1.25B | -307M | 292M | 1.42B | 1.44B | 1.5B | 1.51B |
| Purchases of property, plant and equipment (USD) | -293M | -205M | -274M | — | — | — | — | — | — | — |
| Dividends paid (cash effect) (USD) | -596M | -628M | -629M | -623M | -320M | 0.00 | -150M | -547M | -737M | -623M |
| Share buybacks (cash effect) (USD) | -218M | — | — | -482M | -147M | 0.00 | -27M | -182M | -107M | -205M |
| Interest paid (cash effect) (USD) | -144M | -158M | -171M | -219M | -183M | -183M | -142M | -183M | -172M | -241M |
| Income taxes paid (cash effect) (USD) | -15M | -40M | -82M | -93M | — | — | — | -12M | -11M | -11.4M |
| Share-based compensation (USD) | 12M | 11M | 14M | 15M | 17M | 18M | 26M | 30M | 24M | 26M |
| Free cash flow (OCF - PPE - intangibles) (USD) | 1.01B | 1.03B | 1.03B | — | — | — | — | — | — | — |
| Income detail | ||||||||||
| Total comprehensive income (USD) | 795M | 594M | 1.15B | 935M | -759M | -13M | 644M | 757M | 694M | 791M |
| Comprehensive income to owners (USD) | 787M | 586M | 1.09B | 923M | -750M | -13M | 634M | 745M | 684M | 780M |
| Reported | Feb 24, 2017 | Feb 27, 2018 | Feb 26, 2019 | Feb 25, 2020 | Feb 25, 2021 | Feb 24, 2022 | Feb 22, 2023 | Feb 28, 2024 | Feb 26, 2025 | Feb 25, 2026 |
Operating KPIs — quarters
Business figures the company publishes beside its accounts (users, subscribers, same-store sales, production, occupancy ...), read from its results releases and reports, with the growth on the same period a year earlier beneath each: computed from the figures, and as the company states it where it does. Each figure links to its source; counts at a period end show under that period.
Operating KPIs — years
Business figures the company publishes beside its accounts (users, subscribers, same-store sales, production, occupancy ...), read from its results releases and reports, with the growth on the same period a year earlier beneath each: computed from the figures, and as the company states it where it does. Each figure links to its source; counts at a period end show under that period.
Sign up to see institutional holdings
Sign UpPodcast Mentions
Sign up to see podcast mentions and sentiment
Sign UpMaterial events reported to the SEC on Form 8-K or 6-K, newest first. The link opens the filing itself on EDGAR. Press releases from the company's own website, newest first.
(240) 744-5267
JAIME MARCUS
Investor Relations
(240) 744-5117
Host Hotels & Resorts, Inc. Reports Results for the Third Quarter of 2026
Delivered Comparable Hotel RevPAR Growth of 8.8% and Comparable Hotel Total RevPAR Growth of 7.3%
Acquired 1 Hotel Brooklyn Bridge and Renaissance Dallas at Plano Legacy West Hotel
Amended $2.5 Billion Credit Facility, Extending Maturity and Improving Pricing Grid
Raising Full Year 2026 Growth Guidance for Comparable Hotel RevPAR to 6.75% and Total RevPAR to 6.0%
BETHESDA, Md., November 4, 2026 – Host Hotels & Resorts, Inc. (NASDAQ: HST) (the “Company”), the nation’s largest lodging real estate investment trust (“REIT”), today announced results for the third quarter of 2026.
10/22/2026
Building a home. Building community. Making an impact.
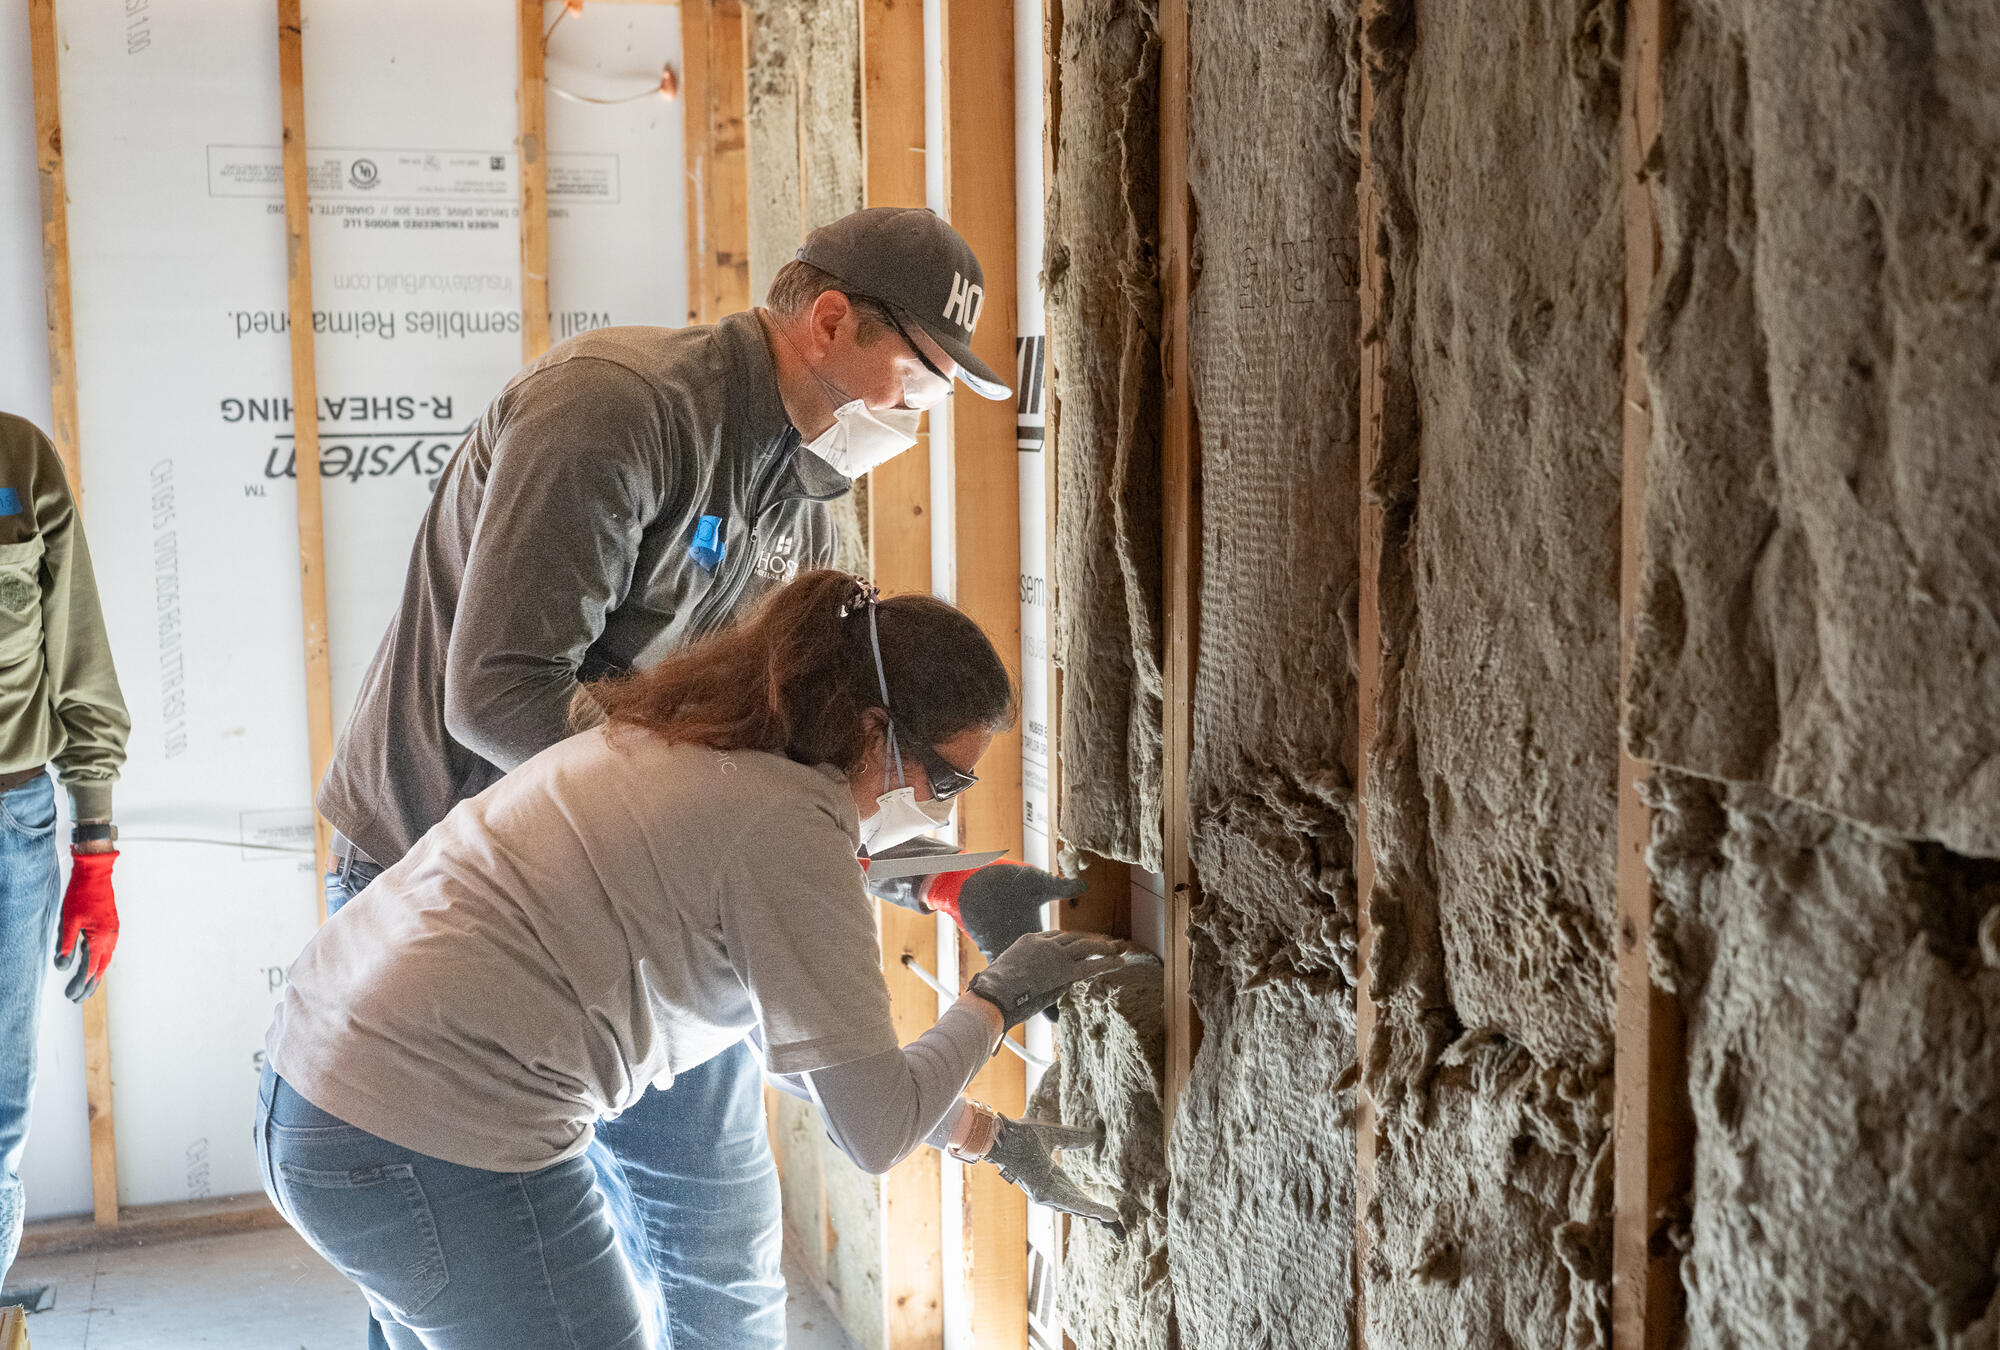
On October 1, Host volunteers joined Habitat for Humanity Metro Maryland, one of our signature community partners, for a Build Day focused on teamwork, community and a shared commitment to expanding access to safe, affordable housing.
The day began with a walking tour to learn about the history and future of the Emory Gove community, led by Tim Warner, Habitat’s Director of Community Engagement, pastor at Emory Grove United Methodist Church and president of the Heritage Emory Grove Community Development Corporation. Warner shared the story of Emory Grove, founded by freed African Americans in 1864 and later razed as a result of urban renewal efforts. Today, he is working alongside Habitat and the Housing Opportunities Commission of Montgomery County to create affordable housing and help families connected to the community’s history once again make their home there. Volunteers visited the site of the former town center and other locations that offered a glimpse into Emory Grove’s past and the ongoing effort to shape its future.
A Day of Hands-On Impact
Following the tour, volunteers rolled up their sleeves at a local Habitat build site. Working side-by-side, the team:
- Cleared the site, removing construction trash and debris to prepare for the next phase of building
- Insulated an entire two-story house to help prepare it for its future residents
- Installed a vapor barrier, taking on this additional task after completing the insulation work ahead of schedule
The home will ultimately give a local family of four — parents and their two children—a safe, affordable place to call their own.
Building Something Much Bigger, Together
Through this partnership, we helped advance Habitat for Humanity’s mission to expand access to affordable homeownership while contributing to a project with deep ties to the community’s history. The day demonstrated how coming together to lend a hand can make a meaningful, lasting difference and support stronger, more resilient communities — one home at a time.
Learn more about Host’s Corporate Responsibility program and our commitment to our corporate citizenship .



Host Hotels & Resorts
4747 Bethesda Avenue, Suite 1300
Bethesda, MD 20814
(240) 744-1000 Sign Up for Email Alerts
Copyright © 2006 - 2026 Host Hotels & Resorts, L.P. All Rights Reserved.


















Prompts
Click prompts to add them under the company line, click again to take one out, then copy the result into your AI chat. Shared by Asian Century Stocks and Uncovered Thai Stocks. Thank you.
Company History
Name and ticker changes, and re-registrations under a new regulatory id. When a ticker stopped being used is not recorded, so former tickers are undated.
| Date | Change | Detail |
|---|---|---|
| Apr 19, 2006 | Renamed | HOST MARRIOTT CORP/ → HOST HOTELS & RESORTS, INC. |
| — | Predecessor | Predecessor Host Hotels & Resorts LP (CIK 1061937) filed under its own registration; its figures are on its own company page, not shown here. |
ETFs Holding Host Hotels & Resorts, Inc.
Exchange-traded funds whose newest published daily portfolio holds one of the company's listings, largest weight first.
| ETF | Weight in ETF | Shares | Market value | As of |
|---|---|---|---|---|
| SRHR | 4.78% | 103,525 | $ 2.602M | Jul 31, 2026 |
| BEDZ | 4.43% | 5,574 | $ 132.16K | Jun 30, 2026 |
| ADPV | 4.36% | 309,182 | $ 7.77M | Jul 31, 2026 |
| REIT | 3.10% | 79,723 | $ 1.748M | Aug 31, 2026 |
| JPRE | 2.60% | 479,458 | $ 12.284M | Nov 17, 2026 |
| UDI | 2.53% | 4,340 | $ 102.901K | Jun 30, 2026 |
| VGSR | 1.57% | 346,634 | $ 8.219M | Jun 30, 2026 |
| PPI | 1.47% | 95,848 | $ 2.273M | Jun 30, 2026 |
| DFAR | 1.38% | 4,675,295 | $ 119.314M | Nov 12, 2026 |
| BLDG | 1.34% | 35,729 | $ 897.87K | Jul 31, 2026 |
| ROE | 1.17% | 113,417 | $ 2.91M | Nov 18, 2026 |
| IYRI | 1.13% | 150,730 | $ 3.375M | Sep 30, 2026 |
| HWSM | 1.10% | 1,275 | $ 30.23K | Jun 30, 2026 |
| AVRE | 1.02% | 353,237 | $ 9.085M | Nov 16, 2026 |
| DFGR | 0.89% | 1,391,640 | $ 35.515M | Nov 12, 2026 |
| PY | 0.87% | 81,123 | $ 1.923M | Jun 30, 2026 |
| MCDS | 0.72% | 2,215 | $ 56.748K | Nov 17, 2026 |
| REGS | 0.67% | 18,366 | $ 435.458K | Jun 30, 2026 |
| AFMC | 0.65% | 66,667 | $ 1.715M | Nov 16, 2026 |
| LVDS | 0.63% | 29,248 | $ 749.334K | Nov 17, 2026 |
| LSVD | 0.55% | 142,617 | $ 3.584M | Jul 31, 2026 |
| AFLG | 0.53% | 188,668 | $ 4.853M | Nov 16, 2026 |
| INFO | 0.50% | 196,095 | $ 5M | Nov 13, 2026 |
| JHDV | 0.47% | 2,416 | $ 57.283K | Jun 30, 2026 |
| EHLS | 0.44% | 9,279 | $ 238.656K | Nov 17, 2026 |
| IQSZ | 0.38% | 26,360 | $ 662.427K | Jul 31, 2026 |
| REMC | 0.36% | 518 | $ 12.282K | Jun 30, 2026 |
| CLSE | 0.36% | 148,170 | $ 3.249M | Aug 31, 2026 |
| CAPE | 0.28% | 28,230 | $ 669.333K | Jun 30, 2026 |
| JAVA | 0.28% | 803,389 | $ 20.583M | Nov 17, 2026 |
| FLDZ | 0.23% | 396 | $ 9,389.16 | Jun 30, 2026 |
| FTLS | 0.23% | 227,428 | $ 0.00 | Nov 16, 2026 |
| SGLC | 0.21% | 20,577 | $ 451.254K | Aug 31, 2026 |
| IEDI | 0.21% | 2,297 | $ 57.724K | Jul 31, 2026 |
| SYZ | 0.19% | 5,457 | $ 129.385K | Jun 30, 2026 |
| JUSA | 0.12% | 41,797 | $ 1.071M | Nov 17, 2026 |
| DYNF | 0.11% | 1,809,122 | $ 46.531M | Nov 16, 2026 |
| HBTA | 0.09% | 10,683 | $ 234.278K | Aug 31, 2026 |
| AAUS | 0.08% | 15,184 | $ 390K | Nov 18, 2026 |
| GSPY | 0.07% | 17,484 | $ 449.688K | Nov 17, 2026 |
| LGDX | 0.05% | 2,732 | $ 70.267K | Nov 17, 2026 |
| RAA | 0.04% | 10,610 | $ 251.563K | Jun 30, 2026 |
| XMAG | 0.04% | 3,335 | $ 85.109K | Nov 13, 2026 |
| VSLU | 0.03% | 6,746 | $ 159.948K | Jun 30, 2026 |
| ACVF | 0.02% | 1,352 | $ 33.976K | Jul 31, 2026 |
| HCMT | 0.02% | 4,430 | $ 111.326K | Jul 31, 2026 |
| CSHP | 0.01% | 1,013 | $ 26.054K | Nov 16, 2026 |
| IALT | 0.00% | 2,459 | $ 63.245K | Nov 16, 2026 |
| CORO | 0.00% | 432 | $ 11.114K | Nov 16, 2026 |