November 6, 2026 PDF Version Gogo Completes Amendment and Extension of its ~$600 Million Original Term Loan B Facility FCC Renews Gogo’s Exclusive, Nationwide Air-to-Ground Spectrum Licenses through 2036 Record Galileo Shipments of 172 and 297…
November 6, 2026
PDF Version
Gogo Completes Amendment and Extension of its ~$600 Million Original Term Loan B Facility
FCC Renews Gogo’s Exclusive, Nationwide Air-to-Ground Spectrum Licenses through 2036
Record Galileo Shipments of 172 and 297 Units Online
Total Revenue of $213.2 Million, Net loss of $3.2 Million, Adjusted EBITDA1 of $41.0 Million
Quarterly Net Cash Provided by Operating Activities of $26.3 Million
Reiterates 2026 Financial Guidance
BROOMFIELD, Colo., Nov. 06, 2026 (GLOBE NEWSWIRE) -- Gogo Inc. (NASDAQ: GOGO) (“Gogo” or the “Company”), a leading global provider of broadband connectivity services for the business and military/government aviation markets, today announced its financial results for the quarter ended September 30, 2026.
“Our third quarter results reflect meaningful progress in Gogo’s transformation from a domestic provider of ATG connectivity into a global provider of high-speed LEO and GEO satellite connectivity to the business aviation and mil/gov markets” said Chris Moore, CEO of Gogo.
“The 10-year renewal of our exclusive, low-band nationwide spectrum allows us to explore growth opportunities in new markets and partnerships as utilization shifts to our newer platforms,” Moore continued. “Meanwhile, we believe that the current positive trends in our LEO and GEO offerings should drive growth in our core markets.”
“We are pleased to announce the amendment and extension of our ~$600 million Term Loan B today as it gives us the flexibility to execute our transformation strategy while directing free cash flow toward further debt reduction,” said Gogo CFO, Zac Cotner.
“Looking ahead, as recurring revenue from our next-generation platforms grow, we expect to benefit from a more favorable revenue mix and greater stability in our forecasting model,” Cotner said.
Q3 2026 Financial and Operational Highlights
| FINANCIAL HIGHLIGHTS ($ in millions) | Q3 2026 | vs. Q3 2025 | vs. Q2 2026 |
| Total revenue | $213.2 | (5%) | (4%) |
| Service revenue | $182.7 | (4%) | (4%) |
| Business aviation service revenue | $145.6 | (10%) | (4%) |
| Military / Government service revenue | $37.2 | +36% | (7%) |
| Equipment revenue | $30.5 | (9%) | (3%) |
| Net income (loss) | ($3.2) | ($1.3) | ($1.2) |
| Diluted earnings (loss) per share | ($0.02) | ($0.01) | ($0.01) |
| Adjusted EBITDA1,2 | $41.0 | (27%) | (24%) |
| Net cash provided by operating activities | $26.3 | ($20.5) | ($6.0) |
| Free Cash Flow1,2 | $28.1 | ($2.5) | $6.5 |
| Cash and cash equivalents | $90.7 | ($42.9) | $27.6 |
| OPERATIONAL HIGHLIGHTS | Q3 2026 | vs. Q3 2025 | vs. Q2 2026 |
| Gogo Galileo equipment units shipped3 | 172 | +95% | +59% |
| Total ATG equipment units sold | 142 | (68%) | (52%) |
| Total ATG AOL4 | 5,399 | (17%) | (6%) |
| Gogo Galileo AOL | 297 | +1550% | +61% |
| Broadband GEO AOL | 1,285 | (4%) | (2%) |
| | | | |
~$600 Million Original Term Loan B Amendment & Extension Details
-
**Extends maturity:**Term Loan B extension to October 2030 provides 2.5 years of additional runway to further the Company’s transformation plan.
-
**Reduces debt:**Commits Gogo to $75 million in principal repayments through the end of 2027, with an immediate $25 million paydown, $30 million to be repaid by December 31, 2026, and an additional $20 million to be repaid by December 31, 2027. Inclusive of amortization, overall debt will be reduced by a cumulative $92 million by the end of 2027.
Recent Developments
The following developments occurred during or subsequent to the quarter ended September 30, 2026:
-
Textron Aviation announced it will be the first original equipment manufacturer (“OEM”) to include Gogo’s Galileo HDX as a standard fit for its Cessna Citation Longitude, Citation Latitude and Citation Ascend business jets.
-
PlaneSense selected Gogo Galileo HDX for its entire fleet of 71 Pilatus PC-12 turboprops and PC-24 jets, as well as future aircraft deliveries, providing high-speed low Earth orbit (“LEO”) connectivity across its fractional ownership fleet. Installations are expected to be completed by the end of 2027.
-
During the quarter, Gogo received its first sizeable OEM order for 10 Gogo Galileo FDX and 15 Gogo Galileo HDX units from Bombardier. The products will support their demonstration fleet, after market installations and OEM deliveries.
-
Duncan Aviation purchased 40 Gogo Galileo HDX systems, representing Gogo's largest single maintenance, repair and overhaul (“MRO”) order of the year and reflecting growing customer demand for Gogo's LEO connectivity service.
-
TransMedics has contracted with Gogo to equip its fleet of 22 Embraer Phenom 300E aircraft with Gogo Galileo HDX to support time-critical organ transport missions across the United States. Installations are underway, with full fleet deployment expected by mid-2027.
-
Gogo unveiled its long-term Galileo technology roadmap, outlining planned performance enhancements approximately every 24 months over six years, creating predictable, seven-to-10 year renewed revenue cycles with customers. The roadmap outlines targeted download speeds of five times and upload speeds of 10 times current levels while preserving existing installation infrastructure where possible.
-
Gogo received a six-month extension from the Federal Communication Commission (“FCC”) for the completion of it’s “Rip & Replace” network program, from November 8, 2026 to May 8, 2027. The Company plans to flash cut customers to the new software system by the end of Q1 2027.
-
Gogo received a sovereign communications lease renewal valued at more than $15 million to provide geostationary (“GEO”) satellite connectivity to an overseas government customer, supporting secure, reliable communications for aircraft transporting government leaders.
-
Gogo Special Missions and Insitu, a Boeing company, successfully completed testing and integration of a modified high-speed satellite connectivity solution for Group 3 uncrewed aircraft systems (“UAS”), expanding Gogo's capabilities to support unmanned military and government missions.
Reiterates 2026 Financial Guidance
Gogo is reiterating its financial guidance previously provided in August.
-
Total revenue in the range of $870 million to $895 million, split ~84% service revenue and ~16% equipment revenue.
-
Adjusted EBITDA1 in the range of $175 million to $185 million, which includes $18 million of ongoing litigation expense, down from $22 million of litigation expense included in the prior guidance (based on net income (loss) in the range of ($9.0) million to $1.0 million).
-
Free Cash Flow1 in the range of $65 million to $85 million, including the aforementioned updated expense for ongoing litigation and $25 million slated for strategic investments in 2026, net of any FCC reimbursement.
-
Net capital expenditures of $20 million. This assumes $55 million in consolidated capital expenditures and $35 million in 2026 reimbursement from the FCC Reimbursement Program, down from previous expectations of $65 million and $45 million, respectively.
1 See "Non-GAAP Financial Measures" below.
2 Net income and net cash provided by operating activities, which are the corresponding GAAP measures for Adjusted EBITDA and Free Cash Flow, respectively, includes $4.1 million of ongoing litigation expense that was incurred in 3rd quarter of 2026. Ongoing litigation expense is separate from litigation settlement accrual costs.
3 Cumulative Gogo Galileo equipment shipments reached 372 units.
4 See "Key Business Metrics" below.
Conference Call
The Company will host its third quarter conference call on November 6, 2026 at 8:30 a.m. ET. A live webcast of the conference call, as well as a replay, will be available online on the Investor Relations section of the Company’s investor website at https://ir.gogoair.com.
Q3 Earnings Call Webcast Link: https://edge.media-server.com/mmc/p/5eutqdme
Participants can use the below link to retrieve your unique conference ID to use to access the conference call.
https://register-conf.media-server.com/register/BI7dc9e44dbffb4c64b7eb214266ab7b41
Non-GAAP Financial Measures
We report certain non-GAAP financial measurements, including Adjusted EBITDA and Free Cash Flow in the discussion above. Management uses Adjusted EBITDA and Free Cash Flow for business planning purposes, including managing our business against internally projected results of operations and measuring our performance and liquidity. These supplemental performance measures also provide another basis for comparing period-to-period results by excluding potential differences caused by non-operational and unusual or non-recurring items. These supplemental performance measurements may vary from and may not be comparable to similarly titled measures used by other companies. Adjusted EBITDA and Free Cash Flow are not recognized measurements under accounting principles generally accepted in the United States, or GAAP. When analyzing our performance with Adjusted EBITDA or liquidity with Free Cash Flow, as applicable, investors should (i) evaluate each adjustment in our reconciliation to the corresponding GAAP measure, and the explanatory footnotes regarding those adjustments, (ii) use Adjusted EBITDA in addition to, and not as an alternative to, net income (loss) attributable to common stock as a measure of operating results, and (iii) use Free Cash Flow in addition to, and not as an alternative to, consolidated net cash provided by (used in) operating activities when evaluating our liquidity.
Key Business Metrics
Our management regularly reviews financial and business metrics, including the key business metrics in this press release under "Supplemental Information - Key Business Metrics," to evaluate the performance of our business and our success in executing our business plan, make decisions regarding resource allocation and corporate strategies, and evaluate forward-looking projections. Certain of these business metrics may be added, removed or updated from time to time as our business evolves.
Cautionary Note Regarding Forward-Looking Statements
Certain disclosures in this press release and related comments by our management include forward-looking statements within the meaning of the Private Securities Litigation Reform Act of 1995. These forward-looking statements include, without limitation, statements regarding our business outlook, industry, business strategy, plans, goals and expectations concerning our market position, international expansion, future technologies, future operations, margins, profitability, future efficiencies, capital expenditures, liquidity and capital resources and other financial and operating information. When used in this discussion, the words “anticipate,” “assume,” “believe,” “budget,” “continue,” “could,” “estimate,” “expect,” “forecast,” “intend,” “may,” “plan,” “potential,” “predict,” “project,” “should,” “will,” “future” and the negative of these or similar terms and phrases are intended to identify forward-looking statements in this press release. Forward-looking statements are based on our current expectations regarding future events, results or outcomes. These expectations may or may not be realized. Although we believe the expectations reflected in the forward-looking statements are reasonable, we can give you no assurance these expectations will prove to have been correct. Some of these expectations may be based upon assumptions, data or judgments that prove to be incorrect. Actual events, results and outcomes may differ materially from our expectations due to a variety of known and unknown risks, uncertainties and other factors. Although it is not possible to identify all of these risks and factors, they include, among others, the following: our ability to continue to generate revenue from the provision of our connectivity and other service offerings; our development and fixed-price contracts; our reliance on our key OEMs and dealers for equipment sales; our dependence on single-source, third party satellite network providers; the impact of competition; our ability to maintain high-quality customer support; our reliance on third parties for equipment components and services; our participation in U.S. government contracts; our participation in non-U.S. government contracts; the finite useful life of satellites; the impact of global supply chain and logistics issues, tariffs and inflationary trends; the continued expansion of our business outside of the United States and the impact of such expansion on our corporate culture; foreign currency risk; our ability to recruit, train and retain highly skilled employees, and the loss of any key personnel; the impact of pandemics or other outbreaks of contagious diseases, and the measures implemented to combat them; the impact of adverse economic conditions and geopolitical instability; our ability to fully utilize portions of our deferred tax assets; the impact of climate change and other sustainability-related matters; our ability to evaluate or pursue strategic opportunities; our recently-deployed Gogo 5G and Gogo Galileo services may not compete well in the market or face problems relating to implementation; our ability to innovate next-generation technologies and provide products and services useful to our customers and passengers without delay in developing or deploying such technologies, products and services; our ability to maintain our rights to use our licensed 4MHz of ATG spectrum in the United States and obtain rights to additional spectrum if needed; the impact of service interruptions or delays, cybersecurity incidents, technology failures, equipment damage or system disruptions or failures; the impact of assertions by third parties of infringement, misappropriation or other violations; our ability to protect our intellectual property rights; risks associated with the use of artificial intelligence in our products and services; the impact of our use of open-source software; the impact of equipment failure or material defects or errors in our software; our ability to comply with applicable foreign ownership limitations; the impact of government regulation of communication networks, and the internet; our possession and use of personal information; risks associated with participation in the FCC Reimbursement Program; our ability to comply with anti-bribery, anti-corruption and anti-money laundering laws; the extent of expenses, liabilities or business disruptions resulting from litigation; the impact of the distribution of income among various jurisdictions in which we operate as well as changes in tax law or regulation on our U.S. and non-U.S. tax liabilities; the impact of changes in laws and regulations on U.S. government contractors; the impact of our substantial indebtedness; our ability to obtain additional financing to refinance or repay our existing indebtedness; the impact of restrictions and limitations in the agreements and instruments governing our debt; the impact of increases in interest rates; the impact of a substantial portion of our indebtedness being secured by substantially all of our assets; the impact of a substantial change in rating assigned by a rating agency; the volatility of our stock price; our ability to fully utilize our tax losses; the dilutive impact of potential future stock issuances; the impact of our stockholder concentration; our ability to fulfill the obligations of being a public company; the impact of an identified material weakness in our internal controls; the impact of certain provisions of our charter, bylaws, and Delaware law; and other factors listed under the caption “Risk Factors” in our annual report on Form 10-K for the year ended December 31, 2025 as filed with the Securities and Exchange Commission (“SEC”) on February 27, 2026 and in our subsequent quarterly reports on Form 10-Q as filed with the SEC.
Any one of these factors or a combination of these factors could materially affect our financial condition or future results of operations and could influence whether any forward-looking statements contained in this press release ultimately prove to be accurate. Our forward-looking statements are not guarantees of future performance, and you should not place undue reliance on them. All forward-looking statements speak only as of the date made and where required by law we undertake no obligation to update or revise publicly any forward-looking statements, whether as a result of new information, future events or otherwise.
About Gogo
Gogo is the only multi-orbit, multi-band in-flight connectivity provider offering connectivity technology purpose-built for business and military/government mobility aviation. Its industry-leading product portfolio offers best-in-class solutions for all aircraft types, from small to large and heavy jets and beyond.
The Gogo offering uniquely incorporates Air-to-Ground technology and access to multiple satellite constellations to deliver consistent, global tip-to-tail connectivity through a sophisticated suite of software, hardware, and advanced infrastructure supported by a 24/7/365 in person customer support team.
Gogo consistently strives to set new standards for reliability, security and innovation and is shaping the future of inflight aviation to make it easier for every customer to stay connected.
| |
| Gogo Inc. and Subsidiaries Unaudited Condensed Consolidated Statements of Operations (in thousands, except per share amounts) |
| |
| | | For the Three Months Ended September 30, | | | For the Nine Months Ended September 30, | |
| | | 2026 | | | 2025 | | | 2026 | | | 2025 | |
| Revenue: | | | | | | | | | | | | |
| Service revenue | | $ | 182,729 | | | $ | 189,956 | | | $ | 561,733 | | | $ | 582,533 | |
| Equipment revenue | | | 30,505 | | | | 33,629 | | | | 100,631 | | | | 97,397 | |
| Total revenue | | | 213,234 | | | | 223,585 | | | | 662,364 | | | | 679,930 | |
| Operating expenses: | | | | | | | | | | | | |
| Cost of service revenue (exclusive of amounts shown below) | | | 97,295 | | | | 91,593 | | | | 293,719 | | | | 277,023 | |
| Cost of equipment revenue (exclusive of amounts shown below) | | | 30,990 | | | | 31,032 | | | | 97,078 | | | | 88,039 | |
| Engineering, design and development | | | 9,933 | | | | 15,681 | | | | 26,092 | | | | 42,078 | |
| Sales and marketing | | | 13,841 | | | | 13,464 | | | | 40,618 | | | | 42,415 | |
| General and administrative | | | 27,565 | | | | 27,858 | | | | 77,762 | | | | 86,010 | |
| Depreciation and amortization | | | 16,459 | | | | 15,214 | | | | 48,607 | | | | 44,474 | |
| Total operating expenses | | | 196,083 | | | | 194,842 | | | | 583,876 | | | | 580,039 | |
| Operating income | | | 17,151 | | | | 28,743 | | | | 78,488 | | | | 99,891 | |
| Other expense (income): | | | | | | | | | | | | |
| Interest income | | | (907 | ) | | | (1,479 | ) | | | (2,746 | ) | | | (3,251 | ) |
| Interest expense | | | 18,046 | | | | 17,681 | | | | 52,485 | | | | 50,650 | |
| Change in fair value of Earnout Liability | | | 6,100 | | | | 15,000 | | | | 8,357 | | | | 18,900 | |
| Loss on extinguishment of debt | | | — | | | | — | | | | 394 | | | | — | |
| Other expense (income), net | | | 555 | | | | (1,896 | ) | | | (1,162 | ) | | | (1,811 | ) |
| Total other expense | | | 23,794 | | | | 29,306 | | | | 57,328 | | | | 64,488 | |
| Income (loss) before income taxes | | | (6,643 | ) | | | (563 | ) | | | 21,160 | | | | 35,403 | |
| Income tax provision (benefit) | | | (3,443 | ) | | | 1,367 | | | | 13,284 | | | | 12,484 | |
| Net income (loss) | | $ | (3,200 | ) | | $ | (1,930 | ) | | $ | 7,876 | | | $ | 22,919 | |
| | | | | | | | | | | | | |
| Net income (loss) attributable to common stock per share: | | | | | | | | | | | | |
| Basic | | $ | (0.02 | ) | | $ | (0.01 | ) | | $ | 0.06 | | | $ | 0.17 | |
| Diluted | | $ | (0.02 | ) | | $ | (0.01 | ) | | $ | 0.06 | | | $ | 0.17 | |
| Weighted average number of shares: | | | | | | | | | | | | |
| Basic | | | 136,636 | | | | 134,657 | | | | 136,194 | | | | 133,403 | |
| Diluted | | | 136,636 | | | | 134,657 | | | | 136,974 | | | | 136,640 | |
| |
| Gogo Inc. and Subsidiaries Unaudited Condensed Consolidated Balance Sheets (in thousands) |
| |
| | | September 30, | | | December 31, | |
| | | 2026 | | | 2025 | |
| Assets | | | | | | |
| Current assets: | | | | | | |
| Cash and cash equivalents | | $ | 90,694 | | | $ | 125,206 | |
| Accounts receivable, net of allowances of $9,433 and $6,783, respectively | | | 111,552 | | | | 112,558 | |
| Inventories | | | 119,902 | | | | 98,853 | |
| Assets held for sale | | | 26,432 | | | | 26,253 | |
| Prepaid expenses and other current assets | | | 73,672 | | | | 69,039 | |
| Total current assets | | | 422,252 | | | | 431,909 | |
| Non-current assets: | | | | | | |
| Property and equipment, net | | | 108,102 | | | | 117,274 | |
| Intangible assets, net | | | 216,137 | | | | 248,818 | |
| Goodwill | | | 193,187 | | | | 193,187 | |
| Operating lease right-of-use assets | | | 54,211 | | | | 57,990 | |
| Other non-current assets, net of allowances of $771 and $538, respectively | | | 53,592 | | | | 44,928 | |
| Deferred income taxes | | | 197,720 | | | | 209,666 | |
| Total non-current assets | | | 822,949 | | | | 871,863 | |
| Total assets | | $ | 1,245,201 | | | $ | 1,303,772 | |
| Liabilities and stockholders’ equity | | | | | | |
| Current liabilities: | | | | | | |
| Accounts payable | | $ | 88,680 | | | $ | 92,514 | |
| Accrued liabilities | | | 108,482 | | | | 139,020 | |
| Deferred revenue | | | 30,024 | | | | 35,194 | |
| Current portion of long-term debt | | | 2,500 | | | | 2,500 | |
| Total current liabilities | | | 229,686 | | | | 269,228 | |
| Non-current liabilities: | | | | | | |
| Long-term debt | | | 814,634 | | | | 833,579 | |
| Non-current operating lease liabilities | | | 49,793 | | | | 55,772 | |
| Other non-current liabilities | | | 28,540 | | | | 44,064 | |
| Total non-current liabilities | | | 892,967 | | | | 933,415 | |
| Total liabilities | | | 1,122,653 | | | | 1,202,643 | |
| Stockholders’ equity | | | | | | |
| Common stock | | | 14 | | | | 13 | |
| Additional paid-in capital | | | 1,301,957 | | | | 1,288,294 | |
| Accumulated other comprehensive (loss) income | | | (77 | ) | | | 44 | |
| Accumulated deficit | | | (1,179,346 | ) | | | (1,187,222 | ) |
| Total stockholders’ equity | | | 122,548 | | | | 101,129 | |
| Total liabilities and stockholders’ equity | | $ | 1,245,201 | | | $ | 1,303,772 | |
| |
| Gogo Inc. and Subsidiaries Unaudited Condensed Consolidated Statements of Cash Flows (in thousands) |
| |
| | | For the Nine Months Ended September 30, | |
| | | 2026 | | | 2025 | |
| Operating activities: | | | | | | |
| Net income | | $ | 7,876 | | | $ | 22,919 | |
| Adjustments to reconcile net income to cash provided by operating activities: | | | | | | |
| Depreciation and amortization | | | 48,607 | | | | 44,474 | |
| Loss on asset disposals, abandonments and write-downs | | | 234 | | | | 44 | |
| Provision for expected credit losses | | | 3,977 | | | | 494 | |
| Deferred income taxes | | | 11,641 | | | | 9,569 | |
| Stock-based compensation expense | | | 15,095 | | | | 18,520 | |
| Amortization of deferred financing costs and interest rate caps | | | 3,897 | | | | 4,196 | |
| Accretion of debt discount | | | 1,412 | | | | 1,293 | |
| Change in fair value of Earnout Liability | | | 8,357 | | | | 18,900 | |
| Change in fair value of convertible note investment | | | (1,125 | ) | | | (458 | ) |
| Loss on extinguishment of debt | | | 394 | | | | — | |
| Changes in operating assets and liabilities: | | | | | | |
| Accounts receivable | | | (2,707 | ) | | | (5,678 | ) |
| Inventories | | | (21,047 | ) | | | 16,058 | |
| Prepaid expenses and other current assets | | | (3,691 | ) | | | (10,475 | ) |
| Contract assets | | | (12,973 | ) | | | (9,429 | ) |
| Accounts payable | | | 8,947 | | | | (930 | ) |
| Accrued liabilities | | | (12,735 | ) | | | 17,156 | |
| Deferred revenue | | | (5,449 | ) | | | (8,396 | ) |
| Accrued interest | | | (32 | ) | | | (2,046 | ) |
| Other non-current assets and liabilities | | | 716 | | | | (224 | ) |
| Net cash provided by operating activities | | | 51,394 | | | | 115,987 | |
| Investing activities: | | | | | | |
| Proceeds from sale of property and equipment | | | 90 | | | | — | |
| Purchases of property and equipment | | | (38,880 | ) | | | (25,473 | ) |
| Acquisition of intangible assets—capitalized software | | | (6,612 | ) | | | (9,259 | ) |
| Acquisition of Satcom Direct, net of cash acquired | | | — | | | | (1,612 | ) |
| Proceeds from FCC Reimbursement Program for property, equipment and intangibles | | | 21,368 | | | | 3,783 | |
| Proceeds from interest rate caps | | | 3,277 | | | | 9,088 | |
| Net cash used in investing activities | | | (20,757 | ) | | | (23,473 | ) |
| Financing activities: | | | | | | |
| Payments on earnout liability | | | (39,957 | ) | | | — | |
| Payments on term loan | | | (22,964 | ) | | | (1,875 | ) |
| Payments on financing leases | | | (49 | ) | | | (33 | ) |
| Stock-based compensation activity | | | (2,184 | ) | | | 800 | |
| Net cash used in financing activities | | | (65,154 | ) | | | (1,108 | ) |
| Effect of exchange rate changes on cash | | | (3 | ) | | | 328 | |
| (Decrease) increase in cash, cash equivalents and restricted cash | | | (34,520 | ) | | | 91,734 | |
| Cash, cash equivalents and restricted cash at beginning of period | | | 125,690 | | | | 42,304 | |
| Cash, cash equivalents and restricted cash at end of period | | $ | 91,170 | | | $ | 134,038 | |
| Cash, cash equivalents and restricted cash at end of period | | $ | 91,170 | | | $ | 134,038 | |
| Less: current restricted cash | | | 85 | | | | 72 | |
| Less: non-current restricted cash | | | 391 | | | | 394 | |
| Cash and cash equivalents at end of period | | $ | 90,694 | | | $ | 133,572 | |
| Supplemental cash flow information: | | | | | | |
| Cash paid for interest | | $ | 51,852 | | | $ | 59,260 | |
| Cash paid for taxes | | | 2,176 | | | | 1,962 | |
| Non-cash investing activities: | | | | | | |
| Purchases of property, equipment and intangibles in liabilities | | $ | 3,007 | | | $ | 12,741 | |
| |
| Gogo Inc. and Subsidiaries Supplemental Information – Disaggregated Revenue (in thousands, unaudited) |
| |
| | | For the Three Months Ended September 30, | | | For the Nine Months Ended September 30, | |
| | | 2026 | | | 2025 | | | 2026 | | | 2025 | |
| Service revenue by type | | | | | | | | | | | | |
| Satellite broadband | | $ | 83,919 | | | $ | 78,489 | | | $ | 248,338 | | | $ | 232,874 | |
| ATG broadband | | | 55,469 | | | | 71,051 | | | | 180,291 | | | | 221,235 | |
| Narrowband and other | | | 43,341 | | | | 40,416 | | | | 133,104 | | | | 128,424 | |
| Total service revenue by type | | $ | 182,729 | | | $ | 189,956 | | | $ | 561,733 | | | $ | 582,533 | |
| Service revenue by market | | | | | | | | | | | | |
| Business aviation | | $ | 145,561 | | | $ | 162,622 | | | $ | 451,246 | | | $ | 497,269 | |
| Military / Government | | | 37,168 | | | | 27,334 | | | | 110,487 | | | | 85,264 | |
| Total service revenue by market | | $ | 182,729 | | | $ | 189,956 | | | $ | 561,733 | | | $ | 582,533 | |
| | | | | | | | | | | | | |
| Equipment revenue | | | | | | | | | | | | |
| Satellite broadband | | $ | 17,305 | | | $ | 9,511 | | | $ | 42,808 | | | $ | 20,449 | |
| ATG broadband | | | 6,627 | | | | 17,456 | | | | 38,454 | | | | 57,914 | |
| Narrowband and other | | | 6,573 | | | | 6,662 | | | | 19,369 | | | | 19,034 | |
| Total equipment revenue | | $ | 30,505 | | | $ | 33,629 | | | $ | 100,631 | | | $ | 97,397 | |
| |
| Gogo Inc. and Subsidiaries Supplemental Information – Key Business Metrics |
| |
| | | For the Three Months Ended September 30, | | | For the Nine Months Ended September 30, | |
| | | 2026 | | | 2025 | | | 2026 | | | 2025 | |
| ATG aircraft online | | | | | | | | | | | | |
| AVANCE | | | 4,324 | | | | 4,890 | | | | 4,324 | | | | 4,890 | |
| Gogo 5G | | | 94 | | | | — | | | | 94 | | | | — | |
| Gogo Biz | | | 981 | | | | 1,639 | | | | 981 | | | | 1,639 | |
| Total ATG aircraft online | | | 5,399 | | | | 6,529 | | | | 5,399 | | | | 6,529 | |
| GEO aircraft online | | | 1,285 | | | | 1,343 | | | | 1,285 | | | | 1,343 | |
| Gogo Galileo aircraft online | | | 297 | | | | 18 | | | | 297 | | | | 18 | |
| Average monthly connectivity service revenue per ATG aircraft online | | $ | 3,268 | | | $ | 3,407 | | | $ | 3,311 | | | $ | 3,435 | |
| ATG units sold | | | 142 | | | | 437 | | | | 950 | | | | 1,159 | |
| Gogo Galileo units shipped | | | 172 | | | | 88 | | | | 372 | | | | 160 | |
| | | | | | | | | | | | | | | | | |
-
AVANCE aircraft online. We define AVANCE aircraft online as the total number of aircraft equipped with our AVANCE L5 or L3 system, excluding Gogo 5G systems, for which we provide ATG services to business aviation customers in the last month of the period presented. This number excludes military/government AVANCE aircraft online.
-
Gogo 5G aircraft online. We define Gogo 5G aircraft online as the total number of aircraft equipped with our Gogo 5G system for which we provide ATG services to business aviation customers in the last month of the period presented. This number excludes military/government Gogo 5G aircraft online.
-
Gogo Biz aircraft online. We define Gogo Biz aircraft online as the total number of aircraft not equipped with our AVANCE or Gogo 5G system for which we provide ATG services to business aviation customers in the last month of the period presented. This number excludes commercial aircraft operated by Intelsat’s airline customers as well as military/government aircraft receiving ATG service.
-
GEO aircraft online. We define GEO aircraft online as the total number of aircraft for which we provide GEO broadband services to business aviation customers as of the last day of each period presented. This number excludes aircraft receiving services through GEO satellite networks that are end-of-life and military/government GEO aircraft online.
-
Gogo Galileo aircraft online. We define Gogo Galileo aircraft online as the total number of aircraft for which we provide Gogo Galileo LEO broadband services in the last month of the period presented. This number excludes military/government Gogo Galileo aircraft online. This metric was not presented prior to the fiscal year ended December 31, 2025, as Gogo Galileo was only first deployed in 2025.
-
Average monthly connectivity service revenue per ATG aircraft online (“ARPU”). We define ARPU as the aggregate ATG connectivity service revenue for the period divided by the number of months in the period, divided by the number of ATG aircraft online during the period (expressed as an average of the month end figures for each month in such period). Revenue share earned from Intelsat is excluded from this calculation.
-
ATG units sold. We define units sold as the number of ATG units for which we recognized revenue during the period.
-
Gogo Galileo units shipped. We define Gogo Galileo units shipped as the number of Galileo units shipped to our distribution partners during the period, including units used to obtain Supplemental Type Certificates.





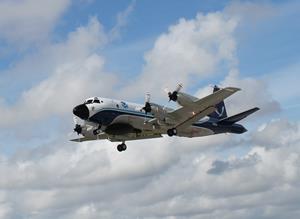
 Photo caption: SD Government, a Gogo company, has secured a $7.5 million NOAA contract providing mission-critical communications services for ‘hurricane hunter’ aircraft including this NOAA Lockheed WP-3D Orion N43RF (Photo: NOAA)