GIII
Fiscal year ends January Quarters are offset from the calendar — Q1 is Feb–Apr

G-III Apparel Group, Ltd. is a global fashion company specializing in the design, sourcing, distribution, and marketing of apparel and accessories. The company operates a portfolio of over 30 owned and licensed brands, anchored by key owned brands including DKNY, Donna Karan, Karl Lagerfeld, and Vilebrequin. Its product range spans outerwear, dresses, sportswear, suit separates, athleisure, jeans, swimwear, handbags, footwear, small leather goods, cold weather accessories, and luggage. G-III serves a broad range of consumers through a diverse mix of distribution channels, including wholesale, company-operated retail stores, franchised stores, and digital platforms. The company also licenses its owned brands in complementary categories and geographies to selected partners, generating royalty income. Licensed brands in its portfolio include Calvin Klein, Tommy Hilfiger, Levi's, Nautica, Halston, Champion, Converse, BCBG, French Connection, Starter, and major national sports leagues such as the NFL, NBA, NHL, and MLB. G-III was formed in 1989, with business operations dating back to 1974.

Summarised from the company's own disclosures, fiscal year ended Mar 2026

Industry Apparel Manufacturing Homepage giii.com
Sector Consumer Cyclical IR page giii.com
Tags
apparel, accessories, swimwear, outerwear, footwear, handbags, brand licensing, wholesale distribution, retail stores, digital platforms, DKNY, Donna Karan, Karl Lagerfeld, Vilebrequin, Eliza J, Jessica Howard, Andrew Marc, G.H. Bass, Wilsons Leather, Sonia Rykiel, Calvin Klein, Tommy Hilfiger, Levi's, Nautica, Halston, Champion, Converse, BCBG, French Connection, Starter, Kenneth Cole, Cole Haan, Dockers, Vince Camuto, Margaritaville, Karl Lagerfeld Paris, Marc New York, Kensie, G-III Sports by Carl Banks, Team Sports, Collegiate Licensing Company, Major League Baseball, National Basketball Association, National Football League, National Hockey League
Press page giii.com/blogs/news

Metrics

Valuation  
Market cap $ 1.163B
Market cap (USD) $ 1.163B
P/E 8.89
PEG —
P/BV 0.64
P/S 0.41
P/OCF 3.76
P/FCF 4.23
Dividend yield —
Turnover / mcap —
Returns  
ROE 3.9%
ROI 3.8%
ROIC 3.7%
Profit margin 2.3%
Growth  
Revenue growing No
Profits growing No
Revenue up 3y No
Revenue up 5y No
Earnings growth 3y (net profit CAGR) —
Quality  
Profitable Yes
Margin expanding No
Buying back stock Yes
Diluting (TTM) Yes
Debt/Equity 0.43%
Podcast bulls (TTM) Sign up
Podcast bears (TTM) Sign up
Podcast sentiment (TTM) Sign up
Podcast sentiment % (TTM) Sign up
News sentiment (TTM) 33
Quality score 5.9%
Insiders  
Buys, 1w Sign up
Buys, 1m Sign up
Buys, 1y Sign up
Sells, 1w Sign up
Sells, 1m Sign up
Sells, 1y Sign up

Sign up to see this company's insider trades

Figure FY 2025 FY 2024 FY 2023 FY 2022 FY 2021 FY 2020 FY 2019 FY 2018 FY 2017 FY 2016 FY 2015 FY 2014 FY 2013 FY 2012 FY 2011 FY 2010 FY 2008 FY 2007 FY 2006 FY 2005 FY 2004 FY 2003 FY 2002 FY 2001 FY 2000 FY 1999
Revenue 2.957B 3.181B 3.098B 3.227B 2.767B 2.055B 3.16B 3.076B 2.807B 2.386B 2.344B 2.117B 1.718B 1.4B 1.231B 1.063B 711.146M 518.868M 427.017M 324.072M 214.278M 224.061M 202.651M 201.426M 187.057M 149.632M
Net profit 67.353M 193.566M 176.168M -133.061M 200.593M 23.545M 143.837M 138.067M 62.124M 51.938M 114.333M 110.361M 77.36M 56.875M 49.62M 56.682M -14.029M 17.49M 13.189M 7.092M 703K 8.376M 382K 2.364M 11.154M 5.78M
Free cash flow 263.923M 274.884M 562.903M -126.127M 167.537M 58.723M 171.031M 74.624M 45.227M 80.767M 21.997M 39.034M 55.31M 42.879M -10.634M -48.056M 20.107M 9.178M -3.883M 2.083M -675K 12.16M 1.456M -4.936M 1.375M 5.893M

Figure FY 2025 FY 2024 FY 2023 FY 2022 FY 2021 FY 2020 FY 2019 FY 2018 FY 2017 FY 2016 FY 2015 FY 2014 FY 2013 FY 2012 FY 2011 FY 2010 FY 2008 FY 2007 FY 2006 FY 2005 FY 2004 FY 2003 FY 2002 FY 2001 FY 2000 FY 1999
Share price 28.96 32.62 33.98 13.71 27.64 23.74 32.81 27.89 36.89 29.56 44.26 94.17 71.83 33.82 23.28 35.13 5 20.02 21.73 14.49 — — — — — —
Price performance 12m -0.11 -0.04 1.48 -0.5 0.16 -0.28 0.18 -0.24 0.25 -0.33 -0.53 0.31 1.12 0.45 -0.34 0.94 -0.75 -0.08 0.5 — — — — — — —

Filed figures

Figure Jan 2017 Jan 2018 Jan 2019 Jan 2020 Jan 2021 Jan 2022 Jan 2023 Jan 2024 Jan 2025 Jan 2026
Balance sheet detail
Trade receivables (USD) 264M 294M 502M 530M 493M 606M 675M 562M 625M 537M
↳ YoY growth +19.1% +11.6% +70.5% +5.6% -7.1% +22.9% +11.5% -16.7% +11.1% -14.0%
↳ 5y CAGR +10.2% +10.6% +25.7% +21.7% +17.3% +18.1% +18.0% +2.3% +3.3% +1.7%
Borrowings, current (USD) — — — — — — — — — 7.1M
Borrowings, non-current (USD) — — — — — — — — — 4.64M
Lease liabilities (USD) — — 385M 312M 205M 186M 258M 235M 272M 273M
Cash and deposits (USD) 80M 45.8M 70.1M 197M 352M 466M 192M 508M 181M 407M
Intangible assets (USD) 48.6M 46.4M 42.4M 38.4M 35.1M 31.4M 34.8M 31.7M 27.1M 25.6M
Right-of-use assets (USD) — — 341M 270M 186M 170M 240M 217M 255M 258M
Net debt (borrowings + leases - cash) (USD) — — — — — — — — — -129M
Cash flow detail
Operating cash flow (USD) 106M 79.7M 104M 209M 74.8M 186M -105M 588M 316M 299M
Purchases of property, plant and equipment (USD) -24.9M -34.5M -29.2M -38M -16M -18.3M -21.5M -24.7M -41.5M -35.2M
Change in receivables (cash effect) (USD) -29.3M -29.9M -208M -28M 38.9M -113M -41M 113M -62.4M 87.7M
Change in inventories (cash effect) (USD) 12.6M -68.8M -23.6M 24.5M 144M -95.7M -164M 189M 42.3M 18.1M
Change in payables (cash effect) (USD) 12.4M 10.7M -328,000 -18.6M -94.2M 125M -107M 35M 50.1M 24.4M
Dividends paid (cash effect) (USD) — — — — — — — — — -4.22M
Share buybacks (cash effect) (USD) — — -20.3M -35.2M — -17.3M -26.9M -26.1M -60M -49.8M
Interest paid (cash effect) (USD) -21.8M -31.6M -35.8M -34.3M -16.4M -54.4M -44.1M -30.2M -27.4M -3.62M
Income taxes paid (cash effect) (USD) -18.9M -32.9M -44M -39M -1.97M -39.8M -38.1M -57.9M -67M -43M
Share-based compensation (USD) 16.9M 19.7M 19.7M 17.6M 6.14M 17.4M 32.5M 17.2M 28.9M 23.4M
Operating cash flow before change in receivables (USD) 135M 110M 312M 237M 35.9M 299M -63.6M 475M 379M 211M
Free cash flow (OCF - PPE - intangibles) (USD) 80.8M 45.2M 74.6M 171M 58.7M 168M -126M 563M 275M 264M
Income detail
Total comprehensive income (USD) 47.9M 84.3M 128M 141M 7.64M 188M -131M 183M 171M 117M
Comprehensive income to owners (USD) 47.9M 84.3M 128M 141M 7.59M 187M -133M 182M 171M 117M
Reported Apr 3, 2017 Apr 2, 2018 Jun 10, 2019 Mar 30, 2020 Mar 26, 2021 Mar 28, 2022 Mar 27, 2023 Mar 25, 2024 Mar 24, 2025 Sep 8, 2026

Sign up to see institutional holdings

Sign Up

Podcast Mentions

Sign up to see podcast mentions and sentiment

Sign Up

PDF Version

October 28, 2026 at 9:00 AM EDT

Irina Shayk Stars in Donna Karan New York's Fall/Winter 2026 Campaign

NEW YORK, Oct. 28, 2026 (GLOBE NEWSWIRE) -- Donna Karan New York has always been defined by two enduring muses: the woman and the city. One shapes the other. Together, they embody a spirit that is powerful yet effortless, timeless, and unmistakably modern.

Building on the story introduced in Fall 2026, Donna Karan New York unveils its latest campaign starring Irina Shayk, who returns to the brand embodying the confidence and modern femininity of the Donna Karan woman.

Irina Shayk Stars in Donna Karan New York's Fall/Winter 2026 Campaign

Photographed by Mert Alas, the campaign captures Irina in the warmth of golden hour—a woman in motion, moving effortlessly between day and night. Illuminated by reflective light, she brings a distinctly New York attitude to a series of dark sophisticated looks designed to transition seamlessly from day to evening.

Shayk embodies the collection’s effortless approach to dressing with ease. A belted leather trench is worn open over bare legs; a strapless leather sheath follows the body; a V-neck cocktail dress is punctuated with sculptural gold hardware; and a full-length sequin gown is layered beneath a long wool coat. Each look balances structure with femininity and ease with glamour.

With the black leather Bridgehampton Tote or Cashmere Clutch in hand, Shayk brings her unmistakable confidence to the silhouettes. Sculptural gold hardware illuminates the season’s rich black palette, continuing a signature of Fall 2026 and bringing a more glamorous, evening sensibility to the story.

At its heart, the campaign reflects what has always defined Donna Karan New York: clothes designed around a woman’s life—how she moves, how she feels and how she wants to present herself to the world.

The Donna Karan New York winter campaign launches October 28th, across all owned social channels featuring Irina Shayk. The collection is available at DonnaKaran.com and select retailers globally.

Creative Direction by Trey Laird Photography by Mert Alas Styled by Jessica Diehl Hair by Chris McMillan Makeup by Jamal Scott BTS by Adrian Martin and Natalie Paul Still Life by Natalie Paul

ABOUT DONNA KARAN NEW YORK

Donna Karan New York revolutionized women’s fashion in 1984 with Seven Easy Pieces, a groundbreaking system that made dressing effortless, sophisticated, and empowering. Now under the ownership of G-III Apparel Group, Ltd. since 2016, the brand enters a new chapter with its 2024 relaunch. While staying true to its original vision, the iconic Donna Karan New York has evolved to meet the needs of the modern woman, offering designs that inspire confidence with timeless, versatile pieces that seamlessly integrate into daily life. With expanded distribution, Donna Karan New York continues to bring its signature style to a broader audience, resonating with women globally.

PDF Version

October 26, 2026 at 1:48 PM EDT

NEW YORK, Oct. 26, 2026 /PRNewswire/ -- WHP Global and G-III Apparel Group, Ltd. (NasdaqGS: GIII) today announced a partnership with I.T Group, a leading omnichannel fashion retailer in Greater China, to accelerate the growth of the Marc Jacobs brand across the region. The transaction includes the first international licensing agreement since WHP Global and G-III acquired the global Marc Jacobs brand in September 2026.

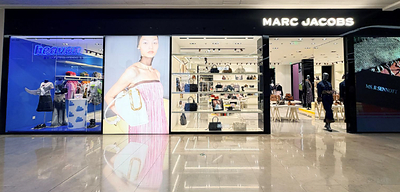
Marc Jacobs Kerry Centre store in Shanghai.

As part of the transaction, I.T Group has acquired the existing Marc Jacobs Greater China operating business and entered into a new long-term licensing agreement for the brand. I.T Group plans to invest in expanding Marc Jacobs' presence across Greater China through new standalone boutiques, shop-in-shop locations, digital commerce and wholesale distribution, building on the brand's existing retail footprint.

"Marc Jacobs has a distinctive creative identity and strong appeal among consumers in Greater China," said Sham Kar Wai, Founder and Chairman of I.T Group. "With our omnichannel platform, deep local market knowledge and nearly four decades of experience building international fashion brands in the region, we see significant potential to accelerate the brand's growth through retail expansion and digital commerce, bringing Marc Jacobs to more consumers across Greater China."

Founded in Hong Kong in 1988, I.T Group is a leading omnichannel, multi-faceted fashion retailer with more than 280 points of sale and a growing eCommerce platform across Greater China. The company operates multiple retail concepts, including I.T, i.t, EXI.T, and its digital platform features more than 400 designer, contemporary and streetwear labels. Led by Sham Kar Wai, I.T Group has a proven track record of introducing and developing international fashion brands across the region, including A Bathing Ape, Acne Studios, Carhartt WIP, Comme des Garçons, Off-White, Palm Angels, Stussy, among others.

"We see a strong future for Marc Jacobs and are focused on building the business for the long term," said Morris Goldfarb, Chairman and Chief Executive Officer of G-III Apparel Group. "Our approach is to look at each market individually and put the right capabilities in place to drive the business. I.T Group has a strong track record in Greater China, and we are confident in what we can accomplish together."

"We are focused on executing our global growth strategy for Marc Jacobs, and our partnership with I.T Group for China is an important milestone," stated Yehuda Shmidman, Founder, Chairman and CEO of WHP Global. "Marc Jacobs has a distinctive creative identity and strong global recognition, with significant opportunities to expand. This is just the beginning."

About WHP GlobalWHP Global (www.whp-global.com) is one of the largest brand management platforms in the world, operating across fashion, sports and hardgoods. The company's owned portfolio includes Marc Jacobs, Vera Wang, rag & bone, G-STAR, Joe's Jeans, Express, Bonobos, Anne Klein, Joseph Abboud, Lands' End, Toys"R"Us and LOTTO. Together, WHP Global's brands generate over USD $9.5 billion in annual retail sales across 80+ countries. Headquartered in New York with offices worldwide, WHP Global partners with more than 200 leading operators to drive brand growth and innovation, accelerated by proprietary initiatives including WHP Global's A.I. Taskforce.

Prompts

G-III Apparel Group, LTD. (ticker GIII), listed in United States.

ETFs Holding G-III Apparel Group, LTD.

ETF Weight in ETF Shares Market value As of
SIXS 1.31% 60,219 $ 1.897M Nov 12, 2026
MYLD 1.04% 9,730 $ 354.269K Jul 31, 2026
VAMO 0.94% 28,080 $ 1.022M Jul 31, 2026
COPY 0.75% 97,105 $ 3.165M Aug 31, 2026
DSMC 0.66% 25,201 $ 849.526K Jun 30, 2026
LITL 0.55% 1,018 $ 31.456K Nov 17, 2026
SQLV 0.45% 3,834 $ 129.244K Jun 30, 2026
BSVO 0.28% 220,487 $ 6.81M Nov 18, 2026
AFSM 0.22% 10,357 $ 324.278K Nov 16, 2026
VFMF 0.17% 52,343 $ 1.706M Aug 31, 2026
SMDX 0.17% 6,846 $ 214.348K Nov 17, 2026
AVUV 0.16% 1,692,296 $ 52.986M Nov 16, 2026
VFVA 0.14% 41,851 $ 1.364M Aug 31, 2026
SEIS 0.14% 23,710 $ 799.264K Jun 30, 2026
VFQY 0.11% 17,537 $ 571.531K Aug 31, 2026
DFSV 0.10% 854,788 $ 26.926M Nov 12, 2026
AVSC 0.08% 79,171 $ 2.479M Nov 16, 2026
IVSS 0.08% 623 $ 21.001K Jun 30, 2026
JMEE 0.07% 68,645 $ 2.121M Nov 17, 2026
DFAT 0.06% 614,337 $ 19.352M Nov 12, 2026
PSC 0.05% 34,457 $ 1.162M Jun 30, 2026
RESM 0.05% 52 $ 1,752.92 Jun 30, 2026
MKTN short -0.04% -1,146 $ -38.632K Jun 30, 2026
DFAS 0.03% 326,871 $ 10.296M Nov 12, 2026
SFGV 0.02% 6,310 $ 190K Nov 18, 2026
DXUV 0.02% 32,589 $ 1.027M Nov 12, 2026
MSSM 0.01% 3,261 $ 106.276K Aug 31, 2026
AVUS 0.01% 28,428 $ 890.081K Nov 16, 2026
AVSU 0.01% 1,989 $ 62.276K Nov 16, 2026
DFAC 0.01% 193,638 $ 6.1M Nov 12, 2026
DFSU 0.01% 5,139 $ 161.879K Nov 12, 2026
DFUV 0.01% 33,125 $ 1.043M Nov 12, 2026
DCOR 0.00% 69,334 $ 2.184M Nov 12, 2026
DFAU 0.00% 11,599 $ 365.369K Nov 12, 2026
DFUS 0.00% 11,948 $ 376.362K Nov 12, 2026
EBI 0.00% 208 $ 6,778.72 Aug 31, 2026