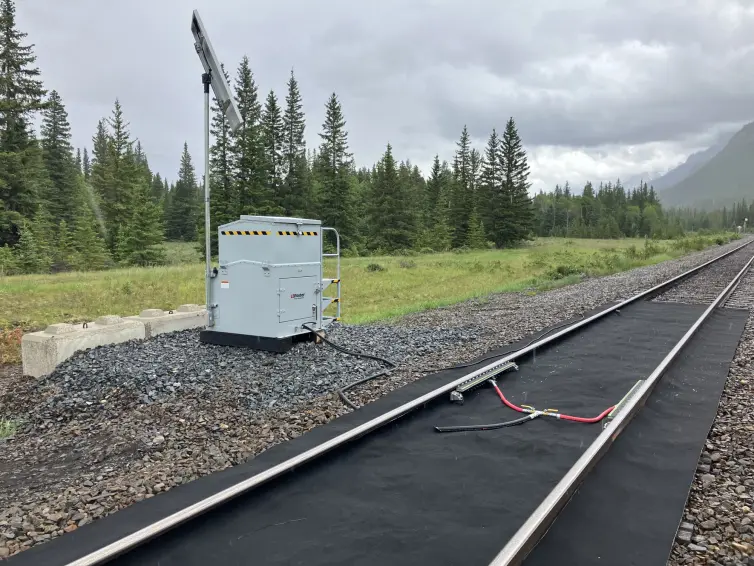
L.B. Foster Company is a technology solutions provider that designs, manufactures, and services engineered products for rail and civil infrastructure. Founded in 1902, the company operates through two segments: Rail, Technologies, and Services, and Infrastructure Solutions. The Rail segment supplies track components, insulated rail joints, and friction management systems to freight and passenger railroads, while its Technology Services unit offers condition monitoring systems like Total Track Monitoring and digital communication solutions. The Infrastructure segment produces precast concrete buildings under the CXT brand, steel bridge products, and protective pipe coatings for the North American civil infrastructure market. The company serves customers in North America, South America, Europe, and Asia, with key subsidiaries including Allegheny Rail Products, CXT Incorporated, and VanHooseCo Precast LLC.

Summarised from the company's own disclosures, fiscal year ended Mar 2026

Industry Building Products & Equipment Homepage lbfoster.com
Sector Industrials IR page lbfoster.com/about/investor-relations
Tags
rail infrastructure, precast concrete, friction management, track monitoring, steel bridge products, pipe coatings, transit systems, civil engineering, CXT, Allegheny Rail Products, Transit Products, Global Friction Management, Technology Services and Solutions, Total Track Monitoring, Wheel Impact Load Detector, ANATOMY Asset Intelligence, Toughcoat, ENVIROCAST, ENVIROKEEPER, VanHooseCo Precast, Subklew Mosaic Mimic System, Inform, Redi-Rock, TGA, ALLEVIATE
Press page lbfoster.com/news

Metrics

Valuation  
Market cap $ 374.292M
Market cap (USD) $ 374.292M
P/E 27.96
PEG —
P/BV 2.01
P/S 0.64
P/OCF 7.04
P/FCF 9.01
Dividend yield 0.11%
Turnover / mcap —
Returns  
ROE 4.3%
ROI 3.5%
ROIC 5.0%
Profit margin 1.4%
Growth  
Revenue growing No
Profits growing No
Revenue up 3y No
Revenue up 5y No
Earnings growth 3y (net profit CAGR) —
Quality  
Profitable Yes
Margin expanding Yes
Buying back stock Yes
Diluting (TTM) Yes
Debt/Equity 24.4%
Podcast bulls (TTM) Sign up
Podcast bears (TTM) Sign up
Podcast sentiment (TTM) Sign up
Podcast sentiment % (TTM) Sign up
News sentiment (TTM) 51
Quality score -5.6%
Insiders  
Buys, 1w Sign up
Buys, 1m Sign up
Buys, 1y Sign up
Sells, 1w Sign up
Sells, 1m Sign up
Sells, 1y Sign up

Sign up to see this company's insider trades

Figure FY 2025 FY 2024 FY 2023 FY 2022 FY 2021 FY 2020 FY 2019 FY 2018 FY 2017 FY 2016 FY 2015 FY 2014 FY 2013 FY 2012 FY 2011 FY 2010 FY 2008 FY 2007 FY 2006 FY 2005 FY 2004 FY 2003 FY 2002 FY 2001 FY 2000 FY 1999
Revenue 540.009M 530.765M 543.744M 497.497M 513.62M 497.411M 655.057M 626.969M 536.377M 483.514M 624.523M 607.192M 597.963M — — — 512.592M 508.981M 389.788M 353.484M 297.866M 264.266M 257.95M 282.242M 264.614M 241.923M
Net profit 7.545M 42.946M 1.464M -45.564M 3.626M 7.582M 42.568M -31.168M 4.113M -141.66M -44.445M 25.656M 29.29M 16.188M 22.895M 20.492M 27.746M 110.693M 13.53M 5.434M 1.48M 3.44M -11.424M 637K 3.49M 2.503M
Free cash flow 25.195M 12.841M 32.443M -18.209M -5.43M 11.37M 20.466M 20.713M 33.223M 10.741M 41.259M 49.56M 4.206M 19.13M 18.731M 53.322M 19.261M -10.387M -30.665M -18.914M -3.098M 6.342M 13.49M 17.281M -3.544M -1.7M

Figure FY 2025 FY 2024 FY 2023 FY 2022 FY 2021 FY 2020 FY 2019 FY 2018 FY 2017 FY 2016 FY 2015 FY 2014 FY 2013 FY 2012 FY 2011 FY 2010 FY 2008 FY 2007 FY 2006 FY 2005 FY 2004 FY 2003 FY 2002 FY 2001 FY 2000 FY 1999
Share price 26.95 26.9 21.99 9.68 13.75 15.05 19.38 15.9 27.15 13.6 13.66 48.57 47.29 43.43 28.94 40.91 35 48.81 22.51 12 — — — — — —
Price performance 12m 0 0.22 1.27 -0.3 -0.09 -0.22 0.22 -0.41 1 -0 -0.72 0.03 0.09 0.5 -0.29 0.35 -0.28 1.17 0.88 — — — — — — —

Filed figures

Figure Dec 2016 Dec 2017 Dec 2018 Dec 2019 Dec 2020 Dec 2021 Dec 2022 Dec 2023 Dec 2024 Dec 2025
Balance sheet detail
Trade receivables (USD) 63.3M 72.4M 82.3M 78.4M 58.2M 55.9M 82.5M 53.5M 65M 80.6M
↳ YoY growth -18.5% +14.3% +13.7% -4.7% -25.8% -4.0% +47.5% -35.1% +21.5% +24.0%
↳ 5y CAGR -1.6% +4.4% -3.3% -2.6% -5.6% -2.4% +2.6% -8.3% -3.7% +6.7%
Borrowings, current (USD) 10.4M 656,000 629,000 2.91M 119,000 98,000 127,000 102,000 167,000 153,000
Borrowings, non-current (USD) 149M 129M 74.4M 55.3M 44.9M 31.2M 91.8M 55.2M 46.8M 42.6M
Lease liabilities (USD) — — 0.00 13.8M 16.3M 15.3M 17.6M 15.1M 19M 29.2M
Cash and deposits (USD) 30.4M 37.7M 10.3M 14.2M 7.56M 10.4M 2.88M 2.56M 2.45M 4.35M
Intangible assets (USD) 63.5M 57.4M 49.8M 43.5M 36.9M 31M 23.8M 19M 14.8M 11.5M
Right-of-use assets (USD) — — — 13.3M 16.1M 15.1M 17.3M 14.9M 18.5M 28.3M
Net debt (borrowings + leases - cash) (USD) 129M 92.3M 64.7M 57.9M 53.8M 36.2M 107M 67.8M 63.4M 67.6M
Cash flow detail
Operating cash flow (USD) 18.4M 39.4M 26M 29.3M 20.5M -810,000 -10.6M 37.4M 22.6M 35.6M
Purchases of property, plant and equipment (USD) -7.66M -6.15M -5.25M -8.83M -9.18M -4.62M -7.63M -4.93M -9.79M -10.4M
Change in inventories (cash effect) (USD) 10.5M -12.6M -23.4M 6.69M 3.28M -3.97M -11.8M -6.99M 2.38M 9.58M
Change in payables (cash effect) (USD) -16M 14.6M 24.2M -12.7M -8.95M -13.6M 10.1M -3.75M 10.4M 2.01M
Dividends paid (cash effect) (USD) -1.24M 0.00 — — — — — — — —
Share buybacks (cash effect) (USD) -342,000 -103,000 -316,000 -621,000 -1.67M -732,000 -410,000 -2.63M -8.24M -16.5M
Interest paid (cash effect) (USD) -4.86M -7.59M -5.58M -4.59M -3.27M -2.62M -2.7M -5.45M -4.66M -4.92M
Income taxes paid (cash effect) (USD) -3.94M 11.2M -4.51M -6.51M -2.63M -1.49M 5.01M 221,000 -1.63M -1.63M
Share-based compensation (USD) 1.35M 1.7M 3.84M 3.16M 1.14M 1.95M 2.38M 4.18M 3.83M 5.06M
Free cash flow (OCF - PPE - intangibles) (USD) 10.7M 33.2M 20.7M 20.5M 11.4M -5.43M -18.2M 32.4M 12.8M 25.2M
Income detail
Research and development expense (USD) 3.51M 2.24M 2.65M 2.61M 2.64M 2.23M 2.22M 2.56M 2.83M 3.64M
↳ 5y CAGR +13.1% -5.2% -3.5% -3.3% -7.7% -8.7% -0.2% -0.7% +1.6% +6.6%
Total comprehensive income (USD) -149M 11.6M -35.6M 45.2M 25.7M 4.98M -47.9M 3.21M 40.4M 8.4M
Comprehensive income to owners (USD) -149M 11.6M -35.6M 45.2M 25.7M 4.98M -47.9M 3.35M 40.4M 8.37M
Provision for credit losses (USD) — 846,000 -1.44M -48,000 365,000 -87,000 382,000 1.02M 700,000 1.16M
Credit cost ratio (credit losses / average receivables) (%) — 1.2% 1.9% 0.1% 0.5% 0.2% 0.6% 1.5% 1.2% 1.6%
Reported Mar 8, 2017 Mar 18, 2019 May 10, 2019 Feb 27, 2020 Mar 3, 2021 Mar 2, 2022 Mar 10, 2023 Mar 6, 2024 Mar 7, 2025 Mar 5, 2026

Sign up to see institutional holdings

Sign Up

Podcast Mentions

Sign up to see podcast mentions and sentiment

Sign Up

November 4, 2026

PDF Version

Unless otherwise noted, all comparisons are to the third quarter of 2025.

  • Third quarter sales increased 21.5% to $168.0 million; gross profit up $3.4 million or 10.8%

  • Third quarter net income grew 56.5% to $6.8 million; Adjusted EBITDA1up 15.1% to $13.1 million

  • First nine months sales increased 12.7% to $427.7 million; gross profit up $8.9 million or 10.8%

  • First nine months net income grew 125.4% to $11.4 million; Adjusted EBITDA up 17.6% to $29.9 million

  • Generated quarterly operating cash flow of $23.6 million with total debt for the quarter at $28.7 million

  • Gross Leverage Ratio1improved 1.0x turns year over year, ending the quarter at 0.6x

PITTSBURGH, Nov. 04, 2026 (GLOBE NEWSWIRE) -- L.B. Foster Company (Nasdaq: FSTR), a global technology solutions provider of products and services for the rail and infrastructure markets (the "Company"), today reported its 2026 third quarter operating results.

Third Quarter 2026 Highlights

| | | Three Months Ended September 30, | | Change |

| | | | 2026 | | | 2025 | | 2026 vs. 2025 |

| | | | | | | |

| $ in thousands, unless otherwise noted: | | (Unaudited) | | |

| Net sales | | $ | 167,996 | | $ | 138,286 | | 21.5 | % |

| Operating income | | | 10,080 | | | 8,295 | | 21.5 | % |

| Net income attributable to L.B. Foster Company | | | 6,764 | | | 4,354 | | 55.4 | % |

| Adjusted EBITDA | | | 13,075 | | | 11,359 | | 15.1 | % |

| Net cash provided by operating activities | | | 23,553 | | | 29,181 | | (19.3)% |

| Free Cash Flow1 | | | 20,830 | | | 26,372 | | (21.0)% |

| Total debt | | | 28,690 | | | 58,722 | | (51.1)% |

| Gross Leverage Ratio1 | | 0.6x | | 1.6x | | (1.0)x |

| New orders, net1 | | $ | 155,759 | | $ | 114,776 | | 35.7 | % |

| Backlog1 | | $ | 234,741 | | $ | 247,416 | | (5.1)% |

Financial Guidance

| 2026 Full Year Financial Guidance Update | | Low | | | High | |

| Net sales | | $ | 570,000 | | | $ | 590,000 | |

| Adjusted EBITDA | | $ | 42,000 | | | $ | 45,000 | |

| Capital spending as a percent of sales | | ~2.0 | % | | ~2.2 | % |

| Free Cash Flow | | $ | 20,000 | | | $ | 28,000 | |

CEO Comments

John Kasel, President and Chief Executive Officer, commented, "We started the second half of the year with strong momentum, delivering meaningful growth in sales, profitability, and cash generation during the third quarter. Sales increased 21.5% over the prior year quarter, reflecting strong growth across both segments, while Adjusted EBITDA1 increased 15.1%. Gross profit expanded $3.4 million during the quarter despite a decline in gross margin of 200 bps to 20.5%. The margin decrease was primarily attributable to business mix within Rail, Technologies, and Services ("Rail"), reflecting stronger sales growth in the lower-margin Rail Distribution and UK businesses. Additionally, selling and administrative expense as a percentage of sales declined 190 bps to 14.1% reflecting continued operating discipline and sales growth. On a year-to-date basis, we are pleased with our sales growth of $48.1 million or 12.7% with growth occurring in both segments. This growth helped drive a $4.5 million, or 17.6%, expansion in Adjusted EBITDA1 over the prior year."

Mr. Kasel continued, "Our third quarter operating cash flow of $23.6 million enabled us to reduce total debt by $19.3 million during the quarter and by $30.0 million compared to the prior year quarter, to the lowest level in over a decade. The continued strengthening of our balance sheet provides additional financial flexibility and positions us well to pursue our strategic growth initiatives. Consistent with that strategy, as reported in our press release dated October 29, 2026, we completed the acquisition of the operating assets of the residential wastewater precast business and the Aeris aerobic treatment systems platform of Dulworth Enterprises Inc. ("Dulworth") on October 28, 2026 for approximately $52.2 million. Our revised guidance assumes no material impact from this acquisition and excludes any impacts of purchase accounting adjustments and transaction-related costs."

Mr. Kasel concluded, "We continue to see healthy customer demand, particularly across our Rail Distribution and UK businesses, driving year-over-year growth in new orders and supporting an increase in our full-year sales outlook. Additionally, we are narrowing our full-year guidance range for Adjusted EBITDA and increasing our Free Cash Flow range to reflect our current business mix and operating conditions. As we enter the final quarter of the year, we remain focused on disciplined execution, cash generation, and integrating Dulworth."

1 See "Non-GAAP Disclosures" at the end of this press release for a description of and information regarding EBITDA, Adjusted EBITDA, gross leverage ratio per the Company's credit agreement, new orders, net, backlog, book-to-bill ratio, free cash flow, and related reconciliations to the comparable United States Generally Accepted Accounting Principles financial measures.

Third Quarter 2026 Consolidated Results

The Company’s third quarter performance highlights are reflected below:

| | | Three Months Ended September 30, | | Change | | Percent Change |

| | | | 2026 | | | | 2025 | | | 2026 vs. 2025 | | 2026 vs. 2025 |

| | | | | | | | | |

| $ in thousands, unless otherwise noted: | | (Unaudited) | | | | |

| Net sales | | $ | 167,996 | | | $ | 138,286 | | | $ | 29,710 | | | 21.5 | % |

| Gross profit | | | 34,426 | | | | 31,066 | | | | 3,360 | | | 10.8 | |

| Gross profit margin | | | 20.5 | % | | | 22.5 | % | | (200) bps | | (8.9 | ) |

| Selling and administrative expenses | | $ | 23,729 | | | $ | 22,077 | | | $ | 1,652 | | | 7.5 | |

| Selling and administrative expenses as a percent of sales | | | 14.1 | % | | | 16.0 | % | | (190) bps | | (11.9 | ) |

| Amortization expense | | | 617 | | | | 694 | | | | (77 | ) | | (11.1 | ) |

| Operating income | | $ | 10,080 | | | $ | 8,295 | | | $ | 1,785 | | | 21.5 | |

| Net income attributable to L.B. Foster Company | | | 6,764 | | | | 4,354 | | | | 2,410 | | | 55.4 | |

| Adjusted EBITDA | | | 13,075 | | | | 11,359 | | | | 1,716 | | | 15.1 | |

| New orders, net1 | | | 155,759 | | | | 114,776 | | | | 40,983 | | | 35.7 | |

| Backlog1 | | | 234,741 | | | | 247,416 | | | | (12,675 | ) | | (5.1 | ) |

| | | | | | | | | | | | | | | | |

  • Sales for the 2026 third quarter increased $29.7 million, or 21.5%, over the prior year quarter, driven by higher sales in both segments. Rail increased $25.1 million, or 32.3%, while Infrastructure increased $4.6 million, or 7.6%.

  • Gross profit for the 2026 third quarter improved by $3.4 million or 10.8% over the prior year quarter. Rail gross profit increased $2.4 million and Infrastructure gross profit increased $0.9 million driven by improved volumes in both segments. Gross margins declined 200 basis points to 20.5% driven by business mix in Rail due to sales growth in our lower-margin Rail Distribution and UK businesses.

  • Selling and administrative expenses for the 2026 third quarter increased $1.7 million, or 7.5%, over the prior year quarter, primarily due to increased employment costs, including higher variable incentive-based compensation costs and medical costs. Selling and administrative expenses as a percentage of net sales decreased 190 basis points to 14.1%.

  • Operating income for the 2026 third quarter increased $1.8 million, or 21.5%, over the prior year quarter. The increase was driven by improved gross profit offset in part by higher selling and administrative costs.

  • Net income attributable to the Company for the 2026 third quarter improved $2.4 million, or 55.4%, over the prior year quarter due to improved operating income, reduced interest expense, and a lower income tax expense.

  • Adjusted EBITDA for the 2026 third quarter increased $1.7 million, or 15.1%, over the prior year quarter.

  • Cash provided by operating activities totaled $23.6 million in the 2026 third quarter, unfavorable $5.6 million compared to $29.2 million in the prior year quarter.

  • Total debt as of September 30, 2026 was $28.7 million, decreasing by $30.0 million from the prior year quarter and by $19.3 million during the quarter. The reduction is due to strong Free Cash Flow generation and lower working capital requirements during the period. The Company's Gross Leverage Ratio per its credit facility was 0.6x as of September 30, 2026, down from 1.6x last year, reflecting higher profitability and lower working capital.

  • New orders, net for the 2026 third quarter increased $41.0 million, or 35.7%, over the prior year quarter, reflecting growth in Infrastructure and due to a $19 million order that was cancelled in the prior year. The trailing twelve month book-to-bill ratio1 was 0.98 : 1.00. Backlog decreased $12.7 million, or 5.1%, from the prior year quarter, as a 9.8% decline in Rail backlog more than offset a modest 1.0% increase in Infrastructure backlog. Sequentially, backlog decreased $11.4 million, or 4.6%, primarily due to higher sales volumes and seasonally lower order activity.

Third Quarter 2026 Business Results by Segment

Rail, Technologies, and Services Segment

| | | Three Months Ended September 30, | | Change | | Percent Change |

| $ in thousands, unless otherwise noted: | | | 2026 | | | | 2025 | | | 2026 vs. 2025 | | 2026 vs. 2025 |

| Net sales | | $ | 102,921 | | | $ | 77,788 | | | $ | 25,133 | | | 32.3 | % |

| Gross profit | | $ | 20,181 | | | $ | 17,746 | | | $ | 2,435 | | | 13.7 | |

| Gross profit margin | | | 19.6 | % | | | 22.8 | % | | (320) bps | | (14.0 | ) |

| Segment operating income | | $ | 7,890 | | | $ | 5,895 | | | $ | 1,995 | | | 33.8 | |

| Segment operating income margin | | | 7.7 | % | | | 7.6 | % | | 10 bps | | 1.3 | |

| New orders, net1 | | $ | 87,099 | | | $ | 86,360 | | | $ | 739 | | | 0.9 | |

| Backlog1 | | $ | 126,443 | | | $ | 140,233 | | | $ | (13,790 | ) | | (9.8 | ) |

| | | | | | | | | | | | | | | | |

  • Sales for the 2026 third quarter increased $25.1 million, or 32.3%, over the prior year quarter. Rail Products sales increased $24.4 million, or 54.6%, due to higher volumes across all of our Rail Products businesses. Technology Services and Solutions ("TS&S") sales also increased $2.7 million, or 22.7%, driven by short-term project work in the UK. These increases were partially offset by a decline in Global Friction Management of $1.9 million, or 9.0%, due to project timing, as certain projects were executed in the first half of the year.

  • Gross profit for the 2026 third quarter increased $2.4 million, or 13.7%, over the prior year quarter, primarily driven by higher sales within Rail Products which contributed $2.5 million. TS&S gross profit increased $0.9 million, reflecting improved volumes and favorable business mix. These improvements were partially offset by a gross profit decline of $1.0 million in Global Friction Management due to lower volumes. Gross margin declined 320 basis points to 19.6% reflecting unfavorable sales mix resulting from significant sales growth in our lower-margin Rail Distribution and UK businesses.

  • Segment operating income for the 2026 third quarter increased $2.0 million, or 33.8%, over the prior year quarter driven by the increase in gross profit partially offset by increased selling and administrative expenses.

  • New orders, net for the 2026 third quarter increased $0.7 million, or 0.9%, over the prior year quarter, as strong order activity in Rail Products, which increased 55.0%, more than offset declines of 10.2% in Global Friction Management. TS&S orders declined 59.7% due to a large order received in our UK business in the prior year. The trailing twelve month book-to-bill ratio1 was 0.96 : 1.00. Backlog decreased $13.8 million from the prior year quarter due to higher sales volumes in the quarter.

Infrastructure Solutions Segment

| | | Three Months Ended September 30, | | Change | | Percent Change |

| $ in thousands, unless otherwise noted: | | | 2026 | | | | 2025 | | | 2026 vs. 2025 | | 2026 vs. 2025 |

| Net sales | | $ | 65,075 | | | $ | 60,498 | | | $ | 4,577 | | 7.6 | % |

| Gross profit | | $ | 14,245 | | | $ | 13,320 | | | $ | 925 | | 6.9 | |

| Gross profit margin | | | 21.9 | % | | | 22.0 | % | | (10) bps | | (0.5 | ) |

| Segment operating income | | $ | 4,373 | | | $ | 4,147 | | | $ | 226 | | 5.4 | |

| Segment operating income margin | | | 6.7 | % | | | 6.9 | % | | (20) bps | | (2.9 | ) |

| New orders, net1 | | $ | 68,660 | | | $ | 28,416 | | | $ | 40,244 | | 141.6 | |

| Backlog1 | | $ | 108,298 | | | $ | 107,183 | | | $ | 1,115 | | 1.0 | |

| | | | | | | | | | | | | | | |

  • Sales for the 2026 third quarter increased $4.6 million, or 7.6%, over the prior year quarter. The increase was driven by sales growth of $3.9 million, or 9.0%, in Precast and $0.7 million, or 4.1%, in Steel Products.

  • Gross profit for the 2026 third quarter increased $0.9 million, or 6.9%, over the prior year quarter. Precast gross profit improved $0.7 million and Steel Products improved $0.3 million due to higher volumes. Gross profit margin modestly declined 10 basis points to 21.9%.

  • Segment operating income for the 2026 third quarter increased $0.2 million over the prior year quarter due to improved gross profit partially offset by higher selling and administrative expenses.

  • New orders, net for the 2026 third quarter increased $40.2 million, or 141.6%, over the prior year quarter, driven by growth in Steel Products, due in part to a $19 million order that was cancelled in the prior year, and a 29.5% increase in Precast. The trailing twelve month book-to-bill ratio1 was 1.00 : 1.00. Backlog increased $1.1 million over the prior year quarter due to a 52.6% improvement in Steel Products which offset a decline of 11.7% in Precast.

First Nine Months Consolidated Highlights

| | | Nine Months Ended September 30, | | Change | | Percent Change |

| | | | 2026 | | | | 2025 | | | 2026 vs. 2025 | | 2026 vs. 2025 |

| | | | | | | | | |

| $ in thousands, unless otherwise noted: | | (Unaudited) | | | | |

| Net sales | | $ | 427,690 | | | $ | 379,636 | | | $ | 48,054 | | | 12.7 | % |

| Gross profit | | | 90,996 | | | | 82,117 | | | | 8,879 | | | 10.8 | |

| Gross profit margin | | | 21.3 | % | | | 21.6 | % | | (30) bps | | (1.4 | ) |

| Selling and administrative expenses | | $ | 70,867 | | | $ | 65,411 | | | $ | 5,456 | | | 8.3 | |

| Selling and administrative expenses as a percent of sales | | | 16.6 | % | | | 17.2 | % | | (60) bps | | (3.5 | ) |

| Amortization expense | | | 1,853 | | | | 2,656 | | | | (803 | ) | | (30.2 | ) |

| Operating income | | $ | 18,276 | | | $ | 14,050 | | | $ | 4,226 | | | 30.1 | |

| Net income attributable to L.B. Foster Company | | | 11,376 | | | | 5,129 | | | | 6,247 | | | 121.8 | |

| Adjusted EBITDA | | | 29,888 | | | | 25,412 | | | | 4,476 | | | 17.6 | |

| New orders, net1 | | | 473,923 | | | | 439,595 | | | | 34,328 | | | 7.8 | |

| Backlog1 | | | 234,741 | | | | 247,416 | | | | (12,675 | ) | | (5.1 | ) |

| | | | | | | | | | | | | | | | |

  • Sales for the first nine months of 2026 increased $48.1 million, or 12.7%, over the prior year period. The increase was driven by Rail sales growth of $41.9 million, or 20.2%, led by Rail Products which increased $23.3 million, or 19.2%. Global Friction Management and TS&S also increased $7.9 million, or 13.8%, and $10.7 million, or 36.9%, respectively. Infrastructure sales improved $6.1 million, or 3.6%. The improvement was driven primarily by Precast with sales growth of $9.7 million, or 8.2%, offset in part by Steel Products which declined $3.5 million, or 6.5%.

  • Gross profit for the first nine months of 2026 increased $8.9 million, or 10.8%, over the prior year period driven by improved volumes in Rail which increased $6.2 million. Rail gross profit for the first nine months of 2026 includes $2.1 million of costs associated with the exit of certain product lines within the Tew Engineering business (the "Tew Exit") and for the first nine months of 2025 includes $1.1 million of costs associated with the exit of the UK Automation and Materials Handling product line (the "AMH Exit"). Infrastructure gross profit improved $2.7 million due to favorable business mix and manufacturing efficiency. Gross margins declined by 30 basis points to 21.3% due to sales growth in our lower-margin Rail Distribution and UK businesses.

  • Selling and administrative expenses for the first nine months of 2026 increased $5.5 million, or 8.3%, over the prior year period, primarily due to higher employment costs including higher variable incentive-based compensation costs and medical costs. Selling and administrative expenses for the first nine months of 2026 included $0.6 million of Tew Exit and other strategic initiatives costs including the Dulworth acquisition compared to the first nine months of 2025 which included $0.3 million of AMH Exit costs. Selling and administrative expenses as a percentage of net sales decreased 60 basis points to 16.6%.

  • Operating income for the first nine months of 2026 improved $4.2 million over the prior year period. The improvement was primarily driven by higher gross profit and lower amortization expense partially offset by an increase in selling and administrative expenses.

  • Net income attributable to the Company for the first nine months of 2026 improved $6.2 million over the prior year period driven by higher operating income, reduced interest expense, and lower income tax expense.

  • Adjusted EBITDA for the first nine months of 2026 improved $4.5 million, or 17.6%, over the prior year period and was adjusted for $0.4 million of strategic initiative costs including the Dulworth acquisition and $2.3 million of Tew Exit costs. The first nine months of 2025 was adjusted for the $1.4 million of AMH Exit costs.

  • Cash provided by operating activities totaled $31.0 million for the first nine months of 2026, a $17.5 million improvement compared to cash provided by operating activities of $13.4 million in the prior year period.

  • New orders, net for the first nine months of 2026 increased $34.3 million, or 7.8%, over the prior year period, driven by a 24.6% increase in Infrastructure, which benefited from an order cancellation in the Steel Products business during the prior year period, and more than offset a 1.4% decline in Rail.

Third Quarter Conference Call

L.B. Foster Company will conduct a conference call and webcast to discuss its third quarter 2026 operating results on Wednesday, November 4, 2026 at 8:30 AM ET. The call will be hosted by Mr. John Kasel, President and Chief Executive Officer. Listen via audio and access the slide presentation on the L.B. Foster website: www.lbfoster.com, under the Investor Relations page. A conference call replay will be available through November 11, 2026 via webcast through L.B. Foster’s Investor Relations page of the company’s website.

Those interested in participating in the question-and-answer session may register for the call at https://register-conf.media-server.com/register/BId76b0b71870444b4b44b824b96f901d6 to receive the dial-in numbers and unique PIN to access the call. The registration link will also be available on the Company’s Investor Relations page of its website.

L.B. Foster Company Announces Executive Officer Changes Bull 0 Bear 0 Management

November 2, 2026

PDF Version

PITTSBURGH, Nov. 02, 2026 (GLOBE NEWSWIRE) -- L.B. Foster Company (NASDAQ: FSTR), a global technology solutions provider of products and services for the Rail and Infrastructure markets, announced today that its Board of Directors has approved certain changes among its executive officers effective November 1, 2026 (the Effective Date).

Ms. Sara Rolli currently serves as the Company’s Senior Vice President – Operational Administration and is appointed Senior Vice President – Steel Products and Operational Excellence on the Effective Date, and will continue to report to Bill Thalman, Executive Vice President and Chief Operating Officer. In addition to her current responsibilities overseeing the Company’s Quality, EHS and Continuous Improvement functions, Ms. Rolli will now have operational oversight of the Steel Products business unit within the Company’s Infrastructure segment. Ms. Rolli, age 45, has served as SVP – Operational Administration since 2025, served as VP – Operational Administration from 2023 – 2025, and served as the Company’s Director of Quality from 2019 – 2023. She was also Senior Quality Manager from 2015 – 2017 and Site Quality Manager from 2013 – 2015. Prior to joining the Company, Ms. Rolli was employed by Kennametal, Inc. and Praxair. Ms. Rolli holds Bachelor of Science and Master of Arts degrees from Waynesburg University.

In connection with Ms. Rolli’s change in responsibilities, Mr. Robert (Bob) Ness, currently serving as Senior Vice President – Infrastructure segment, is appointed Senior Vice President – Precast Concrete Products on the Effective Date, also continuing to report to Mr. Thalman. He will cease to serve as SVP – Infrastructure on the Effective Date and will lead the Company’s Precast Concrete Products business unit.

Mr. Thalman commented, “We’re pleased to recognize Sara with this important change to her responsibilities. She’s been a valued leader in our organization for over a decade, establishing rigor and sustainability in our Quality, Lean and EHS business processes. This additional assignment overseeing the Steel Products business unit is the next step in her career progression and adds to our operational bench strength. The change also provides Bob with additional bandwidth to focus on our growth initiatives for the Precast Concrete business unit, which is a critical growth platform within our strategic playbook. I congratulate Sara on this well-deserved recognition and look forward to the contributions both Sara and Bob will make in the future.”

Forward-Looking Statements

This release may contain “forward-looking” statements within the meaning of Section 21E of the Securities Exchange Act of 1934, as amended, and Section 27A of the Securities Act of 1933, as amended. Forward-looking statements provide management's current expectations of future events based on certain assumptions and include any statement that does not directly relate to any historical or current fact. Sentences containing words such as “believe,” “intend,” “plan,” “may,” “expect,” “should,” “could,” “anticipate,” “estimate,” “predict,” “project,” or their negatives, or other similar expressions of a future or forward-looking nature generally should be considered forward-looking statements. Forward-looking statements in this earnings release are based on management's current expectations and assumptions about future events that involve inherent risks and uncertainties and may concern, among other things, the Company’s expectations relating to our strategy, goals, projections, valuations and impairments, and plans regarding our financial position, liquidity, capital resources, results of operations and decisions regarding our strategic growth initiatives, market position, and product development. While the Company considers these expectations and assumptions to be reasonable, they are inherently subject to significant business, economic, competitive, regulatory, and other risks and uncertainties, most of which are difficult to predict and many of which are beyond the Company’s control. The Company cautions readers that various factors could cause the actual results of the Company to differ materially from those indicated by forward-looking statements. Accordingly, investors should not place undue reliance on forward-looking statements as a prediction of actual results. Among the factors that could cause the actual results to differ materially from those indicated in the forward-looking statements are risks and uncertainties related to: adverse economic conditions in the markets we serve, including recession, the volatility in the prices for oil and gas, tariffs, duties or trade wars, inflation, rising labor costs, project delays, and budget shortfalls, or otherwise; the disruption of government funding programs as a result of potential periodic government shutdowns; volatility in the global capital markets, including interest rate fluctuations, which could adversely affect our ability to access the capital markets on terms that are favorable to us; restrictions on our ability to draw on our credit agreement, including as a result of any future inability to comply with restrictive covenants contained therein; a decrease in freight or transit rail traffic; environmental matters and the impact of environmental regulations, including any costs associated with any remediation and monitoring of such matters; the risk of doing business in international markets, including compliance with anti-corruption and bribery laws, foreign currency fluctuations and inflation, global shipping disruptions, the imposition of increased or new tariffs, and trade restrictions or embargoes, or uncertainties relating to the imposition and enforcement of tariffs; our ability to timely effectuate our strategy, including cost reduction initiatives, and our ability to effectively integrate acquired businesses or to divest businesses, and to realize anticipated synergies and benefits; costs of and impacts associated with shareholder activism; the timeliness, cost, and availability of materials from our major suppliers, as well as the impact on our access to supplies of customer preferences as to the origin of such supplies, such as customers’ concerns about conflict minerals; labor disputes; emerging technologies, including those related to or arising from artificial intelligence, and resultant risks to our business and operations; cybersecurity risks such as data security breaches, malware, ransomware, “hacking,” and identity theft, either with respect to our systems or those of third parties on whom we rely, which could disrupt our business and may result in misuse or misappropriation of confidential or proprietary information, and could result in the disruption or damage to our systems, increased costs and losses, or an adverse effect to our reputation, business or financial condition; the continuing effectiveness of our ongoing implementation of an enterprise resource planning system; changes in current accounting estimates and their ultimate outcomes; the adequacy of internal and external sources of funds to meet financing needs, including our ability to negotiate any additional necessary amendments to our credit agreement or the terms of any new credit agreement, the Company’s ability to manage its working capital requirements and indebtedness; domestic and international taxes, including estimates that may impact taxes; domestic and foreign government regulations, including tariffs; our ability to maintain effective internal controls over financial reporting and disclosure controls and procedures; any change in policy or other change due to the results of the UK’s parliamentary elections and the U.S. presidential and congressional elections that could affect UK or US business conditions; other geopolitical conditions, including the ongoing conflicts between Russia and Ukraine, conflicts in the Middle East, and increasing tensions between China and Taiwan; a lack of, freezing of, or delay in state or federal funding for infrastructure projects; an increase in manufacturing or material costs, including volatility in steel prices, oil prices, and wage inflation; the loss of future revenues from current customers; any future global health crises, and the related social, regulatory, and economic impacts and the response thereto by the Company, our employees, our customers, and national, state, or local governments, including any governmental travel restrictions; and risks inherent in litigation and the outcome of litigation and product warranty claims. Should one or more of these risks or uncertainties materialize, or should the assumptions underlying the forward-looking statements prove incorrect, actual outcomes could vary materially from those indicated. Significant risks and uncertainties that may affect the operations, performance, and results of the Company’s business and forward-looking statements include, but are not limited to, those set forth under Item 1A, “Risk Factors,” and elsewhere in our Annual Report on Form 10-K for the year ended December 31, 2025, or as updated and/or amended by our other current or periodic filings with the Securities and Exchange Commission.

The forward-looking statements in this release are made as of the date of this release and we assume no obligation to update or revise any forward-looking statement, whether as a result of new information, future developments, or otherwise, except as required by the federal securities laws.

Marketing and Communications:

Meredith Faust 412-928-3400, and follow the prompts [email protected]

L.B. Foster Company 415 Holiday Drive Suite 100 Pittsburgh, PA 15220

L.B. Foster Company Logo

Close menu

Close menu

October 29, 2026

PDF Version

PITTSBURGH, Oct. 29, 2026 (GLOBE NEWSWIRE) -- L.B. Foster Company (Nasdaq: FSTR), a global solutions provider of products and services for the rail and infrastructure markets, today announced that its wholly-owned subsidiary CXT Incorporated ("CXT") (L.B. Foster and CXT are sometimes collectively referred to as the “Company”), has acquired the operating assets of Dulworth Enterprises, Inc. ("Dulworth"), a privately-held business headquartered in Rice, Texas, specializing in residential wastewater precast products and Aeris aerobic treatment systems. The acquisition, which was completed on October 28, 2026, is designed to accelerate the Company's growth strategy by expanding manufacturing capabilities, enhancing its product portfolio, and increasing exposure to attractive precast concrete, high-growth end markets.

Under the terms of the definitive Asset Purchase Agreement, the Company acquired substantially all the operating assets of Dulworth for approximately $52.2 million in cash, subject to customary indemnification holdbacks. Dulworth is expected to generate revenue of approximately $18 million per annum and estimated to provide an EBITDA contribution, including synergy benefits, of approximately $6.5 million to $7.5 million, after the completion of integration activities which are estimated to take 12 to 18 months.

"This acquisition represents a natural extension of our growth strategy," said John Kasel, President and Chief Executive Officer of L.B. Foster Company. "By combining our existing residential wastewater portfolio with Dulworth's manufacturing expertise and differentiated technology, we are enhancing our ability to serve customers in attractive high-growth markets. We have long recognized the value of their technology through our existing relationship and experience using their solutions, which gives us a high degree of confidence in the strategic and operational fit of this combination."

Prompts

L.B. Foster Company (ticker FSTR), listed in United States.

Company History

Date Change Detail
Nov 8, 2010 Acquired Acquired Portec Rail Products Inc (CIK 1263074). Its filings from before the deal are on its own company page, not shown here.

ETFs Holding L.B. Foster Company

ETF Weight in ETF Shares Market value As of
AVUV 0.05% 397,867 $ 16.683M Nov 16, 2026
AVSC 0.03% 20,386 $ 854.785K Nov 16, 2026
DFSV 0.03% 180,834 $ 7.799M Nov 12, 2026
DFAT 0.02% 165,521 $ 7.139M Nov 12, 2026
FESM 0.02% 24,329 $ 1.099M Jun 30, 2026
DFAS 0.01% 79,661 $ 3.436M Nov 12, 2026
DXUV 0.00% 4,681 $ 201.892K Nov 12, 2026
DFAC 0.00% 47,650 $ 2.055M Nov 12, 2026
DCOR 0.00% 20,075 $ 865.835K Nov 12, 2026
DFSU 0.00% 920 $ 39.68K Nov 12, 2026
MSSM 0.00% 298 $ 11.178K Aug 31, 2026
DFAU 0.00% 2,252 $ 97.129K Nov 12, 2026
DFUS 0.00% 1,019 $ 43.949K Nov 12, 2026
EBI 0.00% 23 $ 862.73 Aug 31, 2026
AVUS 0.00% 3,876 $ 162.521K Nov 16, 2026
AVSU 0.00% 60 $ 2,515.80 Nov 16, 2026