Author: Primis | Published: Friday, September 25, 2026 RICHMOND, Va., Sept. 25, 2026 — Primis Bank announced the launch of its redesigned website this week, introducing a modern, streamlined experience that makes it easier for customers to explore…
Author: Primis | Published: Friday, September 25, 2026

RICHMOND, Va., Sept. 25, 2026 — Primis Bank announced the launch of its redesigned website this week, introducing a modern, streamlined experience that makes it easier for customers to explore products, find helpful information and better understand what makes Primis different.
More than a new look, the redesigned PrimisBank.com represents an investment in making banking simpler and more intuitive. Clearer navigation, improved product exploration and more accessible information help customers connect more quickly with the products, services and support they need.
“Our new website is about much more than changing how Primis looks online. It’s about building a better foundation for how we serve our customers digitally,” said Ann-Stanton Gore, chief strategy officer of Primis Bank. “This is the first of several investments focused on making banking simpler, more connected and more efficient. As our customers’ expectations continue to evolve, we want the experiences we build to evolve with them and give us the flexibility to keep making banking better.”
Behind the new customer experience is an equally important investment in technology. Primis moved its website to Xperience by Kentico, providing a more scalable platform with stronger content governance and the ability to manage multiple brands and digital properties within one content management system. The new platform will allow Primis to introduce improvements more efficiently and support more connected digital experiences as the bank continues to grow.
The launch is part of Primis Bank’s broader investment in technology and experiences designed to make banking simpler for customers.
Visit PrimisBank.com to explore the new experience.
Primis Bank (Member FDIC) is a high-growth, forward-thinking bank committed to building a better banking experience for consumers, businesses, and communities. With industry-leading digital tools, a relentless focus on customer care, and a culture built around doing things the right way—not the easy way—Primis continues to invest in growth, innovation, and people.
Share on


Related Articles
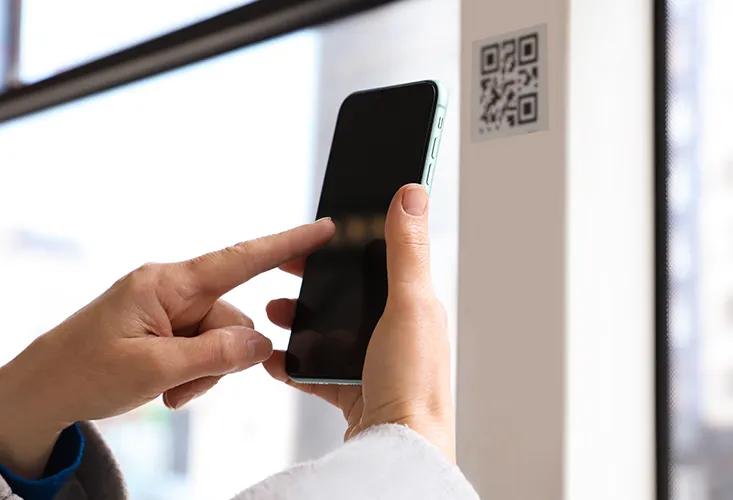
Scan With Caution: Protect Yourself From Fraudulent QR Codes
From exchanging money to marketing campaigns, QR codes have become a convenient way to access information, make payments, download apps, and more. As their popularity grows, scammers are using them to steal personal information. Cybercriminals can create fraudulent QR codes that direct users to fake websites, malicious downloads, or other scams designed to collect sensitive data. While QR codes aren’t inherently dangerous, taking a few simple precautions can help you avoid becoming a victim. Here are three smart habits to follow before you scan! Rule 1: Unlabeled QR Code? Don’t scan!If you come across a standalone QR code with little or no context, it could be a red flag. While it might lead to a funny video or cool website, it could also direct you to a fraudulent site designed to collect your personal or financial information.Even QR codes that go to legitimate-looking websites can be dangerous, so before scanning, make sure you understand who created the QR code, where it came from, and what it’s intended to do.Rule 2: Always verify the sourceAlways verify the person or organization behind the QR code before scanning. Whether you’re visiting a vendor booth, attending an event, or seeing a QR code posted in a public space, take a moment to verify its source before pulling out your device. Consider visiting the organization’s official website directly first if you’re unsure. When in doubt, don’t scan it! It is always better to find the linked information through other means than to have your personal information stolen.Rule 3: Make sure you're scanning the original codeA common QR code scam involves placing a fake QR code sticker over a legitimate one. This tactic, known as sticker tampering, can redirect users to fraudulent websites without them realizing it. Try scratching around the QR code or examining the poster closely before scanning. Does it appear altered, damaged, or placed over another code? If something looks off, avoid scanning and look for other ways to access the information. Don’t let a scan cost youBy staying aware of common warning signs, verifying sources, and checking for signs of tampering, you can help protect your personal information and reduce your risk of falling victim to a QR code scam.Remember, a few extra seconds now could save you a lot of hassle later on.
Read Article

Your Statement Doesn't Need a Stamp
Get your bank statements sooner, keep them organized, and access them securely with free e-statements.There was a time when checking the mailbox was the only way to receive your bank statement. Today, there’s a faster, simpler way.E-statements give you convenient digital access to your account information through online and mobile banking. Whether you’re reviewing monthly activity, preparing for tax season, or looking for a past transaction, your online bank statements are right at your fingertips.Get Your Statements SoonerWhy wait for the mail?E-statements are available electronically as soon as they’re ready, so you can review your account activity without waiting for a paper statement to arrive.Help Keep Your Information SecureBank statements contain sensitive personal and financial information. Paper statements can be lost, misplaced, or left sitting in a mailbox.E-statements help reduce those risks by giving you secure digital access to important account information through online and mobile banking.Find What You Need FasterNeed last month’s statement? Looking for a transaction from several months ago?Instead of sorting through stacks of paper, you can keep your statements organized in one convenient place and quickly access previous records when you need them.Cut the ClutterLet’s be honest. You already have enough paper to keep up with.E-statements help reduce unnecessary paperwork while keeping your financial records easy to access. No filing cabinets, crowded folders, or stacks of unopened envelopes required.Bank on Your ScheduleLife doesn’t always happen during business hours.Whether you’re reviewing your finances early in the morning, during your lunch break, or late at night, e-statements are available when it’s convenient for you. Access your statements wherever you bank, whenever you need them.Make the Switch to E-StatementsEnjoy faster delivery, convenient access, and less paper clutter. Log in to online or mobile banking to review your statement delivery preferences and start taking advantage of free e-statements.
Read Article

Keeping Your Mortgage Cybersafe
Imagine waking up to hear that Graceland, home of the legendary Elvis Presley, would go up for auction. In 2024, a fake company tried to auction the home, claiming descendants failed to pay off a 3.8 million dollar mortgage loan using Graceland as collateral. Using stolen notary signatures, a fabricated company, and a fake Deed of Trust, Lisa Findley unsuccessfully attempted to auction off the beloved historical site. While this fraud was prevented, many similar and costly mortgage frauds occur using identity theft. Good news – we have some tips you can use to protect your home! Understanding Identity Theft Mortgage FraudThis type of fraud can show up in many ways—the common denominator is using stolen personal information to impersonate the victim. Thefts will use this information to take out mortgages and home equity lines (HELOC) under someone’s name, refinance their home, and drain their equity. Identity theft mortgage fraud can have massive consequences, from destroying a person’s credit score to home foreclosure. The good news is, with the right precautions, this type of fraud is preventable. Here are some tips you can use to protect your home. Tip 1: Check your credit report and mortgage statement regularly. You are entitled to a free copy of your credit report for each of the three major credit bureaus (Equifax, Experian, and TransUnion) each year. Negative changes in your credit score, and discrepancies in your mortgage and lending statements, can indicate fraud, so leverage this resource. Through AnnualCreditReport.com, free weekly credit reports through the three credit reporting bureaus are now available. If you find fraud, contact your mortgage lender, freeze your credit reports, and file a report with the FBI’s Internet Crime Complaint Center at www.ic3.gov. Tip 2: Use a password manager instead of weak passwords. Creating and remembering strong and unique passwords across a multitude of accounts is difficult, often leading to recycled passwords. This can leave your account susceptible to being hacked. Instead of recycling or using weak passwords, use a reputable password manager to keep track of your passwords. Tip 3: Always stay informed.Identity theft mortgage fraud schemes mutate and change often, so make sure you are up to date with the latest information. Check communications from your mortgage lender and real estate agent to learn the impact of potential threats. For more resources on identity theft and mortgage fraud prevention, visit IdentityTheft.gov and ReportFraud.ftc.gov.
Read Article
News & Press
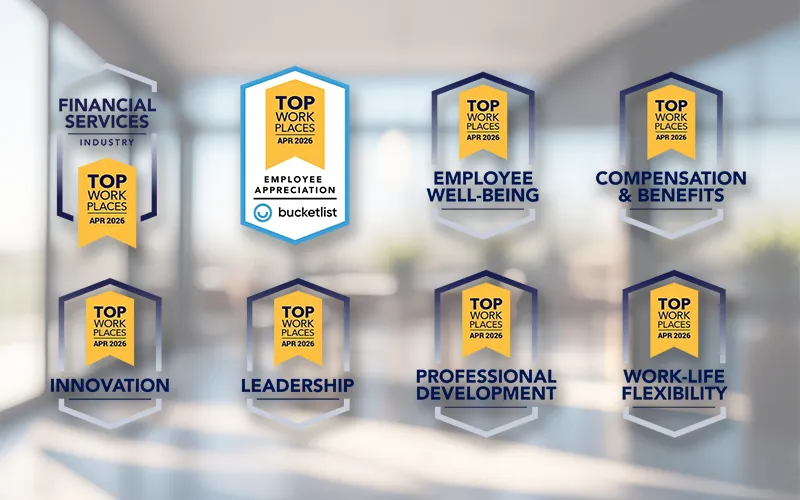
Primis Bank Earns Eight 2026 Top Workplaces Awards
National Recognition Reflects the Bank’s Commitment to Building a High-Performing Culture Where Teammates ThriveRICHMOND, Va. — Primis Bank is proud to share that it has earned eight 2026 Top Workplaces awards, through a nationally recognized workplace excellence program based entirely on teammate feedback.Primis received Top Workplaces recognition in the following categories:Culture Excellence AwardsTop Workplaces for Appreciation Top Workplaces for Compensation & Benefits Top Workplaces for Employee Well-Being Top Workplaces for InnovationTop Workplaces for Leadership Top Workplaces for Professional Development Top Workplaces for Work-Life FlexibilityIndustry AwardsFinancial Services Top Workplaces The results were driven by exceptionally strong teammate engagement, with 56% participation in the survey and extremely positive feedback across key areas.“These recognitions mean a great deal because they came directly from our teammates,” said Ann-Stanton Gore, chief strategy officer at Primis. “As we continue to grow, we’ve been intentional about protecting the culture that makes Primis special. We believe people do their best work when they feel appreciated, supported, challenged and connected to a larger mission.”At Primis, culture is deeply tied to strategy. The company has made deliberate investments in leadership development, teammate recognition, professional growth, flexibility and well-being to create an environment where people can thrive personally and professionally.The recognition also reinforces Primis’ broader commitment to building a modern banking company that feels different from traditional financial institutions. One where leadership is accessible, teammates feel empowered and strong culture fuels strong performance.“Reputation and culture are critical pillars of our strategy,” Gore added. “These awards validate the kind of company we’re working hard to build. One where great people want to stay, grow and make an impact.”As Primis continues to expand nationally, the company remains focused on strengthening the foundation behind its momentum: its people.###
Read Article
YOU ARE NOW LEAVING PRIMISBANK.COM
We hope you'll come back again soon.
Primis links to other websites for your convenience. However, Primis has no control over the content or quality of the site you are visiting, and the site may not have the same privacy and security practices that we do. We encourage you to read the privacy and security policies of all sites you visit.
Continue
Cancel
Join the First Bank To Get It Right
Open an Account


FDIC-Insured - Backed by the full faith and credit of the U.S. Government
©2026 Primis Financial Corp. All Rights Reserved
Support
Security, Privacy & Legal
About Primis
DOWNLOAD THE PRIMIS APP


FDIC-Insured - Backed by the full faith and credit of the U.S. Government
©2026 Primis Financial Corp. All Rights Reserved
Our agents are not available at the moment.
Let's Chat!