On November 17, 2026 (the “Signing Date”), Axiom Solutions International, Inc. (“Axiom”), currently a wholly owned subsidiary of Flex Ltd. (the “Company” or “Flex”), entered into a Credit Agreement (the “Credit Agreement”), by and among Axiom and certain subsidiaries of Axiom from time to time party thereto, as borrowers and guarantors, the lenders and L/C issuers party thereto, and Citibank, N.A., as administrative agent. The Credit Agreement provides for (a) a senior secured revolving credit facility in an aggregate committed amount of $1.265 billion (the “Revolving Facility”), which includes a $200 million sublimit for letters of credit and a $250 million sublimit for swing line loans, (b) a senior secured term loan facility in an aggregate committed amount of $1.65 billion (the “3-Year Term Loan”) and (c) a senior secured term loan facility in an aggregate committed amount of $1.65 billion (the “5-Year Term Loan,” and together with the 3-Year Term Loan, the “Term Loans,” and the Term Loans together with the Revolving Facility, the “Credit Facilities”). The Credit Facilities were not funded on the Signing Date.
|
Flex Ltd. is a global technology, supply chain, and advanced manufacturing solutions provider that designs, builds, delivers, and manages products for diverse industries. The company operates through three segments: Integrated Technology Solutions (ITS), serving communications, high-speed networking, enterprise, satellite, and lifestyle markets; Regulated Manufacturing Solutions (RMS), focused on industrial automation, automotive electronics, and healthcare medical devices; and Cloud and Power Infrastructure (CPI), providing integrated compute systems, power, and cooling solutions for data centers and AI infrastructure. Flex partners with customers across data center, healthcare, industrial, automotive, communications, and lifestyle sectors, leveraging capabilities in design and engineering, supply chain management, and factory automation. In January 2024, the company completed the spin-off of Nextracker Inc. to shareholders. In May 2026, Flex announced its intention to separate into two independent public companies, with the CPI segment spinning off from the ITS and RMS businesses, a transaction targeted for completion in the first quarter of 2027. Summarised from the company's own disclosures, fiscal year ended May 2026 |
Industry Specialty Business Services | Homepage flex.com |
| Sector Industrials | IR page investors.flex.com/overview/default.aspx | |
|
Tags
electronics manufacturing services, supply chain management, data center infrastructure, medical device manufacturing, automotive electronics, industrial automation, communications equipment, power systems, cooling solutions, product design and engineering, Nextracker
|
Press page flex.com/newsroom |
Metrics
| Valuation | |
|---|---|
| Market cap | $ 40.637B |
| Market cap (USD) | $ 40.637B |
| P/E | 39.71 |
| PEG | 11.25 |
| P/BV | 7.00 |
| P/S | 1.31 |
| P/OCF | 25.24 |
| P/FCF | 51.90 |
| Dividend yield | — |
| Turnover / mcap | — |
| Returns | |
|---|---|
| ROE | 17.3% |
| ROI | 9.9% |
| ROIC | 11.8% |
| Profit margin | 3.2% |
| Growth | |
|---|---|
| Revenue growing | Yes |
| Profits growing | No |
| Revenue up 3y | No |
| Revenue up 5y | No |
| Earnings growth 3y (net profit CAGR) | 3.5% |
| Quality | |
|---|---|
| Profitable | Yes |
| Margin expanding | Yes |
| Buying back stock | Yes |
| Diluting (TTM) | No |
| Debt/Equity | 89.8% |
| Podcast bulls (TTM) | Sign up |
| Podcast bears (TTM) | Sign up |
| Podcast sentiment (TTM) | Sign up |
| Podcast sentiment % (TTM) | Sign up |
| News sentiment (TTM) | 78 |
| Quality score | 5.6% |
| Insiders | |
|---|---|
| Buys, 1w | Sign up |
| Buys, 1m | Sign up |
| Buys, 1y | Sign up |
| Sells, 1w | Sign up |
| Sells, 1m | Sign up |
| Sells, 1y | Sign up |
Sign up to see this company's insider trades
| Figure | FY 2026 | FY 2025 | FY 2024 | FY 2023 | FY 2022 | FY 2021 | FY 2020 | FY 2019 | FY 2018 | FY 2017 | FY 2016 | FY 2015 | FY 2014 | FY 2013 | FY 2012 | FY 2011 | FY 2010 | FY 2009 | FY 2008 | FY 2007 | FY 2006 | FY 2005 | FY 2004 | FY 2003 | FY 2002 | FY 2001 | FY 2000 |
|---|---|---|---|---|---|---|---|---|---|---|---|---|---|---|---|---|---|---|---|---|---|---|---|---|---|---|---|
| Revenue | 27.914B | 25.813B | 26.415B | 30.346B | 26.041B | 24.124B | 24.21B | 26.211B | 25.441B | 23.863B | 24.419B | 26.148B | 26.109B | 23.569B | 29.388B | 28.68B | 24.111B | 30.949B | 27.558B | 18.854B | 15.288B | 15.908B | 14.53B | 13.379B | 13.105B | 12.11B | 4.307B |
| Net profit | 880M | 838M | 1.006B | 793M | 936M | 613M | 87.579M | 93.399M | 428.534M | 319.564M | 444.081M | 596.529M | 365.214M | 277.051M | 488.765M | 596.219M | 18.594M | -6.086B | -639.37M | 508.638M | 141.162M | 339.871M | -352.378M | -83.453M | -153.748M | -446.019M | 120.915M |
| Free cash flow | 1.052B | 1.067B | 796M | 315M | 581M | -207M | -1.995B | -3.697B | 191.601M | 624.798M | 625.811M | 446.621M | 606.817M | 626.437M | 367.077M | — | — | — | — | — | — | — | — | — | — | — | -317.85M |
| Figure | FY 2026 | FY 2025 | FY 2024 | FY 2023 | FY 2022 | FY 2021 | FY 2020 | FY 2019 | FY 2018 | FY 2017 | FY 2016 | FY 2015 | FY 2014 | FY 2013 | FY 2012 | FY 2011 | FY 2010 | FY 2009 | FY 2008 | FY 2007 | FY 2006 | FY 2005 | FY 2004 | FY 2003 | FY 2002 | FY 2001 | FY 2000 |
|---|---|---|---|---|---|---|---|---|---|---|---|---|---|---|---|---|---|---|---|---|---|---|---|---|---|---|---|
| Share price | 65.46 | 33.08 | 28.61 | 23.01 | 18.55 | 18.31 | 8.38 | 10 | 16.33 | 16.8 | 12.06 | 12.68 | 9.24 | 6.76 | 7.22 | 7.47 | 7.88 | 3.16 | 9.85 | 11.49 | — | — | — | — | — | — | — |
| Price performance 12m | 0.98 | 0.16 | 0.24 | 0.24 | 0.01 | 1.19 | -0.16 | -0.39 | -0.03 | 0.39 | -0.05 | 0.37 | 0.37 | -0.06 | -0.03 | -0.05 | 1.49 | -0.68 | -0.14 | — | — | — | — | — | — | — | — |
Filed figures
Lines the statements and their notes report beside the headline figures, read from the filings' XBRL as filed (no restatement applied), with figures computed from one filing's own lines. Cash-flow lines carry their cash direction: an outflow is negative. Each period links to its filing; a figure's period, report date and tag are in its tooltip.
| Figure | Mar 2017 | Mar 2018 | Mar 2019 | Mar 2020 | Mar 2021 | Mar 2022 | Mar 2023 | Mar 2024 | Mar 2025 | Mar 2026 |
|---|---|---|---|---|---|---|---|---|---|---|
| Balance sheet detail | ||||||||||
| Trade receivables (USD) | 2.19B | 2.52B | 2.61B | 2.44B | 4.11B | 3.37B | 3.74B | 3.03B | 3.67B | 4.68B |
| ↳ YoY growth | +7.2% | +14.8% | +3.8% | -6.8% | +68.6% | -17.9% | +10.9% | -18.9% | +21.0% | +27.5% |
| ↳ 5y CAGR | -3.4% | +3.6% | -0.6% | +0.8% | +15.0% | +9.0% | +8.2% | +3.0% | +8.5% | +2.6% |
| Borrowings, current (USD) | 61.5M | 43M | 633M | 149M | 268M | 949M | 150M | 0.00 | 1.21B | 0.00 |
| Borrowings, non-current (USD) | 2.89B | 2.9B | 2.42B | 2.69B | 3.52B | 3.25B | 3.69B | 3.26B | 2.48B | 3.75B |
| Lease liabilities (USD) | — | — | 0.00 | 643M | 562M | 551M | 632M | 626M | 591M | 714M |
| Cash and deposits (USD) | 1.83B | 1.47B | 1.7B | 1.92B | 2.64B | 2.96B | 3.29B | 2.47B | 2.29B | 2.39B |
| Intangible assets (USD) | 362M | 424M | 331M | 262M | 213M | 411M | 316M | 245M | 343M | 283M |
| Right-of-use assets (USD) | — | — | 0.00 | 605M | 642M | 637M | 608M | 601M | 562M | 659M |
| Net debt (borrowings + leases - cash) (USD) | 1.12B | 1.47B | 1.36B | 1.56B | 1.71B | 1.78B | 1.18B | 1.41B | 1.99B | 2.08B |
| Cash flow detail | ||||||||||
| Operating cash flow (USD) | 1.15B | 754M | -2.97B | -1.53B | 144M | 1.02B | 950M | 1.33B | 1.51B | 1.69B |
| Purchases of property, plant and equipment (USD) | -525M | -562M | -726M | -462M | -351M | -443M | -635M | -530M | -438M | -633M |
| Change in receivables (cash effect) (USD) | -164M | -297M | -3.63B | -2.13B | -1.66B | 624M | -388M | 380M | -601M | -979M |
| Change in inventories (cash effect) (USD) | 85M | -354M | -360M | -66.5M | -96M | -2.66B | -974M | 1.11B | 1.18B | -742M |
| Change in payables (cash effect) (USD) | 269M | 623M | 68.1M | -14.6M | 103M | 969M | -341M | -986M | 630M | 2.86B |
| Share buybacks (cash effect) (USD) | -350M | -180M | -189M | -260M | -183M | -686M | -337M | -1.3B | -1.26B | -944M |
| Interest paid (cash effect) (USD) | -127M | -153M | -190M | -172M | -147M | -169M | -227M | -226M | -214M | -212M |
| Income taxes paid (cash effect) (USD) | -86.7M | -91.8M | -134M | -98.9M | -105M | -122M | -124M | -243M | -184M | -323M |
| Share-based compensation (USD) | 77.3M | 81.3M | 76M | 71.5M | 79M | 91M | 133M | 152M | 125M | 142M |
| Operating cash flow before change in receivables (USD) | 1.31B | 1.05B | 657M | 593M | 1.8B | 400M | 1.34B | 946M | 2.11B | 2.66B |
| Free cash flow (OCF - PPE - intangibles) (USD) | 625M | 192M | -3.7B | -2B | -207M | 581M | 315M | 796M | 1.07B | 1.05B |
| Income detail | ||||||||||
| Research and development expense (USD) | 65.6M | 78.2M | — | — | — | — | — | — | — | — |
| ↳ 5y CAGR | -3.6% | |||||||||
| Total comprehensive income (USD) | 327M | 471M | 28.1M | 24.1M | 709M | 877M | 1.02B | 1.24B | 809M | 937M |
| Comprehensive income to owners (USD) | 327M | 471M | 28.1M | 24.1M | 709M | 873M | 781M | 1.01B | 809M | 937M |
| Provision for credit losses (USD) | -184,000 | 8.23M | 42M | 23.7M | 5M | -3M | 3M | 9M | — | — |
| Credit cost ratio (credit losses / average receivables) (%) | 0.0% | 0.3% | 1.6% | 0.9% | 0.2% | 0.1% | 0.1% | 0.3% | — | — |
| Reported | May 16, 2017 | May 28, 2020 | May 28, 2020 | May 28, 2020 | May 19, 2021 | May 20, 2022 | May 19, 2023 | May 17, 2024 | May 21, 2025 | May 20, 2026 |
Sign up to see institutional holdings
Sign UpPodcast Mentions
Sign up to see podcast mentions and sentiment
Sign UpMaterial events reported to the SEC on Form 8-K or 6-K, newest first. The link opens the filing itself on EDGAR. Press releases from the company's own website, newest first.
On November 10, 2026, Flex Ltd. (the “Company”) intends to present information about the Company and Axiom Solutions International, Inc. (“Axiom”), the planned independent, publicly-traded company comprising the Company’s Cloud and Power Infrastructure segment following the expected spin-off, at an Innovation Day being held at the Company’s headquarters in Austin, Texas. The presentation will be held in-person for invited institutional investors and financial analysts. The live webcasts and accompanying presentation materials will be available on the Company’s Investor Relations website at investors.flex.com. A replay will be available on the Company’s Investor Relations website following the conclusion of the event. The Company’s and Axiom’s presentation materials are attached hereto as Exhibits 99.1 and 99.2, respectively.
November 06, 2026
AUSTIN, Texas, Nov. 6, 2026 /PRNewswire/ -- Flex (NASDAQ: FLEX) today announced that it will host its 2026 Innovation Day on Tuesday, November 10, 2026, at the company's headquarters in Austin, Texas.
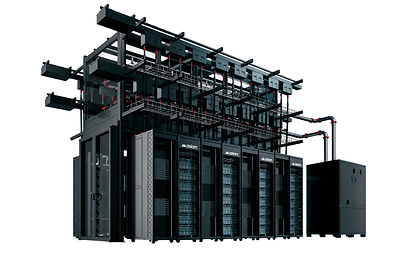
The event will feature presentations from members of the senior leadership teams of Flex and Axiom, the planned independent, publicly-traded company comprising Flex's Cloud and Power Infrastructure segment following the expected spin-off. Presentations will focus on each company's strategy, market opportunities, and financial priorities.
Innovation Day will be held in-person for invited institutional investors and financial analysts. The presentation portions for both companies will also be available to the public through separate webcasts, beginning at:
Flex: 8:00 AM CT / 9:00 AM ET
Axiom: 12:00 PM CT / 1:00 PM ET
The live webcasts and accompanying presentation materials will be available on the Flex Investor Relations website at investors.flex.com . A replay will be available on the Investor Relations website following the conclusion of the event.
About Flex
Flex (Reg. No. 199002645H) is the manufacturing partner of choice that helps leading brands design, build and manage products that improve the world. With a global footprint spanning 30 countries, Flex delivers advanced manufacturing and supply chain solutions, innovative products and technology, and lifecycle services that support customers from concept to scale. In the AI era, Flex is helping customers accelerate data center deployment by solving power, heat and scale challenges through cutting-edge power and cooling technology and scalable IT infrastructure solutions.
Media, Investors & Analysts
Michelle Simmons
Senior Vice President, Global Investor Relations and Public Relations
(669) 242-6332
[email protected]
 View original content to download multimedia:https://www.prnewswire.com/news-releases/flex-to-host-innovation-day-on-november-10-2026-302932281.html
SOURCE Flex
Email Alert Sign Up Confirmation
Quick Links
Investor Email Alerts
To receive notifications via email, enter your email address and select at least one subscription below. After submitting your information, you will receive an email. You must click the link in the email to activate your subscription. You can sign up for additional subscriptions at any time.
* Required
Email Address *
Investor Alert OptionsInvestor Alert Options *
| News |
| SEC Filings |
| End of Day Stock Quote |
| Events & Presentations |
Submit Sign Up
Stay connected
© 2026 FLEX LTD. Flextronics International, LTD. All rights reserved.
 View original content to download multimedia:
 View original content to download multimedia:
 View original content to download multimedia:

 View original content to download multimedia:

 View original content to download multimedia:
 View original content to download multimedia:
 View original content to download multimedia:
Prompts
Click prompts to add them under the company line, click again to take one out, then copy the result into your AI chat. Shared by Asian Century Stocks and Uncovered Thai Stocks. Thank you.
Company History
Name and ticker changes, and re-registrations under a new regulatory id. When a ticker stopped being used is not recorded, so former tickers are undated.
| Date | Change | Detail |
|---|---|---|
| Oct 18, 2016 | Renamed | FLEXTRONICS INTERNATIONAL LTD. → FLEX LTD. |
ETFs Holding Flex Ltd.
Exchange-traded funds whose newest published daily portfolio holds one of the company's listings, largest weight first.
| ETF | Weight in ETF | Shares | Market value | As of |
|---|---|---|---|---|
| BASV | 4.68% | 117,863 | $ 19.102M | Jun 30, 2026 |
| LCLG | 4.25% | 40,244 | $ 4.578M | Jul 31, 2026 |
| CNAV | 2.78% | 10,665 | $ 1.728M | Jun 30, 2026 |
| RULE | 2.68% | 2,837 | $ 459.793K | Jun 30, 2026 |
| SEIV | 2.50% | 225,764 | $ 36.59M | Jun 30, 2026 |
| EPMV | 2.30% | 1,436 | $ 107.671K | Nov 13, 2026 |
| FRTY | 1.79% | 16,965 | $ 2.75M | Jun 30, 2026 |
| CLCV | 1.66% | 2,503 | $ 284.716K | Jul 31, 2026 |
| AGIX | 1.59% | 78,988 | $ 12.802M | Jun 30, 2026 |
| TAX | 1.56% | 3,628 | $ 396.359K | Aug 31, 2026 |
| LOPP | 1.55% | 1,558 | $ 252.505K | Jun 30, 2026 |
| BLCR | 1.37% | 1,769,108 | $ 132.329M | Nov 16, 2026 |
| HFGO | 1.32% | 28,198 | $ 0.00 | Nov 18, 2026 |
| BAI | 1.23% | 1,860,239 | $ 139.146M | Nov 16, 2026 |
| OASC | 1.22% | 10,503 | $ 1.147M | Aug 31, 2026 |
| WUGI | 1.00% | 2,225 | $ 360.606K | Jun 30, 2026 |
| WCEO | 0.93% | 814 | $ 92.593K | Jul 31, 2026 |
| EPSV | 0.90% | 719 | $ 53.911K | Nov 13, 2026 |
| TEK | 0.89% | 4,426 | $ 331.065K | Nov 16, 2026 |
| BUSA | 0.84% | 15,548 | $ 2.52M | Jun 30, 2026 |
| AVMV | 0.84% | 93,472 | $ 6.992M | Nov 16, 2026 |
| ESLV | 0.77% | 964 | $ 109.655K | Jul 31, 2026 |
| ACGR | 0.72% | 695 | $ 75.929K | Aug 31, 2026 |
| ESUM | 0.65% | 10,452 | $ 1.189M | Jul 31, 2026 |
| CLSE | 0.58% | 47,742 | $ 5.216M | Aug 31, 2026 |
| CGMM | 0.51% | 247,438 | $ 18.508M | Nov 16, 2026 |
| ESLG | 0.46% | 947 | $ 107.721K | Jul 31, 2026 |
| ACVU | 0.44% | 16,822 | $ 0.00 | Nov 18, 2026 |
| AVMC | 0.37% | 26,956 | $ 2.016M | Nov 16, 2026 |
| TMSL | 0.31% | 51,772 | $ 8.391M | Jun 30, 2026 |
| AVLV | 0.25% | 773,729 | $ 57.875M | Nov 16, 2026 |
| HBTA | 0.20% | 4,604 | $ 502.987K | Aug 31, 2026 |
| INFO | 0.20% | 20,089 | $ 1.506M | Nov 13, 2026 |
| VFMO | 0.20% | 34,912 | $ 3.814M | Aug 31, 2026 |
| AVSU | 0.15% | 9,460 | $ 707.608K | Nov 16, 2026 |
| AVUS | 0.13% | 256,495 | $ 19.186M | Nov 16, 2026 |
| AVLC | 0.13% | 27,660 | $ 2.069M | Nov 16, 2026 |
| BALQ | 0.13% | 744 | $ 55.651K | Nov 16, 2026 |
| ENHU | 0.11% | 136 | $ 10.173K | Nov 16, 2026 |
| LCTU | 0.11% | 17,005 | $ 1.272M | Nov 16, 2026 |
| IQSZ | 0.09% | 1,364 | $ 155.155K | Jul 31, 2026 |
| MCDS | 0.06% | 60 | $ 4,385.40 | Nov 17, 2026 |
| NTSD | 0.06% | 124 | $ 20.097K | Jun 30, 2026 |
| HCMT | 0.05% | 2,558 | $ 290.973K | Jul 31, 2026 |
| IETC | 0.05% | 4,285 | $ 320.518K | Nov 16, 2026 |
| INRO | 0.05% | 4,194 | $ 313.711K | Nov 16, 2026 |
| EBI | 0.05% | 2,857 | $ 312.127K | Aug 31, 2026 |
| VSLU | 0.04% | 1,350 | $ 218.795K | Jun 30, 2026 |
| MSLC | 0.04% | 14,308 | $ 1.563M | Aug 31, 2026 |
| NTSX | 0.04% | 3,102 | $ 502.741K | Jun 30, 2026 |
| GDE | 0.04% | 1,603 | $ 175.128K | Aug 31, 2026 |
| MSSM | 0.04% | 2,309 | $ 252.258K | Aug 31, 2026 |
| IALT short | -0.02% | -24,339 | $ -1.821M | Nov 16, 2026 |
| APUE | 0.02% | 3,676 | $ 401.603K | Aug 31, 2026 |
| CSHP | 0.01% | 661 | $ 49.443K | Nov 16, 2026 |
| THRO | 0.01% | 16,253 | $ 1.216M | Nov 16, 2026 |
| ESSC | 0.01% | 28 | $ 3,185.00 | Jul 31, 2026 |
| CORO | 0.00% | 233 | $ 17.425K | Nov 16, 2026 |