March 4, 2026 PDF Version 2025 Results Mark a Year of Strong Momentum Fueled by Strategic Transformation, Cost Discipline Expansion Into Targeted Customer Cohorts Drove Enhanced Profitability, Positioning Company for Sustained Growth Provides 2026…
March 4, 2026
PDF Version
2025 Results Mark a Year of Strong Momentum Fueled by Strategic Transformation, Cost Discipline
Expansion Into Targeted Customer Cohorts Drove Enhanced Profitability, Positioning Company for Sustained Growth
Provides 2026 Guidance
Fourth quarter 2025 highlights compared to fourth quarter 2024:*
-
Net revenue from continuing operations of $503.4 million, increased 15.1%
-
Comparable store sales growth of 6.6% and Adjusted Comparable Store Sales Growth of 4.8%, represented 12 consecutive quarters of positive growth
-
Net income from continuing operations of $3.3 million, Diluted EPS from continuing operations of $0.04, with Income (loss) from continuing operations margin improving to 0.7% from (6.7)%
-
Adjusted Operating Income from continuing operations increased to $17.6 million from $3.2 million, with Adjusted Operating Margin improving to 3.5% from 0.7%
-
Adjusted Diluted EPS from continuing operations of $0.15 compared with $(0.04)
Fiscal 2025 highlights compared to fiscal year 2024:*
-
Net revenue from continuing operations of $1,987.5 million, an increase of 9.0%
-
Comparable store sales growth of 5.9% and Adjusted Comparable Store Sales Growth of 6.0%
-
Net income from continuing operations of $29.6 million and Diluted EPS from continuing operations of $0.37, with Income (loss) from continuing operations margin improving to 1.5% from (1.5)%
-
Adjusted Operating Income from continuing operations of $102.5 million compared with $65.5 million in fiscal year 2024, with Adjusted Operating Margin improving to 5.2% from 3.6%
-
Adjusted Diluted EPS from continuing operations increased to $0.80 compared with $0.52 in fiscal year 2024
DULUTH, Ga.--(BUSINESS WIRE)--Mar. 4, 2026-- National Vision Holdings, Inc. (NASDAQ: EYE) (“National Vision” or the “Company”) today reported its financial results for the fourth quarter and fiscal year ended January 3, 2026, and is providing its outlook for fiscal 2026.
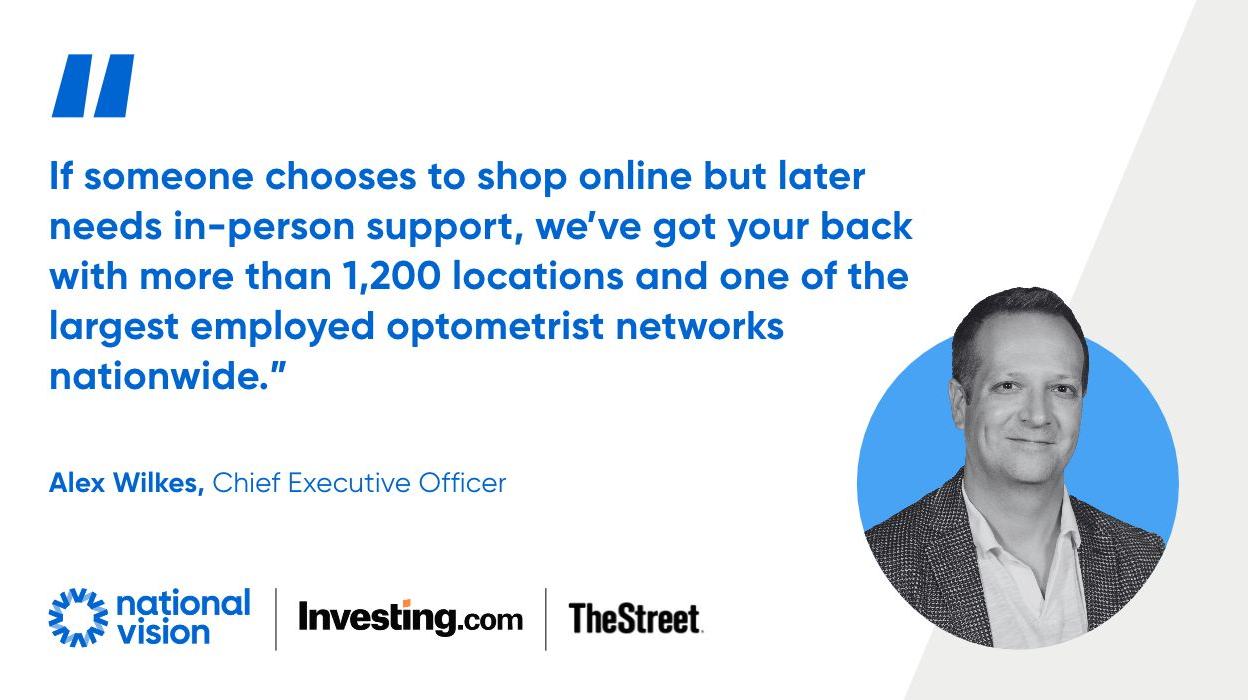
Alex Wilkes, National Vision’s CEO, said, “2025 was a remarkable year for National Vision – one in which we embarked on a bold reinvention of our company and executed our plan with discipline and precision, achieving results that surpassed our own expectations. Our strong fourth‑quarter performance reflects the meaningful progress we are making across the business. Importantly, this year we saw strong traffic gains from our most profitable target customers, including those who use managed vision care insurance, progressive lens wearers and those who bring in outside prescriptions. We are elevating our product assortment, enhancing the patient and customer experience, modernizing marketing, and expanding with a higher value customer, while remaining committed to our position as a value leader. Operating margin expansion has been a clear priority for this team, and we’re delivering on that commitment. This progress reflects our intentional management of our customer mix, a disciplined approach on cost management, along with the thoughtful investments we’ve made to strengthen the long‑term health of the business.”
Mr. Wilkes continued, “As we head into the new year, I’m incredibly confident in our trajectory, which reflects the aspirations we shared at our investor day. We have the right ambition, the right strategy, and the right team to continue generating sustained value for our shareholders.”
*Note: National Vision's results for the fourth quarter and full fiscal year ended January 3, 2026 ("fiscal 2025"), contain an additional, non-comparable week, or the "53rd week", when compared to the fourth quarter and full year results for the respective 13- and 52- week periods ended December 28, 2024. The 53rd week added $35.6 million to net revenue, approximately $0.03 to diluted EPS, $2.4 million to Net Income, and $3.5 million to Adjusted Operating Income for the quarter and the year. The 53rd week is not included in comparable store sales growth or Adjusted Comparable Store Sales Growth for the quarter or the year.
This release includes certain Non-GAAP Financial Measures that are not recognized under generally accepted accounting principles (“GAAP”). Please see “Non-GAAP Financial Measures” and “Reconciliation of Non-GAAP to GAAP Financial Measures” below for more information.
Results for all periods presented are reported on a continuing operations basis and reflect the results of our former Legacy segment and the substantial majority of AC Lens operations as discontinued operations. Unless otherwise noted, all comparisons are to the prior year period.
Fourth Quarter 2025 Summary compared to Fourth Quarter 2024
-
Net revenue increased 15.1% to $503.4 million, driven by the 53rd week, Adjusted Comparable Store Sales Growth, new store sales and partially offset by closed stores and a negative (0.8)% impact from the timing of unearned revenue.
-
Comparable store sales growth was 6.6% and Adjusted Comparable Store Sales Growth was 4.8%, both reflecting a higher average ticket and continued strength in the managed care cohort, partially offset by self-pay customer traffic.
-
The Company opened 12 new stores and closed four America’s Best stores ending the quarter with 1,250 stores. Overall, store count grew 0.8%.
-
Costs applicable to revenue increased 13.9% to $210.7 million. As a percentage of net revenue, costs applicable to revenue decreased 40 basis points to 41.9%, primarily due to the successful execution of pricing and product mix initiatives, partially offset by a slight increase in optometrist-related costs.
-
Selling, general and administrative expenses (SG&A) increased 12.1% to $261.2 million. As a percentage of net revenue, SG&A decreased 140 basis points to 51.9%, primarily driven by operating leverage on lower payroll and expenses and fees, and advertising, partially offset by higher variable incentive compensation expenses related to revenue and profitability growth and higher health care expenses. Adjusted SG&A increased 11.2% to $251.9 million, a decrease of 180 basis points.
-
Income (loss) from continuing operations, net of tax, increased to $3.3 million compared to $(29.4) million in the prior-year period. Income (loss) from continuing operations margin improved to 0.7% from (6.7)%.
-
Diluted earnings per share (EPS) from continuing operations increased to $0.04, compared to $(0.37). Adjusted Diluted EPS increased to $0.15 from $(0.04). The net change in margin on unearned revenue negatively impacted both Diluted EPS and Adjusted Diluted EPS by $(0.02).
-
Adjusted Operating Income increased 444.8% to $17.6 million. Adjusted Operating Margin improved to 3.5% from 0.7%. The net change in margin on unearned revenue negatively impacted income (loss) from continuing operations, by $(1.6) million and Adjusted Operating Income by $(2.1) million.
Fiscal 2025 Summary compared to Fiscal 2024
-
Net revenue increased 9.0% to $1,987.5 million driven by Adjusted Comparable Store Sales Growth, growth from new store sales, and the 53rd week, partially offset by the effect of closed stores and includes a negative (0.6)% impact from the timing of unearned revenue.
-
Comparable store sales growth was 5.9% and Adjusted Comparable Store Sales Growth was 6.0%, primarily due to higher average ticket and continued strength in the managed care cohort, partially offset by a slight decrease in self-pay customer traffic.
-
The Company opened 33 new stores, closed 12 America’s Best stores and closed 11 Fred Meyer stores, ending the period with 1,250 stores. Overall, store count grew 0.8%.
-
Costs applicable to revenue increased 7.3% to $819.5 million. As a percentage of net revenue, costs applicable to revenue decreased 70 basis points to 41.2%, primarily due to successful execution of pricing and product mix initiatives, partially offset by a decrease in contact lens product margin.
-
SG&A increased 8.3% to $1,016.3 million. As a percentage of net revenue, SG&A decreased 40 basis points to 51.1% driven by operating leverage on lower expenses and fees, partially offset by higher variable incentive compensation expenses related to revenue and profitability growth and higher health care expenses. Adjusted SG&A increased 7.9% to $975.3 million and decreased 50 basis points to 49.1% of net revenue.
-
Income (loss) from continuing operations increased to $29.6 million compared to $(27.2) million in the prior year period. Income (loss) from continuing operations margin increased to 1.5% compared to (1.5)%.
-
Diluted EPS from continuing operations increased to $0.37 compared to $(0.35). Adjusted Diluted EPS increased to $0.80 compared to $0.52. The net change in margin on unearned revenue negatively impacted both Diluted EPS and Adjusted Diluted EPS by $(0.08).
-
Adjusted Operating Income increased 56.5% to $102.5 million. Adjusted Operating Margin increased to 5.2% compared with 3.6%. The net change in margin on unearned revenue negatively impacted income (loss) from continuing operations, net of tax, by $(6.5) million and Adjusted Operating Income by $(8.7) million.
Balance Sheet and Cash Flow Highlights
-
National Vision’s cash balance was $38.7 million as of January 3, 2026. The Company had no borrowings under its $300.0 million first lien revolving credit facility (“Revolving Loans”), exclusive of letters of credit of $6.7 million.
-
Total debt was $245.9 million as of January 3, 2026, consisting of outstanding first lien term loans and finance lease obligations, net of unamortized discounts.
-
National Vision entered into an interest rate swap during the fourth quarter of 2025 to help offset the variability of cash flows in term loan interest payments attributable to changes in Term SOFR. The notional amount of the hedge is $100.0 million.
Share Repurchase Program
On January 3, 2026, the Company’s previous share repurchase authorization expired with remaining capacity of $50 million. Effective March 2, 2026, the Company’s board of directors authorized the Company to repurchase up to $50 million aggregate amount of shares of the Company’s common stock until December 28, 2030. Repurchases of shares of common stock may be made through various methods, including, but not limited to, open market, privately negotiated, or accelerated share repurchase transactions. The timing, manner, price, and actual amount of share repurchases will be determined by management based on various factors, including, but not limited to, stock price, economic and market conditions, other capital management needs and opportunities, and corporate and regulatory considerations. The Company has no obligation to repurchase any amount of its common stock, and such repurchases, if any, may be suspended or discontinued at any time.
Fiscal 2026 Outlook
The Company is providing the following outlook for the 52 weeks ending January 2, 2027.
| | Fiscal 2026 Outlook |
| New Stores(1) | ~30-35 |
| Adjusted Comparable Store Sales Growth(2) | 3.0% - 6.0% |
| Net Revenue | $2.033 billion - $2.091 billion |
| Adjusted Operating Income(2) | $107 million - $133 million |
| Adjusted Diluted EPS(2)(3) | $0.85 - $1.09 |
| Depreciation and Amortization(4) | $88 million - $92 million |
| Interest(5) | $14 million - $16 million |
| Tax Rate(6) | ~28% |
| Capital Expenditures | $73 million - $78 million |
| 1 | Assumes primarily America's Best new stores. |
| 2 | Refer to “Non-GAAP Financial Measures” below for more information. |
| 3 | Assumes approximately 82 million shares. |
| 4 | Includes amortization of acquisition intangibles of approximately $0.7 million, which is excluded in the definition of Adjusted Operating Income. |
| 5 | Before the impact of gains or losses on change in fair value of derivatives and charges related to debt discounts and deferred financing costs. |
| 6 | Excluding the impact of vesting of restricted stock units and stock option exercises. |
The fiscal 2026 outlook information provided in this release includes Adjusted Operating Income and Adjusted Diluted EPS guidance. The Company is not able to reconcile these forward-looking non-GAAP measures to GAAP without unreasonable efforts because it is not possible to predict with a reasonable degree of certainty the actual impact of certain items and unanticipated events, including taxes and non-recurring items, which would be included in GAAP results.
The fiscal 2026 outlook is forward-looking, subject to significant business, economic, regulatory and competitive uncertainties and contingencies, many of which are beyond the control of the Company and its management, and based upon assumptions with respect to future decisions, which are subject to change. These uncertainties include, but are not limited to, dynamic market conditions, unexpected disruptions including additional regulatory actions impacting international trade such as tariffs, and other macroeconomic risks and uncertainties. Actual results may vary and those variations may be material. As such, the Company’s results may not fall within the ranges contained in its fiscal 2026 outlook. The Company uses these forward-looking measures internally to assess and benchmark its results and strategic plans. See “Forward-Looking Statements” below.
Conference Call Details
The Company will host a conference call to discuss the fourth quarter 2025 financial results and fiscal-year 2026 guidance today, March 4, 2026, at 8:30 a.m. Eastern Time. To pre-register for the conference call and obtain a dial-in number and passcode please refer to the “Investors” section of the Company's website at www.ir.nationalvision.com. A live audio webcast of the conference call will be available on the “Investors” section of the Company’s website at www.ir.nationalvision.com, where presentation materials will be posted prior to the conference call. A replay of the audio webcast will also be archived on the “Investors” section of the Company’s website.
About National Vision Holdings, Inc.
National Vision Holdings, Inc. (NASDAQ: EYE) is one of the largest optical retail companies in the United States with over 1,200 stores in 38 states and Puerto Rico. With a mission of helping people by making quality eye care and eyewear more affordable and accessible, the company operates four retail brands: America’s Best, Eyeglass World, and Vista Opticals inside select Fred Meyer stores and on select military bases, and an e-commerce website DiscountContacts.com, offering a variety of products and services for customers’ eye care needs. For more information, please visit www.nationalvision.com.
Forward-Looking Statements
This press release contains forward-looking statements within the meaning of Section 27A of the Securities Act of 1933, as amended (the “Securities Act”) and Section 21E of the Securities Exchange Act of 1934. These statements include, but are not limited to, statements contained under “Fiscal 2026 Outlook” as well as other statements related to our current beliefs and expectations regarding the performance of our industry, the Company’s strategic direction, market position, prospects including remote medicine and optometrist recruiting and retention initiatives, and future results. You can identify these forward-looking statements by the use of words such as “outlook,” “guidance,” “believes,” “expects,” “potential,” “continues,” “may,” “will,” “should,” “could,” “seeks,” “projects,” “predicts,” “intends,” “plans,” “estimates,” “anticipates” or variations of these words or other comparable words. Caution should be taken not to place undue reliance on any forward-looking statement as such statements speak only as of the date when made. We undertake no obligation to publicly update or review any forward-looking statement, whether as a result of new information, future developments or otherwise, except as required by law. Forward-looking statements are not guarantees and are subject to various risks and uncertainties, which may cause actual results to differ materially from those implied in forward-looking statements. Such factors include, but are not limited to, market volatility, an overall decline in the health of the economy, global macroeconomic conditions and other factors may affect consumer spending or behavior, which could materially harm our sales, profitability and financial condition; we may not be successful in implementing our strategic initiatives, or in anticipating the impact of important strategic initiatives, and our plans for implementing such initiatives may be altered or delayed due to various factors, which may have an adverse impact on our business and financial results; the optical retail industry is highly competitive, and if we do not compete successfully, our business may be materially adversely impacted; our success depends substantially on the value of our owned brands, and failure to maintain, protect, and enhance their value could have a negative impact on our business, financial condition, and results of operations; our success depends upon our marketing, advertising and promotional efforts and if we are unable to implement them successfully or efficiently, or if our competitors are more effective than we are, we may experience a material adverse effect on our business, financial condition and results of operations; if we fail to open and operate new stores (including as a result of store conversions) in a timely and cost-effective manner or fail to successfully enter new markets, our financial performance could be materially adversely affected; our growth is dependent on our ability to increase sales in existing stores and to successfully reinvest in existing stores; if we are unable to successfully implement our pricing strategies, it could have a material adverse impact on our business; failure to recruit and retain vision care professionals for in-store roles or to provide remote care offerings could adversely affect our business, financial condition and results of operations; we are a value-based provider and our business model relies on the low cost of inputs, and factors such as wage rate increases, inflation, cost increases, increases in the price of raw materials and energy prices could have a material adverse effect on our business, financial condition and results of operations; we require significant capital to fund our expanding business including updating our Enterprise Resource Planning (“ERP”) and Customer Relationship Management (“CRM”), and other technological, systems and capabilities; our growth strategies could strain our existing resources and cause the performance of our existing stores to suffer; we are subject to risks associated with leasing substantial amounts of space, including future increases in occupancy costs; our e-commerce and omni-channel business faces distinct risks, and our failure to successfully manage those risks could have a negative impact on our profitability; if we fail to retain our existing senior management team, attract qualified new personnel or successfully implement our succession plans, such failure could have a material adverse effect on our business, financial condition and results of operations; our operating results and inventory levels fluctuate on a seasonal basis; catastrophic events, including changing climate and weather patterns leading to severe weather and natural disasters may cause significant business interruptions and expenditures; certain technological advances, greater availability of, or increased consumer preferences for, vision correction alternatives to prescription eyeglasses or contact lenses, or future drug development for the correction of vision-related problems may reduce the demand for our products and materially adversely impact our business and profitability; our profitability and cash flows may be materially adversely affected if we are not successful in managing our inventory balances and inventory shrinkage; we depend on our distribution centers and optical laboratories and the loss of, or disruption in the operations of, one or more of these facilities may adversely affect our ability to process and fulfill customer orders and deliver our products in a timely manner, or at all, and may result in quality issues, which would materially adversely affect our reputation, our business and our profitability; if the performance of our Host brands declines or we are unable to maintain or extend our operating relationships with our Host partners, our business, profitability and cash flows may be adversely affected and we may be required to incur impairment charges; sustainability issues, including those related to climate change, could have a material adverse effect on our business, financial condition and results of operations; our future operational success depends on our ability to develop, maintain and extend relationships with managed vision care companies, vision insurance providers and other third-party payors; we rely on third-party coverage and reimbursement, including government programs, for an increasing portion of our revenues, the future reduction of which could materially adversely affect our results of operations; we face risks associated with vendors from whom our products and certain services are sourced and are dependent on a limited number of suppliers; our ability to source merchandise and services outside of the U.S. could be adversely impacted by changes in U.S. or international laws, including the imposition of tariffs by the U.S. and the resulting consequences; we rely heavily on our information technology systems, as well as those of our vendors, for our business to effectively operate and to safeguard confidential information and any significant failure, inadequacy, interruption or security breach could materially adversely affect our business, financial condition and operations; we are subject to extensive state, local and federal vision care and healthcare laws and regulations and failure to adhere to such laws and regulations would materially adversely affect our business; we are subject to managed vision care laws and regulations and the failure to comply with such laws and regulations could have a materially negative impact on our business, financial condition or results of operations; we are subject to rapidly changing and increasingly stringent laws, regulations, contractual obligations, and industry standards relating to privacy, data security and data protection, which could subject us to liabilities that materially adversely affect our business, operations and financial performance; we could be materially adversely affected by product liability, product recall or personal injury issues; failure to comply with laws, regulations and enforcement activities or changes in statutory, regulatory, accounting and other legal requirements could materially negatively impact our business, financial condition or results of operations; adverse judgments or settlements resulting from legal proceedings relating to our business operations could materially adversely affect our business, financial condition and results of operations; we may not be able to adequately protect our intellectual property, which could harm the value of our brand and materially adversely affect our business; we have a significant amount of indebtedness which could adversely affect our business and financial position, including by limiting our business flexibility and preventing us from meeting our debt obligations; a change in interest rates may adversely affect our business; our credit agreement contains restrictions that limit our flexibility in operating our business; and risks related to owning our common stock, including our ability to comply with requirements to design and implement and maintain effective internal controls. Additional information about these and other factors that could cause National Vision’s results to differ materially from those described in the forward-looking statements can be found in filings by National Vision with the Securities and Exchange Commission (“SEC”), including our latest Annual Report on Form 10-K and subsequent Quarterly Reports on Form 10-Q, which are accessible on the SEC’s website at www.sec.gov. These factors should not be construed as exhaustive and should be read in conjunction with the other cautionary statements that are included in this release and in our filings with the SEC.
Non-GAAP Financial Measures
To supplement the Company’s financial information presented in accordance with GAAP and aid understanding of the Company’s business performance, the Company uses certain non-GAAP financial measures, namely “EBITDA,” “Adjusted Operating Income,” “Adjusted Operating Margin,” “Adjusted EBITDA,” “Adjusted EBITDA Margin,” “Adjusted Diluted EPS,” “Adjusted Comparable Stores Sales Growth,” “Adjusted SG&A,” and “Adjusted SG&A Percent of Net Revenue.” We believe EBITDA, Adjusted Operating Income, Adjusted Operating Margin, Adjusted EBITDA, Adjusted EBITDA Margin, Adjusted Diluted EPS, Adjusted SG&A, and Adjusted SG&A Percent of Net Revenue assist investors and analysts in comparing our operating performance across reporting periods on a consistent basis by excluding items that we do not believe are indicative of our core operating performance. Management believes these non-GAAP financial measures are useful to investors in highlighting trends in our operating performance, while other measures can differ significantly depending on long-term strategic decisions regarding capital structure, the tax jurisdictions in which we operate and capital investments. Management uses these non-GAAP financial measures to supplement GAAP measures of performance in the evaluation of the effectiveness of our business strategies, to make budgeting decisions, to establish discretionary annual incentive compensation and to compare our performance against that of other peer companies using similar measures. Management supplements GAAP results with non-GAAP financial measures to provide a more complete understanding of the factors and trends affecting the business than GAAP results alone.
To supplement the Company’s comparable store sales growth presented in accordance with GAAP, the Company provides “Adjusted Comparable Store Sales Growth,” which is a non-GAAP financial measure we believe is useful because it provides timely and accurate information relating to the two core metrics of retail sales: number of transactions and value of transactions. Management uses Adjusted Comparable Store Sales Growth as the basis for key operating decisions, such as allocation of advertising to particular markets and implementation of special marketing programs. Accordingly, we believe that Adjusted Comparable Store Sales Growth provides timely and accurate information relating to the operational health and overall performance of each brand. We also believe that, for the same reasons, investors find our calculation of Adjusted Comparable Store Sales Growth to be meaningful.
**EBITDA:**We define EBITDA from continuing operations as net income (loss), minus income (loss) from discontinued operations, net of tax, plus interest expense (income), net, income tax provision (benefit), and depreciation and amortization.
Adjusted Operating Income: We define Adjusted Operating Income from continuing operations as net income (loss), minus income (loss) from discontinued operations, net of tax, plus interest expense (income), net and income tax provision (benefit), further adjusted to exclude stock-based compensation expense, (gain) loss on extinguishment of debt, asset impairment, litigation settlement, secondary offering expenses, management realignment expenses, long-term incentive plan expenses, amortization of acquisition intangibles, Enterprise Resource Planning (“ERP”) and Customer Relationship Management ("CRM") implementation expenses, shareholder activism costs, severance and associate-related costs associated with organization restructuring and certain other expenses.
**Adjusted Operating Margin:**We define Adjusted Operating Margin from continuing operations as Adjusted Operating Income from continuing operations as a percentage of total net revenue.
Adjusted EBITDA: We define Adjusted EBITDA from continuing operations as net income (loss), minus income (loss) from discontinued operations, net of tax, plus interest expense (income), net, income tax provision (benefit) and depreciation and amortization, further adjusted to exclude stock-based compensation expense, (gain) loss on extinguishment of debt, asset impairment, litigation settlement, secondary offering expenses, management realignment expenses, long-term incentive plan expenses, ERP and CRM implementation expenses, shareholder activism costs, severance and associate-related costs associated with organization restructuring and certain other expenses.
**Adjusted EBITDA Margin:**We define Adjusted EBITDA Margin from continuing operations as Adjusted EBITDA from continuing operations as a percentage of total net revenue.
Adjusted Diluted EPS: We define Adjusted Diluted EPS from continuing operations as diluted earnings (loss) per share, minus diluted earnings (loss) per share from discontinued operations, adjusted for the per share impact of stock-based compensation expense, (gain) loss on extinguishment of debt, asset impairment, litigation settlement, secondary offering expenses, management realignment expenses, long-term incentive plan expenses, amortization of acquisition intangibles, amortization of debt discounts and deferred financing costs of our term loan borrowings, amortization of the conversion feature and deferred financing costs related to our 2.50% convertible senior notes due on May 15, 2025 ("2025 Notes") when not required under U.S. GAAP to be added back for diluted earnings (loss) per share, derivative fair value adjustments, ERP and CRM implementation expenses, shareholder activism costs, severance and associate-related costs associated with organization restructuring, certain other expenses, and related tax effects.
Adjusted SG&A: We define Adjusted SG&A from continuing operations as SG&A from continuing operations adjusted to exclude stock-based compensation expense, litigation settlement, secondary offering expenses, management realignment expenses, long-term incentive plan expense, ERP and CRM implementation expenses, shareholder activism costs, severance and associate-related costs associated with organization restructuring and certain other expenses.
Adjusted SG&A Percent of Net Revenue: We define Adjusted SG&A Percent of Net Revenue from continuing operations as Adjusted SG&A from continuing operations as a percentage of total net revenue.
Adjusted Comparable Store Sales Growth: We measure Adjusted Comparable Store Sales Growth as the increase or decrease in sales recorded by the comparable store base in any reporting period, compared to sales recorded by the comparable store base in the prior reporting period, which we calculate as follows: (i) sales are recorded at the point of sale (ii) sales are adjusted for managed care insurance collection estimates (iii) stores are added to the calculation during the 13th full fiscal month following the store’s opening; (iv) closed stores are removed from the calculation for time periods that are not comparable; (v) sales from partial months of operation are excluded when stores do not open or close on the first day of the month; and (vi) when applicable, we adjust for the effect of the 53rd week. Quarterly, year-to-date and annual adjusted comparable store sales are aggregated using only sales from all whole months of operation included in both the current reporting period and the prior reporting period. When a partial month is excluded from the calculation, the corresponding month in the subsequent period is also excluded from the calculation. There may be variations in the way in which some of our competitors and other retailers calculate comparable store sales. As a result, our adjusted comparable store sales may not be comparable to similar data made available by other retailers.
EBITDA, Adjusted Operating Income, Adjusted Operating Margin, Adjusted EBITDA, Adjusted EBITDA Margin, Adjusted Diluted EPS, Adjusted SG&A, Adjusted SG&A Percent of Net Revenue and Adjusted Comparable Store Sales Growth are not recognized terms under U.S. GAAP and should not be considered as an alternative to net income or the ratio of net income to net revenue as a measure of financial performance, SG&A, the ratio of SG&A to net revenue as a measure of financial performance, cash flows provided by operating activities as a measure of liquidity, comparable store sales growth as a measure of operating performance, or any other performance measure derived in accordance with U.S. GAAP. Additionally, these measures are not intended to be a measure of free cash flow available for management’s discretionary use as they do not consider certain cash requirements such as interest payments, tax payments and debt service requirements. The presentations of these measures have limitations as analytical tools and should not be considered in isolation, or as a substitute for analysis of our results as reported under U.S. GAAP. Because not all companies use identical calculations, the presentations of these measures may not be comparable to other similarly titled measures of other companies and can differ significantly from company to company.
Please see “Reconciliation of Non-GAAP to GAAP Financial Measures” below for reconciliations of non-GAAP financial measures used in this release to their most directly comparable GAAP financial measures.
| National Vision Holdings, Inc. and Subsidiaries Consolidated Balance Sheets In Thousands, Except Share Data |
| | | | |
| | As of January 3, 2026 | | As of December 28, 2024 |
| ASSETS | | | |
| Current assets: | | | |
| Cash and cash equivalents | $ | 38,708 | | | $ | 73,948 | |
| Accounts receivable, net | | 57,322 | | | | 49,938 | |
| Inventories | | 89,318 | | | | 93,918 | |
| Prepaid expenses and other current assets | | 40,374 | | | | 32,024 | |
| Total current assets | | 225,722 | | | | 249,828 | |
| | | | |
| Noncurrent assets: | | | |
| Property and equipment, net | | 344,619 | | | | 362,175 | |
| Goodwill | | 700,642 | | | | 698,305 | |
| Trademarks and trade names | | 240,547 | | | | 240,547 | |
| Other intangible assets, net | | 7,554 | | | | 8,269 | |
| Right of use assets | | 394,896 | | | | 408,589 | |
| Other assets | | 69,698 | | | | 40,058 | |
| Total noncurrent assets | | 1,757,956 | | | | 1,757,943 | |
| Total assets | $ | 1,983,678 | | | $ | 2,007,771 | |
| | | | |
| LIABILITIES AND STOCKHOLDERS’ EQUITY | | | |
| Current liabilities: | | | |
| Accounts payable | $ | 78,999 | | | $ | 53,643 | |
| Other payables and accrued expenses | | 109,674 | | | | 109,036 | |
| Unearned revenue | | 52,279 | | | | 42,002 | |
| Deferred revenue | | 64,560 | | | | 62,507 | |
| Current maturities of long-term debt and finance lease obligations | | 16,583 | | | | 101,392 | |
| Current operating lease obligations | | 90,313 | | | | 99,694 | |
| Total current liabilities | | 412,408 | | | | 468,274 | |
| | | | |
| Noncurrent liabilities: | | | |
| Long-term debt and finance lease obligations, less current portion and debt discount | | 229,327 | | | | 248,610 | |
| Noncurrent operating lease obligations | | 358,377 | | | | 366,335 | |
| Deferred revenue | | 22,517 | | | | 22,082 | |
| Other liabilities | | 8,944 | | | | 8,228 | |
| Deferred income taxes, net | | 82,572 | | | | 77,909 | |
| Total noncurrent liabilities | | 701,737 | | | | 723,164 | |
| Commitments and contingencies | | | |
| Stockholders’ equity: | | | |
| Common stock, $0.01 par value; 200,000,000 shares authorized; 86,278,538 and 85,444,263 shares issued as of January 3, 2026 and December 28, 2024, respectively; 79,416,050 and 78,775,117 shares outstanding as of January 3, 2026 and December 28, 2024, respectively | | 862 | | | | 854 | |
| Additional paid-in capital | | 834,000 | | | | 807,048 | |
| Accumulated other comprehensive loss | | (121 | ) | | | — | |
| Retained earnings | | 255,717 | | | | 226,117 | |
| Treasury stock, at cost; 6,862,488 and 6,669,146 shares as of January 3, 2026 and December 28, 2024, respectively | | (220,925 | ) | | | (217,686 | ) |
| Total stockholders’ equity | | 869,533 | | | | 816,333 | |
| Total liabilities and stockholders’ equity | $ | 1,983,678 | | | $ | 2,007,771 | |
| | | | | | | | |
| Note: Fiscal year 2025 includes 53 weeks. Fiscal year 2024 includes 52 weeks. |
| National Vision Holdings, Inc. and Subsidiaries Consolidated Statements of Operations and Comprehensive (Loss) Income In Thousands, Except Per Share Amounts |
| | | | |
| | Three Months Ended | | Fiscal Year |
| | January 3, 2026 (Unaudited) | | December 28, 2024 (Unaudited) | | | 2025 | | | | 2024 | |
| Revenue: | | | | | | | |
| Net product sales | $ | 403,755 | | | $ | 349,933 | | | $ | 1,604,592 | | | $ | 1,463,139 | |
| Net sales of services and plans | | 99,656 | | | | 87,345 | | | | 382,896 | | | | 360,181 | |
| Total net revenue | | 503,411 | | | | 437,278 | | | | 1,987,488 | | | | 1,823,320 | |
| Costs applicable to revenue (exclusive of depreciation and amortization): | | | | | | | |
| Products | | 114,998 | | | | 102,385 | | | | 461,213 | | | | 433,194 | |
| Services and plans | | 95,711 | | | | 82,616 | | | | 358,256 | | | | 330,862 | |
| Total costs applicable to revenue | | 210,709 | | | | 185,001 | | | | 819,469 | | | | 764,056 | |
| Operating expenses: | | | | | | | |
| Selling, general and administrative expenses | | 261,213 | | | | 233,052 | | | | 1,016,251 | | | | 938,524 | |
| Depreciation and amortization | | 23,468 | | | | 22,746 | | | | 91,152 | | | | 91,349 | |
| Asset impairment | | 1,489 | | | | 22,150 | | | | 1,991 | | | | 39,851 | |
| Other expense (income), net | | (103 | ) | | | (100 | ) | | | (204 | ) | | | (101 | ) |
| Total operating expenses | | 286,067 | | | | 277,848 | | | | 1,109,190 | | | | 1,069,623 | |
| Income (loss) from operations | | 6,635 | | | | (25,571 | ) | | | 58,829 | | | | (10,359 | ) |
| Interest expense, net | | 4,247 | | | | 4,624 | | | | 17,148 | | | | 16,184 | |
| (Gain) loss on extinguishment of debt | | — | | | | — | | | | — | | | | (859 | ) |
| Earnings (loss) before income taxes | | 2,388 | | | | (30,195 | ) | | | 41,681 | | | | (25,684 | ) |
| Income tax provision (benefit) | | (929 | ) | | | (758 | ) | | | 12,081 | | | | 1,481 | |
| Income (loss) from continuing operations | $ | 3,317 | | | $ | (29,437 | ) | | $ | 29,600 | | | $ | (27,165 | ) |
| Income (loss) from discontinued operations, net of tax | $ | — | | | $ | 846 | | | $ | — | | | $ | (1,334 | ) |
| Net income (loss) | $ | 3,317 | | | $ | (28,591 | ) | | $ | 29,600 | | | $ | (28,499 | ) |
| | | | | | | | |
| Basic Earnings (loss) per share: | | | | | | | |
| Continuing operations | $ | 0.04 | | | $ | (0.37 | ) | | $ | 0.37 | | | $ | (0.35 | ) |
| Discontinued operations | $ | — | | | $ | 0.01 | | | $ | — | | | $ | (0.02 | ) |
| Total | $ | 0.04 | | | $ | (0.36 | ) | | $ | 0.37 | | | $ | (0.36 | ) |
| Diluted Earnings (loss) per share: | | | | | | | |
| Continuing operations | $ | 0.04 | | | $ | (0.37 | ) | | $ | 0.37 | | | $ | (0.35 | ) |
| Discontinued operations | $ | — | | | $ | 0.01 | | | $ | — | | | $ | (0.02 | ) |
| Total | $ | 0.04 | | | $ | (0.36 | ) | | $ | 0.37 | | | $ | (0.36 | ) |
| | | | | | | | |
| Weighted average shares outstanding: | | | | | | | |
| Basic | | 79,347 | | | | 78,754 | | | | 79,131 | | | | 78,592 | |
| Diluted | | 81,777 | | | | 78,754 | | | | 80,576 | | | | 78,592 | |
| | | | | | | | |
| Comprehensive income (loss): | | | | | | | |
| Net income (loss) | $ | 3,317 | | | $ | (28,591 | ) | | $ | 29,600 | | | $ | (28,499 | ) |
| Unrealized gain (loss) on hedge instruments | | (161 | ) | | | — | | | | (161 | ) | | | 548 | |
| Tax provision of unrealized gain (loss) on hedge instruments | | (40 | ) | | | — | | | | (40 | ) | | | 129 | |
| Comprehensive income (loss) | $ | 3,196 | | | $ | (28,591 | ) | | $ | 29,479 | | | $ | (28,080 | ) |
| | | | | | | | | | | | | | | | |
| Note: Fiscal year 2025 includes 53 weeks. Fiscal year 2024 includes 52 weeks. |
| |
| |
| Three months ended January 3, 2026 include 14 weeks. Three months ended December 28, 2024 include 13 weeks. |
| National Vision Holdings, Inc. and Subsidiaries Consolidated Statements of Cash Flows In Thousands |
| | | | |
| | Fiscal Year 2025 | | Fiscal Year 2024 |
| Cash flows from operating activities: | | |
| Net income (loss) | $ | 29,600 | | | $ | (28,499 | ) |
| Adjustments to reconcile net income (loss) to cash provided by operating activities: | | | |
| Depreciation and amortization | | 91,152 | | | | 92,680 | |
| Amortization of debt discount and deferred financing costs | | 1,217 | | | | 2,121 | |
| Amortization of cloud computing implementation costs | | 8,741 | | | | 6,402 | |
| Asset impairment | | 1,991 | | | | 40,099 | |
| Deferred income tax expense (benefit) | | 4,663 | | | | (9,975 | ) |
| Stock-based compensation expense | | 23,686 | | | | 16,708 | |
| (Gains) on change in fair value of derivatives | | — | | | | (34 | ) |
| Inventory adjustments | | 5,327 | | | | 4,391 | |
| Other | | (56 | ) | | | (1,013 | ) |
| Changes in operating assets and liabilities: | | | |
| Accounts receivable | | (8,069 | ) | | | 36,399 | |
| Inventories | | (728 | ) | | | 21,598 | |
| Operating lease right of use assets and liabilities | | (1,822 | ) | | | (2,321 | ) |
| Other assets | | (45,656 | ) | | | (7,286 | ) |
| Accounts payable | | 25,356 | | | | (13,913 | ) |
| Deferred and unearned revenue | | 12,766 | | | | (5,852 | ) |
| Other liabilities | | (1,875 | ) | | | (17,856 | ) |
| Net cash provided by operating activities | | 146,293 | | | | 133,649 | |
| Cash flows from investing activities: | | | |
| Purchase of property and equipment | | (72,840 | ) | | | (95,505 | ) |
| Other | | (3,766 | ) | | | (589 | ) |
| Net cash used for investing activities | | (76,606 | ) | | | (96,094 | ) |
| Cash flows from financing activities: | | | |
| Repayments on long-term debt | | (126,337 | ) | | | (222,064 | ) |
| Borrowings on long-term debt | | 25,000 | | | | 115,000 | |
| Payments of debt issuance costs | | — | | | | (1,703 | ) |
| Payments on finance lease obligations | | (3,475 | ) | | | (2,993 | ) |
| Proceeds from issuance of common stock | | 3,395 | | | | 1,507 | |
| Purchase of treasury stock | | (3,205 | ) | | | (3,092 | ) |
| Net cash used for financing activities | | (104,622 | ) | | | (113,345 | ) |
| Net change in cash, cash equivalents and restricted cash | | (34,935 | ) | | | (75,790 | ) |
| Cash, cash equivalents and restricted cash, beginning of year | | 75,237 | | | | 151,027 | |
| Cash, cash equivalents and restricted cash, end of year (i) | $ | 40,302 | | | $ | 75,237 | |
| | | | |
| Supplemental cash flow disclosure information: | | | |
| Cash paid for interest | $ | 19,091 | | | $ | 13,398 | |
| Capital expenditures accrued at the end of the period | $ | 12,186 | | | $ | 9,248 | |
| | | | | | | | |
| (i) Cash balance includes restricted cash of $1.6 million and $1.3 million for fiscal years 2025 and 2024, respectively, that are not reflected in cash and cash equivalents shown on the Condensed Consolidated Balance Sheets. |
| |
| |
| Note: Fiscal year 2025 includes 53 weeks. Fiscal year 2024 includes 52 weeks. |
| National Vision Holdings, Inc. and Subsidiaries Reconciliation of Non-GAAP to GAAP Financial Measures In Thousands, Except Earnings Per Share (Unaudited) |
| |
| |
| Reconciliation of Adjusted Operating Income from Continuing Operations to Net Income (loss) |
| | | | | | | | | | |
| In thousands | Three Months Ended January 3, 2026 | | Three Months Ended December 28, 2024 | | Fiscal Year 2025 | | Fiscal Year 2024 | | 53rd Week Ended January 3, 2026 |
| Net income (loss) | $ | 3,317 | | | $ | (28,591 | ) | | $ | 29,600 | | | $ | (28,499 | ) | | $ | 2,392 | |
| Income (loss) from discontinued operations, net of tax | | — | | | | 846 | | | | — | | | | (1,334 | ) | | | — | |
| Income (loss) from continuing operations | | 3,317 | | | | (29,437 | ) | | | 29,600 | | | | (27,165 | ) | | | 2,392 | |
| Interest expense, net | | 4,247 | | | | 4,624 | | | | 17,148 | | | | 16,184 | | | | 275 | |
| Income tax provision (benefit) | | (929 | ) | | | (758 | ) | | | 12,081 | | | | 1,481 | | | | 802 | |
| Stock-based compensation expense (a) | | 5,850 | | | | 4,929 | | | | 23,686 | | | | 16,708 | | | | — | |
| Gain on extinguishment of debt (b) | | — | | | | — | | | | — | | | | (859 | ) | | | — | |
| Asset impairment (c) | | 1,489 | | | | 22,150 | | | | 1,991 | | | | 39,851 | | | | — | |
| Litigation settlement (d) | | — | | | | — | | | | 1,903 | | | | 4,450 | | | | — | |
| Amortization of acquisition intangibles (e) | | 170 | | | | 169 | | | | 677 | | | | 1,313 | | | | — | |
| ERP and CRM implementation expenses (h) | | 891 | | | | 1,529 | | | | 6,420 | | | | 5,990 | | | | — | |
| Other (i) | | 2,550 | | | | 22 | | | | 8,962 | | | | 7,536 | | | | — | |
| Adjusted Operating Income (loss) from continuing operations | $ | 17,585 | | | $ | 3,228 | | | $ | 102,468 | | | $ | 65,489 | | | $ | 3,469 | |
| | | | | | | | | | |
| Income (loss) margin from continuing operations | | 0.7 | % | | | (6.7 | )% | | | 1.5 | % | | | (1.5 | )% | | | 6.7 | % |
| Adjusted Operating Margin from continuing operations | | 3.5 | % | | | 0.7 | % | | | 5.2 | % | | | 3.6 | % | | | 9.7 | % |
| Note: Percentages reflect line item as a percentage of net revenue, adjusted for rounding. |
| Reconciliation of EBITDA from Continuing Operations and Adjusted EBITDA from Continuing Operations to Net Income (loss) |
| | | | | | | | |
| In thousands | Three Months Ended January 3, 2026 | | Three Months Ended December 28, 2024 | | Fiscal Year 2025 | | Fiscal Year 2024 |
| Net income (loss) | $ | 3,317 | | | $ | (28,591 | ) | | $ | 29,600 | | | $ | (28,499 | ) |
| Income (loss) from discontinued operations, net of tax | | — | | | | 846 | | | | — | | | | (1,334 | ) |
| Income (loss) from continuing operations | | 3,317 | | | | (29,437 | ) | | | 29,600 | | | | (27,165 | ) |
| Interest expense, net | | 4,247 | | | | 4,624 | | | | 17,148 | | | | 16,184 | |
| Income tax provision (benefit) | | (929 | ) | | | (758 | ) | | | 12,081 | | | | 1,481 | |
| Depreciation and amortization | | 23,468 | | | | 22,746 | | | | 91,152 | | | | 91,349 | |
| EBITDA from continuing operations | | 30,103 | | | | (2,825 | ) | | | 149,981 | | | | 81,849 | |
| | | | | | | | |
| Stock-based compensation expense (a) | | 5,850 | | | | 4,929 | | | | 23,686 | | | | 16,708 | |
| (Gain) loss on extinguishment of debt (b) | | — | | | | — | | | | — | | | | (859 | ) |
| Asset impairment (c) | | 1,489 | | | | 22,150 | | | | 1,991 | | | | 39,851 | |
| Litigation settlement (d) | | — | | | | — | | | | 1,903 | | | | 4,450 | |
| ERP and CRM implementation expenses (h) | | 891 | | | | 1,529 | | | | 6,420 | | | | 5,990 | |
| Other (i) | | 2,550 | | | | 22 | | | | 8,962 | | | | 7,536 | |
| Adjusted EBITDA from continuing operations | $ | 40,883 | | | $ | 25,805 | | | $ | 192,943 | | | $ | 155,525 | |
| | | | | | | | |
| Income (loss) margin from continuing operations | | 0.7 | % | | | (6.7 | )% | | | 1.5 | % | | | (1.5 | )% |
| Adjusted EBITDA Margin from continuing operations | | 8.1 | % | | | 5.9 | % | | | 9.7 | % | | | 8.5 | % |
| Note: Percentages reflect line item as a percentage of net revenue, adjusted for rounding. |
| Reconciliation of Adjusted Diluted EPS from Continuing Operations to Diluted EPS |
| | | | | | | | |
| In thousands, except per share amounts | Three Months Ended January 3, 2026 | | Three Months Ended December 28, 2024 | | Fiscal Year 2025 | | Fiscal Year 2024 |
| Diluted EPS | $ | 0.04 | | | $ | (0.36 | ) | | $ | 0.37 | | | $ | (0.36 | ) |
| Diluted EPS from discontinued operations | | — | | | | 0.01 | | | | — | | | | (0.02 | ) |
| Diluted EPS from continuing operations | | 0.04 | | | | (0.37 | ) | | | 0.37 | | | | (0.35 | ) |
| Stock-based compensation expense (a) | | 0.07 | | | | 0.06 | | | | 0.29 | | | | 0.21 | |
| (Gain) loss on extinguishment of debt (b) | | — | | | | — | | | | — | | | | (0.01 | ) |
| Asset impairment (c) | | 0.02 | | | | 0.28 | | | | 0.02 | | | | 0.51 | |
| Litigation settlement (d) | | — | | | | — | | | | 0.02 | | | | 0.06 | |
| Amortization of acquisition intangibles (e) | | — | | | | — | | | | 0.01 | | | | 0.02 | |
| Amortization of debt discounts and deferred financing costs (f) | | — | | | | — | | | | 0.02 | | | | 0.03 | |
| Derivative fair value adjustments (g) | | — | | | | — | | | | — | | | | 0.08 | |
| ERP and CRM implementation expenses (h) | | 0.01 | | | | 0.02 | | | | 0.08 | | | | 0.08 | |
| Other (i) | | 0.04 | | | | — | | | | 0.12 | | | | 0.10 | |
| Tax effects(j) | | (0.03 | ) | | | (0.03 | ) | | | (0.13 | ) | | | (0.19 | ) |
| Adjusted Diluted EPS from continuing operations | $ | 0.15 | | | $ | (0.04 | ) | | $ | 0.80 | | | $ | 0.52 | |
| | | | | | | | |
| Weighted average diluted shares outstanding | | 81,777 | | | | 78,754 | | | | 80,576 | | | | 78,592 | |
| Note: Some of the totals in the table above do not foot due to rounding differences. |
| Reconciliation of Adjusted SG&A from Continuing Operations to SG&A from Continuing Operations |
| | | | | | | | |
| In thousands | Three Months Ended January 3, 2026 | | Three Months Ended December 28, 2024 | | Fiscal Year 2025 | | Fiscal Year 2024 |
| SG&A from continuing operations | $ | 261,213 | | | $ | 233,052 | | | $ | 1,016,251 | | | $ | 938,524 | |
| Stock-based compensation expense (a) | | 5,850 | | | | 4,929 | | | | 23,686 | | | | 16,708 | |
| Litigation settlement (d) | | — | | | | — | | | | 1,903 | | | | 4,450 | |
| ERP and CRM implementation expenses (h) | | 891 | | | | 1,529 | | | | 6,420 | | | | 5,990 | |
| Other (i) | | 2,550 | | | | 37 | | | | 8,962 | | | | 7,494 | |
| Adjusted SG&A from continuing operations | $ | 251,922 | | | $ | 226,557 | | | $ | 975,280 | | | $ | 903,882 | |
| | | | | | | | |
| SG&A from continuing operations Percent of Net Revenue | | 51.9 | % | | | 53.3 | % | | | 51.1 | % | | | 51.5 | % |
| Adjusted SG&A from continuing operations Percent of Net Revenue | | 50.0 | % | | | 51.8 | % | | | 49.1 | % | | | 49.6 | % |
| Note: Percentages reflect line item as a percentage of net revenue. |
| (a) | | Non-cash charges related to stock-based compensation programs, which vary from period to period depending on the timing of awards and performance vesting conditions. |
| (b) | | Reflects the extinguishment (gain) loss related to the repurchase of the 2025 Notes of $217.7 million during fiscal year 2024. |
| (c) | | Reflects write-off related to non-cash impairment charges, primarily impairment of Eyeglass World goodwill of $19.2 million for Q4 2024 and fiscal year 2024, Fred Meyer contracts and relationship asset of $10.5 million for fiscal year 2024, impairment of property, equipment and lease-related assets on closed or underperforming stores in fiscal year 2025 and certain store closure decisions made as part of the Company’s store optimization review during fiscal year 2024. |
| (d) | | Expenses associated with settlement of certain litigation. |
| (e) | | Amortization of the increase in carrying values of finite-lived intangible assets resulting from the purchase accounting following the acquisition of the Company by affiliates of KKR & Co. Inc. |
| (f) | | Amortization of deferred financing costs and other non-cash charges related to our debt. We adjust for amortization of deferred financing costs related to the 2025 Notes only when adjustment for these costs is not required in the calculation of diluted earnings per share under U.S. GAAP. |
| (g) | | The adjustments for the derivative fair value (gains) and losses have the effect of adjusting the (gain) or loss for changes in the fair value of derivative instruments and amortization of AOCL for derivatives not designated as accounting hedges. This results in reflecting derivative (gains) and losses within Adjusted Diluted EPS during the period the derivative is settled. |
| (h) | | Costs related to the Company’s ERP and CRM implementations. |
| (i) | | Other adjustments include amounts that management believes are not representative of our operating performance (amounts in brackets represent reductions in Adjusted Operating Income, Adjusted Diluted EPS and Adjusted EBITDA), which are primarily related to costs associated with the digitization of paper-based records of $1.6 million and $2.2 million for the three and twelve months ended January 3, 2026, respectively, and $0.1 million and $5.8 million for the three and twelve months ended December 28, 2024, respectively, shareholder activism of $2.1 million for the twelve months ended January 3, 2026, severance and associate-related costs related to organizational restructuring of $0.7 million and $3.6 million for the three and twelve months ended January 3, 2026 and other expenses and adjustments. Other adjustments for Adjusted SG&A exclude gains and losses on other investments and optometrist-related store optimization costs. |
| (j) | | Represents the income tax effect of the total adjustments at our combined statutory federal and state income tax rates, excluding a portion of Eyeglass World goodwill impairment charge, which was disallowed for income tax purposes in fiscal year 2024, and including tax expense (benefit) from stock-based compensation. |
| Reconciliation of Adjusted Comparable Store Sales Growth to Total Comparable Store Sales Growth |
| |
| |
| | Comparable store sales growth from continuing operations (a) |
| | Three Months Ended January 3, 2026 | | Three Months Ended December 28, 2024 | | Fiscal Year 2025 | | Fiscal Year 2024 | | 2026 Outlook (b) |
| Owned & Host segment | | | | | | | | | |
| America’s Best | 4.7 | % | | 2.0 | % | | 6.3 | % | | 1.8 | % | | |
| Eyeglass World | 6.1 | % | | (1.7 | )% | | 4.2 | % | | (2.2 | )% | | |
| Military | (0.4 | )% | | 0.2 | % | | 2.6 | % | | (0.5 | )% | | |
| Fred Meyer | 6.6 | % | | (2.1 | )% | | 4.9 | % | | (4.5 | )% | | |
| | | | | | | | | | |
| Total comparable store sales growth from continuing operations | 6.6 | % | | 2.6 | % | | 5.9 | % | | 1.9 | % | | 2.8% - 5.8% |
| Adjustments for effects of: (b) | | | | | | | | | |
| Unearned & deferred revenue | (1.8 | )% | | (1.1 | )% | | 0.1 | % | | (0.6 | )% | | 0.2% |
| Adjusted Comparable Store Sales Growth from continuing operations | 4.8 | % | | 1.5 | % | | 6.0 | % | | 1.3 | % | | 3.0% - 6.0% |
| (a) | | Total comparable store sales from continuing operations is calculated based on consolidated net revenue from continuing operations excluding the impact of (i) Corporate and other revenue (ii) sales from stores opened less than 13 months, (iii) stores closed in the periods presented, (iv) sales from partial months of operation when stores do not open or close on the first day of the month, and (v) if applicable, the impact of a 53rd week in a fiscal year. Brand-level comparable store sales growth is calculated based on point of sale revenues consistent with what the CODM reviews, and consistent with reportable segment revenues presented in Note 15. “Segment Reporting” in our consolidated financial statements. |
| (b) | | Adjusted Comparable Store Sales Growth from continuing operations includes the effect of deferred and unearned revenue as if such revenues were earned at the point of sale, resulting in the following changes from total comparable store sales growth based on consolidated net revenue from continuing operations; with respect to the Company’s 2026 Outlook, Adjusted Comparable Store Sales Growth includes an estimated 0.2% increase for the effect of deferred and unearned revenue as if such revenues were earned at the point of sale. |

View source version on businesswire.com: https://www.businesswire.com/news/home/20260304714565/en/
Investor Contact:
[email protected]
National Vision Holdings, Inc.
Tamara Gonzalez
ICR, Inc.
Caitlin Churchill
Media Contact:
[email protected]
Source: National Vision Holdings, Inc.
Search Investors


 View original content: