Home News Elbit Systems Reports Second Quarter 2026 Results 11 August, 2026 O****rder backlog at $32.0 billion; Revenues of $2.3 billion; GAAP net income of $173.6 million; Non-GAAP net income of $199.1 million; GAAP net EPS of $3.61; Non-GAAP net…
-
Home
-
News
-
Elbit Systems Reports Second Quarter 2026 Results
11 August, 2026
O****rder backlog at $32.0 billion; Revenues of $2.3 billion; GAAP net
income of $173.6 million; Non-GAAP net income of $199.1 million;
GAAP net EPS of $3.61; Non-GAAP net EPS of $4.14
Elbit Systems Ltd., the international high technology defense company, reported today its consolidated results for the second quarter ended June 30, 2026.
In this release, the Company is providing US-GAAP results as well as Non-GAAP financial data, which are intended to provide investors with a more comprehensive view of the Company's business results and trends. For a description of the Company's Non-GAAP definitions see page 11 below, "Non-GAAP financial data". Unless otherwise stated, all financial data presented is US-GAAP financial data.
Management Comment:
Bezhalel (Butzi) Machlis, President and CEO of Elbit Systems, stated:
“The strong momentum in the second quarter was sustained, delivering double-digit growth in sales, backlog and earnings per share, improved profitability, and strong cash flow generation. Our backlog reached a new record of $32 billion, providing long-term visibility and demonstrating the continued confidence of customers worldwide in Elbit Systems’ technologies and capabilities.
Elbit Systems continues to invest in R&D to secure our future growth. Our increased capital investments in production infrastructure reflect a disciplined approach to scaling the business, enhancing execution, increasing capacity, and supporting our ability to deliver at scale, while converting backlog into sustainable revenue and earnings growth.
Elbit Systems is leading the development of next-generation high power laser and directed energy capabilities. Most recently, we unveiled our airborne high-power laser system, currently under development for helicopters and fighter aircraft. This new capability builds on decades of technological and operational experience and will further expand Elbit Systems’ broad portfolio of systems, supporting customers and helping protect nations and critical assets around the world.”
Second quarter 2026 results:
Revenues in the second quarter of 2026 were $2,287.1 million, as compared to $1,972.7 million in the second quarter of 2025.
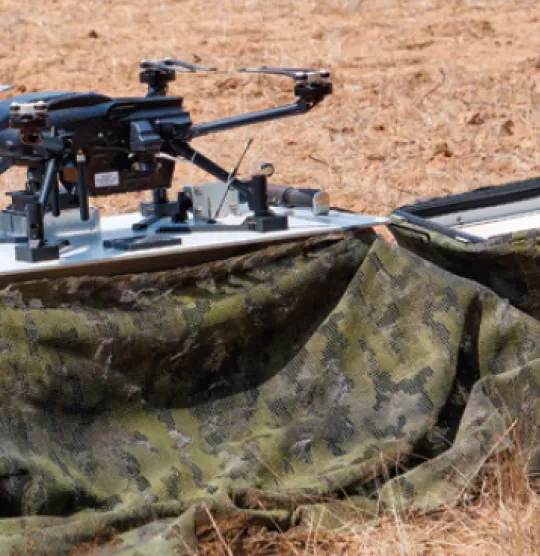
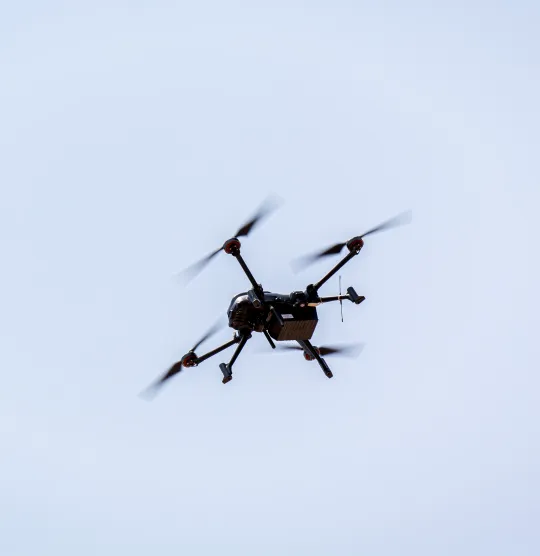
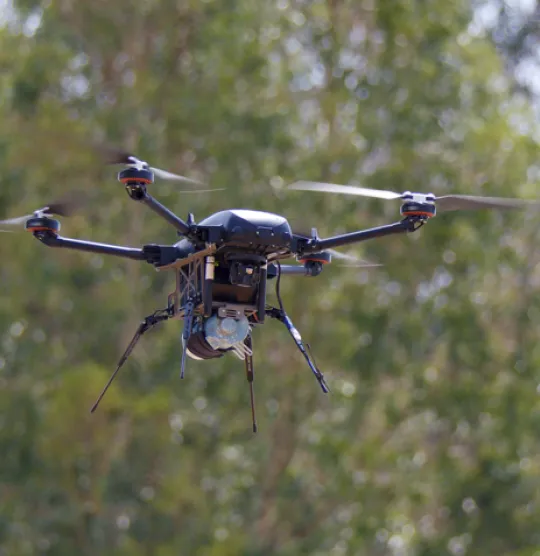
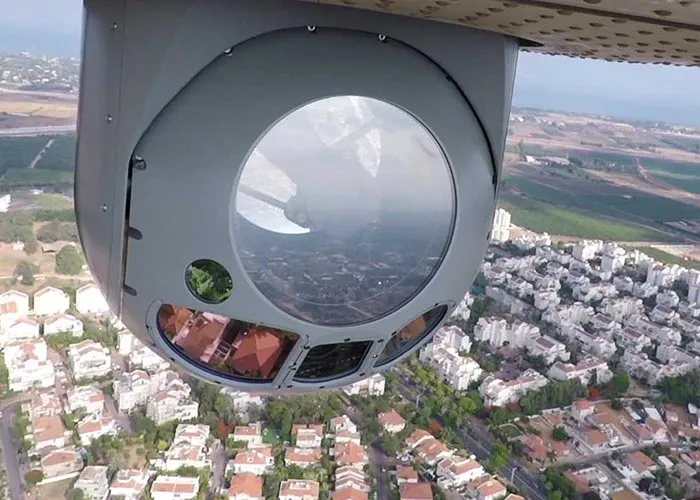
C4I and Cyber revenues increased by 11% in the second quarter of 2026, as compared to the second quarter of 2025, mainly due to the increase in radio systems and command and control systems sales in Europe. ISTAR and EW revenues increased by 22% in the second quarter of 2026, as compared to the second quarter of 2025, mainly due to increased sales of airborne and land High Power Laser, Electronic Warfare and Maritime systems in Asia-Pacific. Land revenues increased by 32% in the second quarter of 2026, as compared to the second quarter of 2025, mainly due to ammunition and munition sales in Israel. Elbit systems of America revenues increased by 17% in the second quarter of 2026, as compared to the second quarter of 2025, mainly due to a one-time favorable project mix and the increase in sales of Night-Vision Systems, Maritime systems and Electronic systems. Aerospace revenues decreased by 8% in the second quarter of 2026, as compared to the second quarter of 2025, mainly due to a one-time unfavorable project mix and decreased sales of training and simulation systems in Europe partially offset by the increase in UAV sales in Israel.
For distribution of revenues by segments and geographic regions see the tables on page 10.
GAAP gross profit in the second quarter of 2026 was $579.0 million (25.3% of revenues), as compared to $472.9 million (24.0% of revenues) in the second quarter of 2025. Non-GAAP(*) gross profit amounted to $586.5 million (25.6% of revenues) in the second quarter of 2026, as compared to $480.4 million (24.4% of revenues) in the second quarter of 2025.
Research and development expenses, net were $159.1 million (7.0% of revenues) in the second quarter of 2026, as compared to $129.7 million (6.6% of revenues) in the second quarter of 2025.
Marketing and selling expenses, net were $103.2 million (4.5% of revenues) in the second quarter of 2026, as compared to $91.5 million (4.6% of revenues) in the second quarter of 2025.
General and administrative expenses, net were $97.9 million (4.3% of revenues) in the second quarter of 2026, as compared to $93.9 million (4.8% of revenues) in the second quarter of 2025.
GAAP operating income in the second quarter of 2026 was $218.8 million (9.6% of revenues), as compared to $157.8 million (8.0% of revenues) in the second quarter of 2025. Non-GAAP(*) operating income was $237.5 million (10.4% of revenues) in the second quarter of 2026, as compared to $175.1 million (8.9% of revenues) in the second quarter of 2025.
Financial expenses, net were $22.0 million in the second quarter of 2026, as compared to $31.2 million in the second quarter of 2025. The decrease in financial expenses, net in the second quarter of 2026 was mainly due to a reduction in the average debt.
Taxes on income were $32.7 million (effective tax rate of 16.4%) in the second quarter of 2026, as compared to $7.1 million (effective tax rate of 5.6%) in the second quarter of 2025. The higher tax expense in the second quarter of 2026 was mainly driven by the implementation of the OECD Pillar II global minimum tax rules.
GAAP net incomeattributable to the Company's shareholders in the second quarter of 2026 was $173.6 million (7.6%of revenues), as compared to $125.7 million (6.4% of revenues) in the second quarter of 2025. The increase in net income attributable to the Company's shareholders in the second quarter of 2026 was in line with the increase in the Company's activity. Non-GAAP(*) net income attributable to the Company's shareholders in the second quarter of 2026 was $199.1 million (8.7% of revenues), as compared to $151.0 million (7.7% of revenues) in the second quarter of 2025.
GAAP diluted earnings per share attributable to the Company's shareholders in the second quarter of 2026 were $3.61, as compared to $2.69 in the second quarter of 2025. Non-GAAP(*) diluted net earnings per share attributable to the Company's shareholders were $4.14 for the second quarter of 2026, as compared to $3.23 for the second quarter of 2025.
The Company’s order backlog as of June 30, 2026 totaled $32.0 billion. The increase in backlog during the quarter came mainly from Europe. Approximately 73% of the current backlog is attributable to orders outside of Israel. Approximately 42% of the order backlog is scheduled to be performed during the remainder of 2026 and 2027.
Cash flow provided by operating activities in the six months ended June 30, 2026 was $517.8 million, as compared to cash flow provided by operating activities of $304.0 million in the six months ended June 30, of 2025. The cash flow in the second quarter of 2026 was affected mainly by the strong increase in net income and an increase in contract liabilities.
Impact of the recent conflicts in the Middle East on the Company:
The war which began on October 7, 2023, continued throughout most of 2025, with ceasefires agreed to between Israel and Lebanon involving the conflict with Hezbollah in November 2024, and, after an intensified period of conflict that lasted 12 days, a ceasefire was declared with Iran in June 2025. A ceasefire with Hamas was agreed to in January 2025, and a subsequent ceasefire with Hamas was agreed to in October 2025. On February 28, 2026, the U.S. and Israel launched a joint attack on Iran named “Operation Epic Fury” by the U.S., and “Operation Roaring Lion” by Israel, targeting key Iranian officials and targets. Iran launched attacks against Israel and at U.S. military bases across the region, including strikes in Bahrain, Qatar, Saudi Arabia, the United Arab Emirates, Kuwait and Jordan. On March 2, 2026 Hezbollah launched an attack on Israel. After an intensified period of conflict that lasted 40 days, a two-week ceasefire between the United States and Iran, which was subsequently extended, took effect on April 8, 2026, and a separate ten‑day cessation of hostilities between Israel and Lebanon, which was subsequently extended, began on April 16, 2026. On June 18, 2026, the U.S. and Iran signed a Memorandum of Understanding at Versailles providing for, among other things, the reopening of the Strait of Hormuz and a 60-day period for further negotiations. On June 26, 2026, a trilateral ceasefire agreement was signed between Israel, the U.S. and Lebanon. In early July 2026, the U.S.-Iran MOU collapsed following Iranian attacks on merchant ships attempting to transit the Strait of Hormuz and subsequent U.S. strikes on Iranian targets; as of the date of this filing, hostilities between the U.S. and Iran have resumed. The current situation remains uncertain, including in light of violations of the ceasefire arrangements since they began.
Since the commencement of the war and the escalation of conflicts in the Middle East, Elbit Systems has experienced a continued material increase in the demand for its products and solutions from the Israel Ministry of Defense (IMOD) compared to the demand levels prior to the war. Such increased demand may continue and could generate material additional orders to the Company.
As a result of the war and the other conflicts in the Middle East, some of Elbit Systems' operations have experienced disruptions due to supply chain and operational constraints, including among others increases in transportation costs and delays due to factors such as the Houthi movement attacks on shipping in the Red Sea, material and component shortages and elevated prices, employee call-ups for reserve duty, limitations imposed by some countries on engagement with Israel and attacks on some of Elbit Systems' global facilities by anti-Israeli organizations.
Elbit Systems has taken various steps to protect its employees worldwide, to support increased production, to increase raw material and component inventories, to mitigate supply chain disruptions and to maintain business continuity. Following the ceasefire agreements described above, these operational effects on the Company have been reduced, however, such effects on the Company’s performance could increase again, depending on future developments that are difficult to predict at this time, including the duration and scope of these conflicts and the continuity and stability of the ceasefire arrangements.
The Law for the Encouragement and Incentivization of Research and Development:
On March 31, 2026, the Knesset enacted the Law for the Encouragement and Incentivization of Research and Development 5786-2026 (the “R&D Law”). The R&D Law applies to qualifying R&D expenditures incurred at the beginning of the tax year starting January 1, 2026. The Company implemented the new R&D Law for the first time and recognized a cumulative year-to-date impact of approximately $40 million.
Recent Events:
On May 28, 2026, the Company announced that it was awarded a contract valued at approximately $350 million from an international customer to deliver upgrades for Main Battle Tanks (MBTs). The program includes the integration of advanced Fire Control Systems, Electric Gun & Turret Drive Systems, Communication and Situational Awareness solutions, as well as Mid Life Upgrade package. The contract will be performed over a period of four years.
On July 20, 2026, the Company announced that its U.S. subsidiary, Elbit Systems of America, LLC, has received multiple awards from U.S. Customs and Border Protection totaling over $370 million to enhance U.S. national security, with work to be performed through May 2029.
On August 6, 2026, the Company announced that at its Annual General Meeting of Shareholders held on August 5, 2026 at the Company's offices in Haifa, the proposed resolutions described in the Proxy Statement to the Shareholders dated July 1, 2026 were approved by the required majority.
Dividend:
The Board of Directors declared a dividend of $1.00 per share. The dividend’s record date is October 13, 2026. The dividend will be paid on October 26, 2026, after deduction of withholding tax, at the rate of 16.8%.
Conference Call:
The Company will be hosting a conference call today, Tuesday, August 11, 2026, at 9:00 a.m. Eastern Time. On the call, management will review and discuss the results and will be available to answer questions.
To participate, please call one of the teleconferencing numbers that follow. If you are unable to connect using the toll-free numbers, please try the international dial-in number.
US Dial-in Number: 1-866-744-5399
Canada Dial-in Number: 1-866-485-2399
Israel Dial-in Number: 03-918-0644
International Dial-in Number: 972-3-918-0644
at 9:00 am Eastern Time; 6:00 am Pacific Time; 4:00 pm Israel Time
The conference call will also be broadcast live on Elbit Systems’ website at https://www.elbitsystems.com
. An online replay will be available from 24 hours after the call ends.
Alternatively, for two days following the call, investors will be able to dial a replay number to listen to the call. The dial-in numbers are: 1-888-782-4291 (US and Canada) or +972-3-925-5900 (Israel and International).
ELBIT SYSTEMS LTD.
CONSOLIDATED BALANCE SHEETS
(US Dollars in thousands)
|
|
|
|
|
As of June 30, 2026 |
|
As of December 31, 2025 |
| Assets |
|
|
|
| Cash and cash equivalents |
$ 255,336 |
|
$ 635,141 |
| Short-term bank deposits |
707,599 |
|
180,604 |
| Trade and unbilled receivables and contract assets, net |
4,166,677 |
|
3,332,249 |
| Other receivables and prepaid expenses |
498,916 |
|
457,385 |
| Inventories, net |
3,236,994 |
|
3,129,756 |
| Total current assets |
8,865,522 |
|
7,735,135 |
|
|
|
|
| Investments in affiliated companies and other companies |
134,226 |
|
126,900 |
| Long-term trade and unbilled receivables and contract assets |
562,316 |
|
719,078 |
| Long-term bank deposits and other receivables |
144,861 |
|
51,601 |
| Deferred income taxes, net |
92,512 |
|
86,679 |
| Severance pay fund |
237,093 |
|
222,555 |
| Total |
1,171,008 |
|
1,206,813 |
|
|
|
|
| Operating lease right of use assets |
500,534 |
|
515,620 |
| Property, plant and equipment, net |
1,461,412 |
|
1,382,120 |
| Goodwill and other intangible assets, net |
1,860,172 |
|
1,821,830 |
| Total assets |
$ 13,858,648 |
|
$ 12,661,518 |
|
|
|
|
| Liabilities and Equity |
|
|
|
| Short-term bank credit and loans |
$ — |
|
$ 50,532 |
| Current maturities of long-term loans and Series B, C and D Notes |
87,534 |
|
83,452 |
| Operating lease liabilities |
96,959 |
|
98,464 |
| Trade payables |
1,688,040 |
|
1,511,671 |
| Other payables and accrued expenses |
1,690,200 |
|
1,549,139 |
| Contract liabilities |
2,793,121 |
|
2,683,180 |
| Total current liabilities |
6,355,854 |
|
5,976,438 |
|
|
|
|
| Long-term loans, net of current maturities |
4,592 |
|
18,000 |
| Series B, C and D Notes, net of current maturities |
175,384 |
|
237,625 |
| Employee benefit liabilities |
513,699 |
|
487,760 |
| Deferred income taxes and tax liabilities, net |
150,648 |
|
137,662 |
| Contract liabilities |
1,523,198 |
|
934,256 |
| Operating lease liabilities |
487,768 |
|
476,737 |
| Other long-term liabilities |
237,487 |
|
263,067 |
| Total long-term liabilities |
3,092,776 |
|
2,555,107 |
|
|
|
|
| Elbit Systems Ltd.'s equity |
4,409,667 |
|
4,129,598 |
| Non-controlling interests |
351 |
|
375 |
| Total equity |
4,410,018 |
|
4,129,973 |
| Total liabilities and equity |
$ 13,858,648 |
|
$ 12,661,518 |
ELBIT SYSTEMS LTD.
CONSOLIDATED STATEMENTS OF INCOME
(US Dollars in thousands, except for share and per share amounts)
|
|
|
|
|
|
|
|
|
|
|
Six months ended June 30, 2026 |
|
Six months ended June 30, 2025 |
|
Three months ended June 30, 2026 |
|
Three months ended June 30, 2025 |
|
Year ended December 31, 2025 |
| Revenues |
$ 4,475,904 |
|
$ 3,868,460 |
|
$ 2,287,058 |
|
$ 1,972,659 |
|
$ 7,938,627 |
| Cost of revenues |
3,344,838 |
|
2,941,240 |
|
1,708,051 |
|
1,499,748 |
|
6,003,374 |
| Gross profit |
1,131,066 |
|
927,220 |
|
579,007 |
|
472,911 |
|
1,935,253 |
|
|
|
|
|
|
|
|
|
|
| Operating expenses: |
|
|
|
|
|
|
|
|
|
| Research and development, net |
309,510 |
|
243,937 |
|
159,124 |
|
129,668 |
|
517,142 |
| Marketing and selling, net |
204,062 |
|
192,410 |
|
103,202 |
|
91,528 |
|
399,437 |
| General and administrative, net |
193,570 |
|
183,347 |
|
97,887 |
|
93,898 |
|
347,250 |
| Total operating expenses |
707,142 |
|
619,694 |
|
360,213 |
|
315,094 |
|
1,263,829 |
| Operating income |
423,924 |
|
307,526 |
|
218,794 |
|
157,817 |
|
671,424 |
|
|
|
|
|
|
|
|
|
|
| Financial expenses, net |
(54,234) |
|
(70,128) |
|
(22,046) |
|
(31,171) |
|
(138,618) |
| Other income (expenses), net |
3,963 |
|
3,603 |
|
2,245 |
|
(1,343) |
|
29,109 |
| Income before income taxes |
373,653 |
|
241,001 |
|
198,993 |
|
125,303 |
|
561,915 |
| Taxes on income |
(55,473) |
|
(23,118) |
|
(32,708) |
|
(7,057) |
|
(55,539) |
|
318,180 |
|
217,883 |
|
166,285 |
|
118,246 |
|
506,376 |
|
|
|
|
|
|
|
|
|
|
| Equity in net earnings of affiliated companies |
16,200 |
|
15,509 |
|
7,240 |
|
7,776 |
|
29,243 |
|
|
|
|
|
|
|
|
|
|
| Net income |
$ 334,380 |
|
$ 233,392 |
|
$ 173,525 |
|
$ 126,022 |
|
$ 535,619 |
|
|
|
|
|
|
|
|
|
|
| Less: net expense (income) attributable to non-controlling interests |
44 |
|
(608) |
|
108 |
|
(323) |
|
(1,280) |
| Net income attributable to Elbit Systems Ltd.'s shareholders |
$ 334,424 |
|
$ 232,784 |
|
$ 173,633 |
|
$ 125,699 |
|
$ 534,339 |
|
|
|
|
|
|
|
|
|
|
| Earnings per share attributable to Elbit Systems Ltd.'s shareholders: |
|
|
|
|
|
|
|
|
|
| Basic net earnings per share |
$ 7.17 |
|
$ 5.17 |
|
$ 3.71 |
|
$ 2.76 |
|
$ 11.69 |
| Diluted net earnings per share |
$ 6.95 |
|
$ 5.05 |
|
$ 3.61 |
|
$ 2.69 |
|
$ 11.39 |
|
|
|
|
|
|
|
|
|
|
| Weighted average number of shares used in computation of: |
|
|
|
|
|
|
|
|
|
| Basic earnings per share (in thousands) |
46,622 |
|
45,052 |
|
46,766 |
|
45,513 |
|
45,710 |
| Diluted earnings per share (in thousands) |
48,124 |
|
46,122 |
|
48,124 |
|
46,697 |
|
46,918 |
ELBIT SYSTEMS LTD.
CONSOLIDATED STATEMENTS OF CASH FLOW
(US Dollars in thousands)
|
|
|
|
|
|
|
Six months ended June 30, 2026 |
|
Six months ended June 30, 2025 |
|
Year ended December 31, 2025 |
| CASH FLOWS FROM OPERATING ACTIVITIES |
|
|
|
|
|
| Net income |
$ 334,380 |
|
$ 233,392 |
|
$ 535,619 |
| Adjustments to reconcile net income to net cash provided by operating activities: |
|
|
|
|
|
| Depreciation and amortization |
93,532 |
|
85,255 |
|
171,434 |
| Stock-based compensation |
14,567 |
|
11,496 |
|
26,391 |
| Amortization of Series B, C and D related issuance costs, net |
173 |
|
393 |
|
394 |
| Deferred income taxes and reserve, net |
(1,856) |
|
(14,751) |
|
(14,687) |
| Loss on sale of property, plant and equipment |
1,354 |
|
1,727 |
|
2,893 |
| Loss (gain) on sale of investment, remeasurement of investment held under fair value method |
— |
|
6,954 |
|
(4,518) |
| Equity in net earnings of affiliated companies, net of dividend received(*) |
(6,570) |
|
(6,608) |
|
(10,190) |
| Changes in operating assets and liabilities, net of amounts acquired: |
|
|
|
|
|
| Increase in trade and unbilled receivables and prepaid expenses |
(813,298) |
|
(358,217) |
|
(659,951) |
| Increase in inventories, net |
(107,042) |
|
(171,708) |
|
(357,926) |
| Increase in trade payables, other payables and accrued expenses |
312,916 |
|
348,910 |
|
463,913 |
| Severance, pension and termination indemnities, net |
(9,170) |
|
(9,598) |
|
(26,328) |
| Increase in contract liabilities |
698,796 |
|
176,725 |
|
651,334 |
| Net cash provided by operating activities |
517,782 |
|
303,970 |
|
778,378 |
| CASH FLOWS FROM INVESTING ACTIVITIES |
|
|
|
|
|
| Purchase of property, plant and equipment and other assets, net of investment grants and evacuation grants |
(157,557) |
|
(72,474) |
|
(225,568) |
| Acquisition of subsidiaries, net of cash assumed |
(33,738) |
|
— |
|
— |
| Investments in affiliated companies and other companies, net |
(1,917) |
|
(100) |
|
(2,288) |
| Proceeds from sale of property, plant and equipment |
1,288 |
|
458 |
|
1,133 |
| Proceeds from sale of investments |
2,100 |
|
— |
|
15,000 |
| Proceeds from sale of (investment in) long-term deposits, net |
941 |
|
159 |
|
(31) |
| Investment in short-term deposits, net |
(502,601) |
|
(738,401) |
|
(178,962) |
| Net cash used in investing activities |
(691,484) |
|
(810,358) |
|
(390,716) |
| CASH FLOWS FROM FINANCING ACTIVITIES |
|
|
|
|
|
| Proceeds from issuance of shares and exercise of options |
136 |
|
573,000 |
|
573,064 |
| Repayment of commercial paper |
(48,409) |
|
(95,036) |
|
(301,591) |
| Repayment of long-term bank loans |
(12,905) |
|
(11,355) |
|
(11,423) |
| Proceeds from non-controlling interests, net |
15,749 |
|
— |
|
— |
| Repayment of Series B, C and D Notes |
(74,967) |
|
(67,738) |
|
(67,496) |
| Dividends paid |
(81,771) |
|
(49,103) |
|
(111,693) |
| Change in short-term bank credit and loans and other, net |
(3,936) |
|
381 |
|
(98,733) |
| Net cash provided by (used in) financing activities |
(206,103) |
|
350,149 |
|
(17,872) |
|
|
|
|
|
|
| Net increase (decrease) in cash and cash equivalents |
(379,805) |
|
(156,239) |
|
369,790 |
| CASH AND CASH EQUIVALENTS AT THE BEGINNING OF THE PERIOD |
$ 635,141 |
|
$ 265,351 |
|
$ 265,351 |
| CASH AND CASH EQUIVALENTS AT THE END OF THE PERIOD |
$ 255,336 |
|
$ 109,112 |
|
$ 635,141 |
| (*) Dividend received from affiliated companies |
$ 9,630 |
|
$ 8,901 |
|
$ 19,053 |
ELBIT SYSTEMS LTD.
DISTRIBUTION OF REVENUES
(US Dollars in millions)
Consolidated revenues by geographical regions:
|
|
|
|
|
|
|
|
|
|
|
|
|
|
|
|
|
|
|
|
|
Six months ended June 30, 2026 |
|
% |
|
Six months ended June 30, 2025 |
|
% |
|
Three months ended June 30, 2026 |
|
% |
|
Three months ended June 30, 2025 |
|
% |
|
Year ended December 31, 2025 |
|
% |
| Israel |
$ 1,672.9 |
|
37.4 |
|
$ 1,279.6 |
|
33.1 |
|
$ 855.0 |
|
37.4 |
|
$ 670.5 |
|
34.0 |
|
$ 2,556.4 |
|
32.2 |
| North America |
898.4 |
|
20.1 |
|
797.8 |
|
20.6 |
|
464.7 |
|
20.3 |
|
404.6 |
|
20.5 |
|
1,659.3 |
|
20.9 |
| Europe |
1,075.6 |
|
24.0 |
|
1,020.6 |
|
26.4 |
|
563.3 |
|
24.6 |
|
563.8 |
|
28.6 |
|
2,139.5 |
|
27.0 |
| Asia-Pacific |
661.7 |
|
14.8 |
|
605.1 |
|
15.6 |
|
319.9 |
|
14.0 |
|
261.9 |
|
13.3 |
|
1,243.7 |
|
15.7 |
| Latin America |
70.2 |
|
1.6 |
|
50.7 |
|
1.3 |
|
37.2 |
|
1.6 |
|
22.6 |
|
1.1 |
|
99.0 |
|
1.2 |
| Other countries |
97.1 |
|
2.1 |
|
114.7 |
|
3.0 |
|
47.0 |
|
2.1 |
|
49.3 |
|
2.5 |
|
240.7 |
|
3.0 |
| Total revenue |
$ 4,475.9 |
|
100.0 |
|
$ 3,868.5 |
|
100.0 |
|
$ 2,287.1 |
|
100.0 |
|
$ 1,972.7 |
|
100.0 |
|
$ 7,938.6 |
|
100.0 |
Consolidated revenues by segments:
|
|
|
|
|
|
|
|
|
|
|
Six months ended June 30, 2026 |
|
Six months ended June 30, 2025 |
|
Three months ended June 30, 2026 |
|
Three months ended June 30, 2025 |
|
Year ended December 31, 2025 |
| Aerospace |
|
|
|
|
|
|
|
|
|
| External customers |
$ 877.5 |
|
$ 922.2 |
|
$ 422.7 |
|
$ 474.2 |
|
$ 1,820.9 |
| Intersegment revenue |
134.1 |
|
118.9 |
|
72.3 |
|
62.6 |
|
246.1 |
| Total |
1,011.6 |
|
1,041.1 |
|
495.0 |
|
536.8 |
|
2,067.0 |
| C4I and Cyber |
|
|
|
|
|
|
|
|
|
| External customers |
483.2 |
|
417.2 |
|
241.1 |
|
213.0 |
|
866.2 |
| Intersegment revenue |
26.4 |
|
29.6 |
|
11.8 |
|
13.8 |
|
64.7 |
| Total |
509.6 |
|
446.8 |
|
252.9 |
|
226.8 |
|
930.9 |
| ISTAR and EW |
|
|
|
|
|
|
|
|
|
| External customers |
773.9 |
|
614.6 |
|
$ 402.1 |
|
311.1 |
|
1,323.5 |
| Intersegment revenue |
96.9 |
|
113.9 |
|
45.7 |
|
56.4 |
|
202.3 |
| Total |
870.8 |
|
728.5 |
|
447.8 |
|
367.5 |
|
1,525.8 |
| Land |
|
|
|
|
|
|
|
|
|
| External customers |
1,448.5 |
|
1,106.0 |
|
749.5 |
|
566.8 |
|
2,250.3 |
| Intersegment revenue |
36.4 |
|
37.9 |
|
20.7 |
|
16.3 |
|
68.4 |
| Total |
1,484.9 |
|
1,143.9 |
|
770.2 |
|
583.1 |
|
2,318.7 |
| ESA |
|
|
|
|
|
|
|
|
|
| External customers |
892.8 |
|
808.5 |
|
471.7 |
|
407.6 |
|
1,677.7 |
| Intersegment revenue |
7.9 |
|
4.9 |
|
5.1 |
|
1.6 |
|
16.4 |
| Total |
900.7 |
|
813.4 |
|
476.8 |
|
409.2 |
|
1,694.1 |
| Revenues |
|
|
|
|
|
|
|
|
|
| Total revenues (external customers and intersegment) for reportable segments |
4,777.6 |
|
4,173.7 |
|
2,442.7 |
|
2,123.4 |
|
8,536.5 |
| Less - intersegment revenue |
(301.7) |
|
(305.2) |
|
(155.6) |
|
(150.7) |
|
(597.9) |
| Total revenues |
$ 4,475.9 |
|
$ 3,868.5 |
|
$ 2,287.1 |
|
$ 1,972.7 |
|
$ 7,938.6 |
Non-GAAP financial data:
The following Non-GAAP financial data, including Non-GAAP gross profit, Non-GAAP operating income, Non-GAAP net income attributable to the Company's shareholders, and Adjusted diluted earnings per share, is presented to enable investors to have additional information on our business performance as well as a further basis for periodical comparisons and trends relating to our financial results. We believe such data provides useful information to investors and analysts by facilitating more meaningful comparisons of our financial results over time. The Non-GAAP adjustments exclude amortization expenses of intangible assets related to acquisitions that occurred mainly in prior periods, capital gains related primarily to the sale of investments, restructuring activities, Non-identified costs in respect to special circumstances, non-cash stock based compensation expenses, revaluations of investments in affiliated companies, non-operating foreign exchange gains or losses, one-time tax expenses, and the effect of tax on each of these items. We present these Non-GAAP financial measures because management believes they supplement and/or enhance management’s, analysts’ and investors’ overall understanding of the Company’s underlying financial performance and trends and facilitate comparisons among current, past, and future periods.
Specifically, management uses Non-GAAP gross profit, Non-GAAP operating income, and Non-GAAP net income attributable to the Company’s shareholders to measure the ongoing gross profit, operating profit and net income performance of the Company because the measure adjusts for more significant non-recurring items, amortization expenses of intangible assets relating to prior acquisitions, and non-cash expense which can fluctuate year to year.
We believe Non-GAAP gross profit, Non-GAAP operating income, and Non-GAAP net income attributable to the Company’s shareholders are useful to existing shareholders, potential shareholders and other users of our financial information because they provide measures of the Company’s ongoing performance that enable these users to perform trend analysis using comparable data.
Management uses Non-GAAP diluted net earnings per share attributed to Company's shareholders to evaluate further adjusted net income attributable to the Company’s shareholders while considering changes in the number of diluted shares over comparable periods.
We believe Non-GAAP diluted net earnings per share attributable to Company's shareholders is useful to existing shareholders, potential shareholders and other users of our financial information because it also enables these users to evaluate adjusted net income attributable to Company’s shareholders on a per-share basis.
The Non-GAAP measures used by the Company are not based on any comprehensive set of accounting rules or principles. We believe that Non-GAAP measures have limitations in that they do not reflect all of the amounts associated with our results of operations, as determined in accordance with GAAP, and that these measures should only be used to evaluate our results of operations in conjunction with the corresponding GAAP measures.
Investors are cautioned that, unlike financial measures prepared in accordance with GAAP, Non-GAAP measures may not be comparable with the calculation of similar measures for other companies. They should consider Non-GAAP financial measures in addition to, and not as replacements for or superior to, measures of financial performance prepared in accordance with GAAP.
Reconciliation of GAAP to Non-GAAP Supplemental Financial Data:
(US Dollars in millions, except for per share amounts)
|
|
|
|
|
|
|
|
|
|
|
Six months ended June 30, 2026 |
|
Six months ended June 30, 2025 |
|
Three months ended June 30, 2026 |
|
Three months ended June 30, 2025 |
|
Year ended December 31, 2025 |
| GAAP gross profit |
$ 1,131.1 |
|
$ 927.2 |
|
$ 579.0 |
|
$ 472.9 |
|
$ 1,935.3 |
| Adjustments: |
|
|
|
|
|
|
|
|
|
| Amortization of purchased intangible assets(*) |
7.8 |
|
8.0 |
|
3.9 |
|
4.0 |
|
16.2 |
| Stock based compensation |
2.2 |
|
1.7 |
|
1.2 |
|
0.9 |
|
4.0 |
| Non-identified costs in respect to special circumstances |
4.1 |
|
4.0 |
|
2.4 |
|
2.6 |
|
6.3 |
| Non-GAAP gross profit |
$ 1,145.2 |
|
$ 940.9 |
|
$ 586.5 |
|
$ 480.4 |
|
$ 1,961.8 |
| Percent of revenues |
25.6 % |
|
24.3 % |
|
25.6 % |
|
24.4 % |
|
24.7 % |
|
|
|
|
|
|
|
|
|
|
| GAAP operating income |
$ 423.9 |
|
$ 307.5 |
|
$ 218.8 |
|
$ 157.8 |
|
$ 671.4 |
| Adjustments: |
|
|
|
|
|
|
|
|
|
| Amortization of purchased intangible assets(*) |
15.1 |
|
15.5 |
|
7.6 |
|
7.7 |
|
31.0 |
| Stock based compensation |
14.6 |
|
11.5 |
|
7.7 |
|
5.8 |
|
26.4 |
| Non-identified costs in respect to special circumstances |
5.9 |
|
5.8 |
|
3.4 |
|
3.8 |
|
9.0 |
| Non-GAAP operating income |
$ 459.5 |
|
$ 340.3 |
|
$ 237.5 |
|
$ 175.1 |
|
$ 737.8 |
| Percent of revenues |
10.3 % |
|
8.8 % |
|
10.4 % |
|
8.9 % |
|
9.3 % |
|
|
|
|
|
|
|
|
|
|
| GAAP net income attributable to Elbit Systems’ shareholders |
334.4 |
|
232.8 |
|
173.6 |
|
125.7 |
|
534.3 |
| Adjustments: |
|
|
|
|
|
|
|
|
|
| Amortization of purchased intangible assets(*) |
15.1 |
|
15.5 |
|
7.6 |
|
7.7 |
|
31.0 |
| Stock based compensation |
14.6 |
|
11.5 |
|
7.7 |
|
5.8 |
|
26.4 |
| Non-identified costs in respect to special circumstances |
5.9 |
|
5.8 |
|
3.4 |
|
3.8 |
|
9.0 |
| Capital gain |
— |
|
— |
|
— |
|
— |
|
(13.7) |
| Revaluation of investment measured under fair value option |
— |
|
6.8 |
|
— |
|
6.8 |
|
(4.5) |
| Non-operating foreign exchange (gains) losses |
7.4 |
|
(1.5) |
|
(1.3) |
|
2.6 |
|
18.5 |
| Tax effect and other tax items, net |
8.2 |
|
(2.7) |
|
8.1 |
|
(1.4) |
|
(3.0) |
| Non-GAAP net income attributable to Elbit Systems' shareholders |
$ 385.6 |
|
$ 268.2 |
|
$ 199.1 |
|
$ 151.0 |
|
$ 598.0 |
| Percent of revenues |
8.6 % |
|
6.9 % |
|
8.7 % |
|
7.7 % |
|
7.5 % |
|
|
|
|
|
|
|
|
|
|
| GAAP diluted net EPS attributable to Elbit Systems' shareholders |
$ 6.95 |
|
$ 5.05 |
|
$ 3.61 |
|
$ 2.69 |
|
$ 11.39 |
| Adjustments, net |
1.06 |
|
0.76 |
|
0.53 |
|
0.54 |
|
1.36 |
| Non-GAAP diluted net EPS attributable to Elbit Systems' shareholders |
$ 8.01 |
|
$ 5.81 |
|
$ 4.14 |
|
$ 3.23 |
|
$ 12.75 |
(*) While amortization of acquired intangible assets is excluded from the measures, the revenue of the acquired companies is reflected in the measures and the acquired assets contribute to revenue generation.
View All News
About Elbit Systems
Elbit Systems is a leading global defense technology company, delivering advanced solutions for a secure and safer world. Elbit Systems develops, manufactures, integrates and sustains a range of next-generation solutions across multiple domains.
Driven by its agile, collaborative culture, and leveraging Israel’s technology ecosystem, Elbit Systems enables customers to address rapidly evolving battlefield challenges and overcome threats.
Elbit Systems employs over 21,000 people in dozens of countries across five continents. The Company reported $2,287.1 million in revenues for the three months ended June 30, 2026 and an order backlog of $32.0 billion as of such date.
For additional information, visit: https://elbitsystems.com
, follow us on X
or visit our official Facebook
, Youtube
and LinkedIn
Channels.
Company Contact:
Dr. Yaacov (Kobi) Kagan, ExecutiveVP – CFO
Tel: +972-77-2946663
[email protected]
Daniella L. Finn, VP Investor Relations
Tel: +972-77-2948984
[email protected]
Dalia Bodinger, VP, Communication & Brand
Tel: 972-77-2947602
[email protected]