March 12, 2026 at 7:00 AM EDT PDF Version PBGENE-HBV Phase 1 data featured Late Breaker presentation at AASLD, The Liver Meeting, showing safety, tolerability and cumulative, dose-dependent antiviral activity - Strong Phase 1 ELIMINATE-B trial…
March 12, 2026 at 7:00 AM EDT
PDF Version
-
PBGENE-HBV Phase 1 data featured Late Breaker presentation at AASLD, The Liver Meeting, showing safety, tolerability and cumulative, dose-dependent antiviral activity -
-
Strong Phase 1 ELIMINATE-B trial execution for PBGENE-HBV with 13 patients now dosed across first 5 cohorts; Data updates expected at medical conferences throughout 2026 -
-
Received IND Clearance for PBGENE-DMD enabling IRB and site activation for Phase 1/2 FUNCTION-DMD trial; Data from multiple patients expected by year-end 2026 -
-
Raised $75 Million in November 2025 extending expected cash runway through multiple clinical inflection points between 2026 and the end of 2028 -
DURHAM, N.C.--(BUSINESS WIRE)--Mar. 12, 2026-- Precision BioSciences, Inc. (Nasdaq: DTIL), a clinical stage gene editing company utilizing its novel proprietary ARCUS® platform to develop in vivo gene editing therapies for high unmet need diseases, today announced financial results for the fourth quarter and fiscal year ended December 31, 2025, and provided a business update.
“2025 was an exceptional year for Precision BioSciences marked by meaningful clinical and financial progress. We delivered on what we committed to achieve and more in 2025 positioning Precision BioSciences for success in 2026 and beyond,” said Michael Amoroso, Chief Executive Officer**.** “The evidence supporting the clinical utility of ARCUS for in vivo gene editing continues to mount in diseases with high unmet need led by advancement of PBGENE-HBV through multiple cohorts in our ELIMINATE-B study for chronic hepatitis B. At The Liver Meeting® 2025, we presented late-breaking clinical data showing safety and cumulative, dose-dependent antiviral activity along with paired biopsy findings that provide the first molecular evidence consistent with viral DNA gene editing in patients. In another first, our partner iECURE achieved a complete response in the first infant with neonatal onset OTC deficiency following treatment with ECUR-506 which utilizes an ARCUS nuclease developed by Precision for in vivo gene insertion.”
“Additionally, our team completed all Investigational New Drug (IND) enabling activities for PBGENE-DMD and filed an IND application by the end of 2025 after announcing prioritization of the program in May 2025. This paved the way for the IND clearance in early 2026 and allowed us to begin the IRB process to activate clinical trial sites,” continued Mr. Amoroso. “Finally, we strengthened our financial position by extending our expected cash runway through 2028 and entered 2026 focused on achieving multiple potential clinical value-inflection points for PBGENE-HBV and PBGENE-DMD this year.”
Wholly Owned Portfolio:
PBGENE-HBV (Hepatitis B Viral Elimination Program)
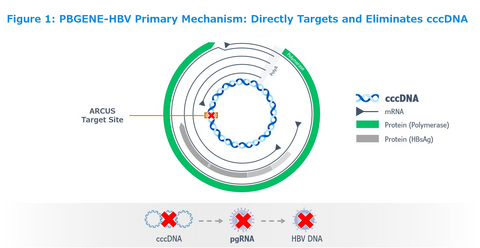
PBGENE-HBV is Precision’s wholly owned in vivo gene editing program under investigation in a global first-in-human clinical trial, which is designed to be a potentially curative treatment for chronic Hepatitis B infection. In patients with chronic hepatitis B, cccDNA acts as the template to make new infectious viral particles. PBGENE-HBV is the only clinical stage program that targets the elimination of cccDNA, the sole source of viral replication, leading to sustained loss of HBV DNA and other downstream viral transcripts.
On November 10, 2025, the Company reported late-breaking Phase 1 data at AASLD The Liver Meeting® 2025 from the first three ELIMINATE-B cohorts, including nine patients across 22 total doses, demonstrating safety and tolerability across repeat administrations (at doses of 0.2 mg/kg, 0.4 mg/kg, and 0.8 mg/kg at eight week intervals) with no dose-limiting toxicities reported, and evidence of cumulative, dose-dependent antiviral activity and HBsAg declines. The presentation featured substantial viral marker reductions and paired biopsy data providing first evidence consistent with direct viral DNA gene editing.
As part of the ongoing assessment of the safety and efficacy profile of PBGENE-HBV after repeat doses in Part 1 dose finding, Precision has administered additional doses in Cohort 3 and in parallel commenced pre-planned additional cohorts to investigate a shorter dosing interval. Cohort 4 is investigating dosing at 0.4 mg/kg every 4 weeks and Cohort 5 is investigating dosing at 0.65 mg/kg every 4 weeks to evaluate the potential for an optimized therapeutic index. In addition, to mitigate acute infusion reactions common to lipid nanoparticle (LNP) delivered therapies, such as transient hypotension and transient elevated liver enzymes, Precision continues to investigate prophylactic measures per protocol. These measures include intravenous (IV) fluids, steroids, antihistamines, and infusion duration across dose levels and administrations. The goal during Part 1 of the study is to select the dose and schedule that achieves the desired therapeutic index to move to the expansion phase of the ELIMINATE-B trial.
PBGENE-HBV is the first in vivo gene editing approach to prospectively employ repeat administrations of LNP. To date, 13 participants have completed more than 30 administrations of PBGENE-HBV across five cohorts. Looking ahead, Precision expects additional clinical biomarker and biopsy data in the first half of 2026 and expects to have completed dosing in Cohorts 3, 4, and 5. This will inform selection of an optimal dosing regimen intended to support discontinuation of nucleos(t)ide analog treatment and progression into the Part 2 expansion phase of ELIMINATE-B. Precision expects to share further clinical data from the PBGENE-HBV program at hepatitis-focused medical conferences throughout 2026.
PBGENE-DMD (Muscle Targeted Gene Excision Program)
PBGENE-DMD is Precision’s development program for the treatment of Duchenne muscular dystrophy (DMD). In February 2026, Precision announced that it had received IND clearance from the U.S. Food and Drug Administration (FDA) to advance PBGENE-DMD. IND clearance enables Precision to initiate Institutional Review Board (IRB) activities and clinical trial site activation for the FUNCTION-DMD Phase 1/2 clinical trial for PBGENE-DMD. The FUNCTION-DMD trial will include ambulatory DMD patients at highly specialized U.S clinical trial sites. Initial data from multiple patients is expected by year-end 2026, including safety and early efficacy assessment based on near full-length dystrophin protein expression from muscle biopsies.
PBGENE-DMD received Fast Track designation from the FDA on February 26, 2026. Fast Track designation is designed to facilitate development and expedite the review of drugs that are intended to treat serious or life-threatening conditions and address an unmet medical need. A drug that has received Fast Track designation may be eligible for more frequent meetings and communications with the FDA and rolling review of any application for marketing approval. A drug receiving Fast Track designation may also be eligible for Priority Review if relevant criteria are met. In July 2025, PBGENE-DMD was granted Orphan Drug Designation from the FDA for the treatment of Duchenne muscular dystrophy.
New preclinical study data supporting the potential long-term efficacy of PBGENE-DMD was presented in a poster session at the Muscular Dystrophy Association Clinical & Scientific Conference 2026 on March 9, 2026.
On March 17th, the Company will host a KOL eventfeaturing Aravindhan Veerapandiyan, MD (Pediatric Neurologist and Associate Professor of Pediatrics, University of Arkansas for Medical Sciences and Arkansas Children’s Hospital), and Pat Furlong (Founding President, Parent Project Muscular Dystrophy), who will join company management to discuss the unmet need and current treatment landscape for DMD. The event will provide an overview of PBGENE-DMD and FUNCTION-DMD Phase 1/2 clinical trial.
Partnered In Vivo Gene Editing Programs:
iECURE-OTC (Gene Insertion Program)
Led by iECURE, ECUR-506 is an ARCUS-mediated in vivo gene editing program currently in a first-in-human Phase 1/2 trial (OTC-HOPE) evaluating ECUR-506 as a potential treatment for neonatal onset ornithine transcarbamylase (OTC) deficiency. Recently announced alignment with the FDA on key study elements could support a potential Biologics License Application (BLA). In addition, ECUR-506 was granted FDA Regenerative Medicine Advanced Therapy (RMAT) designation. The OTC-HOPE study is ongoing in the U.K., the U.S., Australia, and Spain. In January 2025, iECURE reported clinical results demonstrating complete clinical response in the first participant at the lowest dose level (1.3x10¹³ GC/kg) of ECUR-506, as defined by the study protocol. iECURE expects to release additional data from the ongoing OTC-HOPE clinical trial in the first half of 2026.
PBGENE-NVS (Gene Insertion Program)
As previously reported in October 2025, Novartis and Precision have concluded their work in the area of hemoglobinopathies. Precision and Novartis are continuing their research collaboration in other areas of undisclosed therapeutic focus.
Non-Core Ex Vivo Programs:
Azer-Cel (Azercabtagene Zapreleucel Allogeneic CAR T Treatment or Cancer)
Imugene Limited continues development of Azer-Cel in diffuse large B-cell lymphoma and has received written guidance from the FDA regarding the registrational pathway for azer-cel. The guidance provided clear alignment with the FDA across key elements required to support advancement into a pivotal study, including dosing regimen, patient population, endpoints, and manufacturing readiness. In October 2025, Precision received an $8 million milestone payment consisting of $3 million in cash and $5 million in Imugene ordinary shares related to Imugene’s clinical and regulatory progress.
Azer-Cel (Azercabtagene Zapreleucel Allogeneic CAR T Treatment for Multiple Sclerosis)
Separately, Azer-Cel is being evaluated by TG Therapeutics, Inc. (Nasdaq: TGTX) in a Phase 1 trial in progressive multiple sclerosis. In March 2026, Precision announced the achievement of a clinical milestone under its license agreement with TG Therapeutics. As a result, Precision has earned a cash payment of $7.5 million in proceeds, inclusive of $5.25 million cash and $2.25 million for the purchase of 201,504 shares of Precision common stock by TG Therapeutics at $11.17 per share. Anticipated 2026 events includepresentation of preliminary Phase 1 azer-cel data in progressive multiple sclerosis in the second half of 2026 and commencement of additional exploratory studies in autoimmune diseases outside of multiple sclerosis.
Corporate Updates:
$75 Million Financing
In November 2025, the Company announced a $75 million underwritten offering of 10,815,000 shares of its common stock with accompanying warrants, and, for certain investors, pre-funded warrants with accompanying warrants. The financing included participation from new and existing investors including Aberdeen Investments, Bleichroeder LP, Driehaus Capital Management, Empery Asset Management LP, Lynx1 Capital Management, Octagon Capital, Readout Capital, Sphera Funds Management, Stonepine Capital Management, as well as other leading life science investors.
New Intellectual Property Notices
In March 2026, Precision reported that it received two Notices of Allowance from the U.S. Patent and Trademark Office relating to the Company’s PBGENE-HBV program which extend the patent expiration date to November 2044 once issued. The first Notice of Allowance was for U.S. Patent Application No. 19/347,136, titled “Engineered meganucleases having specificity for a recognition sequence in the Hepatitis B virus genome.” The second Notice of Allowance was for U.S. Patent Application No. 19/273,982, titled “Polypeptide linkers for use in engineered meganucleases.”
Quarter Ended December 31, 2025 Financial Results:
**Cash, Cash Equivalents, and Restricted Cash:**As of December 31, 2025, Precision had approximately $137.2 million in cash, cash equivalents, and restricted cash. The Company expects that existing cash and cash equivalents, inclusive of the expected azer-cel milestone proceeds, continued fiscal and operating discipline, and availability of the Company’s at-the-market facility will fund the Company’s cash runway through 2028. Based on its expected cash runway, Precision believes it is sufficiently capitalized to achieve PBGENE-HBV and PBGENE-DMD data milestones through 2028.
**Revenues:**Total revenues for the quarter ended December 31, 2025, were $34.2 million, as compared to $0.6 million for the quarter ended December 31, 2024. The increase of $33.6 million in revenue during the quarter ended December 31, 2025 was primarily the result of recognizing $26.2 million in revenue under the Novartis agreement following conclusion of the hemoglobinopathy collaboration in October 2025 and recognition of $8.0 million in revenue under the Imugene license agreement.
**Research and Development Expenses:**Research and development expenses were $14.5 million for the quarter ended December 31, 2025, as compared to $15.9 million for the quarter ended December 31, 2024. The decrease of $1.4 million was primarily due to decreases in the PBGENE-HBV program preclinical costs as the program entered the clinic in the fourth quarter of 2024 and decreases in PBGENE-3243 program costs as Precision pivoted to PBGENE-DMD in the first half of 2025. These decreases were partially offset by increases in the PBGENE-DMD program as it prepared to enter the clinic in 2026.
**General and Administrative Expenses:**General and administrative expenses were $7.2 million for the quarter ended December 31, 2025, as compared to $9.6 million for the quarter ended December 31, 2024. The decrease of $2.4 million was primarily a result of operational discipline and lower employee-related costs.
**Other Income (Expense):**Total other income for the quarter ended December 31, 2025 was $6.7 million, as compared to $7.1 million for the quarter ended December 31, 2024.
Net Income (Loss) from Continuing Operations: Net income from continuing operations was $19.2 million for the quarter ended December 31, 2025, as compared to a net loss of ($17.8) million for the quarter ended December 31, 2024.
**Net Income (Loss):**Net income was $20.1 million, or $1.06 per share basic and $1.05 per share diluted for the quarter ended December 31, 2025. Net loss was $17.8 million, or $(2.22) per share (basic and diluted) for the quarter ended December 31, 2024.
Fiscal Year 2025 Financial Results:
**Revenues:**Total revenues for the year ended December 31, 2025 were $34.3 million, as compared to $68.7 million for the year ended December 31, 2024. The decrease of $34.4 million in revenue during the year ended December 31, 2025 was primarily the result of revenue recognized in the year ended December 31, 2024 related to the conclusion of our agreement with Prevail Therapeutics and revenue recognized under the TG License Agreement.
**Research and Development Expenses:**Research and development expenses were $54.2 million for the year ended December 31, 2025, as compared to $59.6 million for the year ended December 31, 2024. The decrease of $5.4 million was primarily due to decreases in the PBGENE-HBV and PBGENE-3243 programs and platform development and early-stage research expenses, partially offset by increases in our PBGENE-DMD program.
**General and Administrative Expenses:**General and administrative expenses were $32.2 million for the year ended December 31, 2025, as compared to $35.3 million for the year ended December 31, 2024. The decrease of $3.1 million was primarily a result of operational discipline and lower employee-related costs.
Other Income (Expense): Total other income was $5.5 million for the year ended December 31, 2025, as compared to $33.3 million for the year ended December 31, 2024. The decrease of $27.8 million was primarily due to a decrease in gain in fair value of the warrant liability, losses from equity method investment and other fair value adjustments which did not impact cash, and a decrease in interest income.
Net (Loss) Income from Continuing Operations: Net loss from continuing operations was ($46.6) million for the year ended December 31, 2025, as compared to a net income from continuing operations of $7.2 million for the year ended December 31, 2024 primarily driven by the final year of revenue recognition from Prevail.
**Net (Loss) Income:**Net loss was ($45.7) million, or ($3.56) per share (basic and diluted) for the year ended December 31, 2025. Net income was $7.2 million, or $1.05 per share basic and $1.04 share diluted for the year ended December 31, 2024 primarily driven by the final year of revenue recognition from Prevail.
**Shares:**Basic and diluted weighted-average common shares outstanding for the year ended December 31, 2025 were 12,826,078, compared to 6,832,982 basic shares and 6,883,911 diluted shares for the year ended December 31, 2024. Precision BioSciences had 24,088,425 shares outstanding as of December 31, 2025.
About Chronic Hepatitis B
Chronic hepatitis B virus causes inflammation and damage to the liver, leading to chronic infection and increased risk of death from liver cancer or cirrhosis. There is no cure for chronic hepatitis B, and current treatments rarely result in a functional cure, primarily due to persistence of viral DNA in the liver. In patients with chronic hepatitis B, genetic material of the virus is converted within infected liver cells into cccDNA that acts as the only template to make new infectious viral particles. Hepatitis B virus also inserts fragments of its DNA into the human genome of infected liver cells. These integrated fragments are viral replication incompetent and cannot produce new infectious virus. Both cccDNA and integrated HBV DNA produce the viral protein, hepatitis B surface antigen (“HBsAg”), which is secreted in the blood.
Historically, the focus for drug development and regulatory approval of drugs for chronic hepatitis B has relied on the temporary suppression of HBsAg. Achieving undetectable HBsAg may lead to a functional cure if there is no rebound in HBV DNA or HBsAg after drug treatment has been discontinued for at least six months, but this is achieved in less than three out of 100 patients treated with the current standard of care. Since cccDNA is the only source of infectious particles (HBV DNA), elimination of cccDNA results in a cure of chronic hepatitis B. Sustained loss of HBV DNA alone as a result of cccDNA elimination is an approvable endpoint for the FDA and highly relevant for PBGENE-HBV.
About PBGENE-HBV, A Viral Elimination Program
PBGENE-HBV is Precision’s wholly owned in vivo gene editing program under investigation in a global first-in-human clinical trial, which is designed to be a potentially curative treatment for chronic Hepatitis B infection. PBGENE-HBV is the first and only potentially curative gene editing program to enter the clinic that is specifically designed to eliminate the root cause of chronic Hepatitis B, cccDNA, while inactivating integrated HBV DNA. Elimination of cccDNA results in HBV cure as cccDNA is the only source of infectious replication (HBV DNA). The ELIMINATE-B trial is investigating PBGENE-HBV at multiple dose levels across a number of administrations per dose level in patients with chronic Hepatitis B. PBGENE-HBV has been granted Fast Track designation by the FDA.
PBGENE-HBV is the only clinical stage program targeting the elimination of cccDNA leading to sustained loss of HBV DNA. The FDA has previously provided guidance that sustained loss of HBV DNA is an approvable endpoint for chronic hepatitis B.
Further details on the trial can be found on Precision’s website and on clinicaltrials.gov identifier NCT06680232.
About PBGENE-DMD, A Muscle-Targeted Excision Program
PBGENE-DMD is Precision’s development program for the treatment of DMD. DMD is a genetic disease caused by mutations in the dystrophin gene that prevent production of the dystrophin protein and affects approximately 15,000 patients in the U.S. alone. There are currently no approved therapies that can drive durable and significant functional improvements over time. PBGENE-DMD is designed to improve function for approximately 60% of patients afflicted with DMD by employing two complementary ARCUS nucleases delivered in a single AAV to excise exons 45-55 of the dystrophin gene. The aim of this approach is to restore a near full-length functional dystrophin protein within the body that more closely resembles normal dystrophin as opposed to synthetic, truncated microdystrophin approaches with minimal functional benefit. The Phase 1/2 FUNCTION-DMD study is expected to enroll ambulatory DMD patients with mutations between exons 45 and 55 impacting up to 60% of boys with DMD. The clinical trial will employ an appropriate immune modulation regimen and safety monitoring program to treat ambulatory patients at world class specialized DMD clinical sites.
PBGENE-DMD was granted Orphan Drug Designation by the FDA in July, 2025. The PBGENE-DMD program is eligible for a Priority Review Voucher (PRV) via the Rare Pediatric Disease Priority Review Voucher (PRV) program, which was signed into law on February 3, 2026, as part of the Consolidated Appropriations Act of 2026. PBGENE-DMD received Fast Track designation from the FDA in February 2026.
Further details on the trial can be found on Precision’s website and on clinicaltrials.gov identifier NCT07429240.
About Precision BioSciences, Inc.
Precision BioSciences, Inc. is a clinical stage gene editing company dedicated to improving life (DTIL) with its novel and proprietary ARCUS® genome editing platform that differs from other technologies in the way it cuts, its smaller size, and its simpler structure. These features are intended for ARCUS nucleases to drive more defined therapeutic outcomes. Using ARCUS, the Company’s pipeline is comprised of clinical stage in vivo gene editing candidates designed to deliver lasting cures for the broadest range of genetic and infectious diseases where no adequate treatments exist. For more information about Precision BioSciences, please visit www.precisionbiosciences.com.
The ARCUS® platform is being used to develop in vivo gene editing therapies for sophisticated gene edits, including gene elimination (removing a genome e.g. viral DNA such as in the Company’s PBGENE-HBV program), and excision (removing a large portion of a defective gene by delivering two ARCUS nucleases in a single AAV such as in the Company’s PBGENE-DMD program) and gene insertion (inserting DNA into gene to cause expression/add function).
Forward-Looking Statements
This press release contains forward-looking statements within the meaning of the Private Securities Litigation Reform Act of 1995. All statements contained in this press release that do not relate to matters of historical fact should be considered forward-looking statements, including, without limitation, statements regarding the key advantages of ARCUS and its key capabilities and differentiating characteristics; expectations about operational initiatives, strategies, further development, or timing of additional updates or data releases of PBGENE-HBV and PBGENE-DMD, timing and progress of IRB processes and site activations following IND clearance for the PBGENE-DMD program and FUNCTION-DMD trial; administration of additional doses in Cohort 3 and in parallel commencement of pre-planned additional cohorts to investigate a shorter dosing interval as part of the ongoing assessment of the safety and efficacy profile of PBGENE-HBV after repeat doses in Part 1 dose finding; investigation of dosing at 0.4 mg/kg every 4 weeks and dosing at 0.65 mg/kg every 4 weeks in Cohort 5 to evaluate the potential for an optimized therapeutic index; continued investigation of prophylactic measures per protocol to mitigate acute infusion reactions common to lipid nanoparticle (LNP) delivered therapies, such as transient hypotension and transient elevated liver enzymes, measures including IV fluids, steroids, antihistamines and infusion duration across dose levels and administrations; the goal during Part 1 of the study is to select the dose and schedule that achieves the desired therapeutic index to move to the expansion phase of the ELIMINATE-B trial; expectations of additional clinical biomarker and biopsy data in the first half of 2026 in the ELIMINATE-B trial and expectations to have completed dosing in Cohorts 3, 4, and 5, selection of an optimal dosing regimen intended to support discontinuation of nucleos(t)ide analog treatment and progression into the Part 2 expansion phase; expectations to share further clinical data from the PBGENE-HBV programs at hepatitis-focused medical conferences throughout 2026; the design of PBGENE-HBV to eliminate cccDNA and inactivate integrated HBV DNA with high specificity, potentially leading to cure; the suitability of PBGENE-HBV for the treatment of hepatitis B and the targeting of the root cause of the disease; expectations concerning the receipt of initial clinical data from multiple patients for PBGENE-DMD by year-end 2026 including early efficacy assessment based on near full-length dystrophin protein expression from muscle biopsies; eligibility of PBGENE-DMD Fast Track designation for more frequent meetings and communications with the FDA, rolling review of any application for marketing approval, Priority Review if relevant criteria are met; the planned KOL event providing an overview of the FUNCTION-DMD trial; the design of PBGENE-DMD to improve function over time and address more than 60% of patients with DMD; the potential for PBGENE-DMD to provide durable functional improvement with a single dose of AAV; translation of results in preclinical studies of ARCUS nucleases to clinical studies in humans; the preclinical and clinical development and demonstrated, potential and expected safety, efficacy, durability, and benefit of PBGENE-HBV and PBGENE-DMD, as well as our other product candidates and those being developed by partners; expectations of additional data from the ongoing OTC-HOPE clinical trial in the first half of 2026; expectations of TG Therapeutics to present preliminary Phase 1 azer-cel data in progressive multiple sclerosis in the second half of 2026 and commencement of additional exploratory studies in autoimmune disease outside multiple sclerosis in 2026; and our expected cash runway through multiple clinical inflection points between 2026 and the end of 2028 and the sufficiency of our cash runway extending through 2028. In some cases, you can identify forward-looking statements by terms such as “aim,” “anticipate,” “approach,” “belief”, “believe,” “contemplate,” “could,” “design,” “designed,” “estimate,” “expect,” “goal,” “intend,” “look,” “may,” “mission,” “plan,” “possible,” “potential,” “predict,” “project,” “pursue,” “should,” “strive,” “suggest,” “target,” “will,” “would,” or the negative thereof and similar words and expressions.
Forward-looking statements are based on management’s current expectations, beliefs, and assumptions and on information currently available to us. These statements are neither promises nor guarantees, and involve a number of known and unknown risks, uncertainties and assumptions, and actual results may differ materially from those expressed or implied in the forward-looking statements due to various important factors, including, but not limited to, our ability to become profitable; our ability to procure sufficient funding to advance our programs; risks associated with our capital requirements, anticipated cash runway, requirements under our current debt instruments and effects of restrictions thereunder, including our ability to raise additional capital due to market conditions and/or our market capitalization; our operating expenses and our ability to predict what those expenses will be; our limited operating history; the progression and success of our programs and product candidates in which we expend our resources; our limited ability or inability to assess the safety and efficacy of our product candidates; the risk that other genome-editing technologies may provide significant advantages over our ARCUS technology; our dependence on our ARCUS technology; the initiation, cost, timing, progress, achievement of milestones and results of research and development activities and preclinical and clinical studies, including clinical trial and investigational new drug applications; public perception about genome editing technology and its applications; competition in the genome editing, biopharmaceutical, and biotechnology fields; our or our collaborators’ or other licensees’ ability to identify, develop and commercialize product candidates; pending and potential product liability lawsuits and penalties against us or our collaborators or other licensees related to our technology and our product candidates; the U.S. and foreign regulatory landscape applicable to our and our collaborators’ or other licensees’ development of product candidates; our or our collaborators’ or other licensees’ ability to advance product candidates into, and successfully design, implement and complete, clinical trials; potential manufacturing problems associated with the development or commercialization of any of our product candidates; delays or difficulties in our and our collaborators’ and other licensees’ ability to enroll patients; changes in interim “top-line” and initial data that we announce or publish; if our product candidates do not work as intended or cause undesirable side effects; risks associated with applicable healthcare, data protection, privacy and security regulations and our compliance therewith; our or our licensees’ ability to obtain orphan drug designation or fast track designation for our product candidates or to realize the expected benefits of these designations; our or our collaborators’ or other licensees’ ability to obtain and maintain regulatory approval of our product candidates, and any related restrictions, limitations and/or warnings in the label of an approved product candidate; the rate and degree of market acceptance of any of our product candidates; our ability to effectively manage the growth of our operations; our ability to attract, retain, and motivate executives and personnel; effects of system failures and security breaches; insurance expenses and exposure to uninsured liabilities; effects of tax rules; effects of any pandemic, epidemic, or outbreak of an infectious disease; the success of our existing collaboration and other license agreements, and our ability to enter into new collaboration arrangements; our current and future relationships with and reliance on third parties including suppliers and manufacturers; our ability to obtain and maintain intellectual property protection for our technology and any of our product candidates; potential litigation relating to infringement or misappropriation of intellectual property rights; effects of natural and manmade disasters, public health emergencies and other natural catastrophic events; effects of sustained inflation, supply chain disruptions and major central bank policy actions; market and economic conditions; risks related to ownership of our common stock, including fluctuations in our stock price; our ability to meet the requirements of and maintain listing of our common stock on Nasdaq or other public stock exchanges; and other important factors discussed under the caption “Risk Factors” in our Quarterly Report on Form 10-K for the annual period ended December 31, 2025, as any such factors may be updated from time to time in our other filings with the SEC, which are accessible on the SEC’s website at www.sec.gov and the Investors page of our website under SEC Filings at investor.precisionbiosciences.com.
All forward-looking statements speak only as of the date of this press release and, except as required by applicable law, we have no obligation to update or revise any forward-looking statements contained herein, whether as a result of any new information, future events, changed circumstances or otherwise.
| Precision Biosciences, Inc. |
| Statements of Operations |
| (In thousands, except share and per share amounts) |
| |
| | | | | |
| | | For the Three Months Ended December 31, |
| | | | 2025 | | | | 2024 | |
| Revenue | | $ | 34,204 | | | $ | 638 | |
| Operating expenses | | | | |
| Research and development | | | 14,464 | | | | 15,907 | |
| General and administrative | | | 7,232 | | | | 9,577 | |
| Total operating expenses | | | 21,696 | | | | 25,484 | |
| Operating income (loss) | | | 12,508 | | | | (24,846 | ) |
| Other income | | | | |
| Loss from equity method investment | | | (5,370 | ) | | | (972 | ) |
| Loss on changes in other fair value adjustments | | | (248 | ) | | | (659 | ) |
| Gain on change in fair value of warrant liability | | | 12,359 | | | | 7,812 | |
| Interest expense | | | (348 | ) | | | (392 | ) |
| Interest income | | | 773 | | | | 1,494 | |
| Loss on disposal of assets | | | (390 | ) | | | (182 | ) |
| Impairment charges | | | (36 | ) | | | — | |
| Total other income | | | 6,740 | | | | 7,101 | |
| Income (loss) from continuing operations | | $ | 19,248 | | | $ | (17,745 | ) |
| Gain from discontinued operations | | | 885 | | | | — | |
| Net income (loss) | | $ | 20,133 | | | $ | (17,745 | ) |
| | | | | |
| Net income (loss) per share | | | | |
| Basic | | $ | 1.06 | | | $ | (2.22 | ) |
| Diluted | | $ | 1.05 | | | $ | (2.22 | ) |
| | | | | |
| Weighted-average shares of common stock outstanding | | | | |
| Basic | | | 19,051,307 | | | | 7,999,288 | |
| Diluted | | | 19,171,669 | | | | 7,999,288 | |
| Precision Biosciences, Inc. |
| Statements of Operations |
| (In thousands, except share and per share amounts) |
| |
| | | | | |
| | | For the Years Ended December 31, |
| | | | 2025 | | | | 2024 | |
| Revenue | | $ | 34,264 | | | $ | 68,696 | |
| Operating expenses | | | | |
| Research and development | | | 54,172 | | | | 59,559 | |
| General and administrative | | | 32,240 | | | | 35,299 | |
| Total operating expenses | | | 86,412 | | | | 94,858 | |
| Operating loss | | | (52,148 | ) | | | (26,162 | ) |
| Other income | | | | |
| Loss from equity method investment | | | (5,284 | ) | | | (1,084 | ) |
| (Loss) gain on changes in other fair value adjustments | | | (2,666 | ) | | | 258 | |
| Gain on change in fair value of warrant liability | | | 11,129 | | | | 29,610 | |
| Interest expense | | | (1,422 | ) | | | (1,782 | ) |
| Interest income | | | 4,239 | | | | 6,763 | |
| Loss on disposal of assets | | | (421 | ) | | | (436 | ) |
| Impairment charges | | | (36 | ) | | | — | |
| Total other income | | | 5,539 | | | | 33,329 | |
| (Loss) income from continuing operations | | $ | (46,609 | ) | | $ | 7,167 | |
| Gain from discontinued operations | | | 885 | | | | — | |
| Net (loss) income | | $ | (45,724 | ) | | $ | 7,167 | |
| | | | | |
| Net (loss) income per share | | | | |
| Basic | | $ | (3.56 | ) | | $ | 1.05 | |
| Diluted | | $ | (3.56 | ) | | $ | 1.04 | |
| | | | | |
| Weighted-average shares of common stock outstanding | | | | |
| Basic | | | 12,826,078 | | | | 6,832,982 | |
| Diluted | | | 12,826,078 | | | | 6,883,911 | |
| | | | | |
| Precision Biosciences, Inc. |
| Balance Sheets Data |
| (In thousands, except share amounts) |
| |
| | | | | |
| | | December 31, 2025 | | December 31, 2024 |
| Cash, cash equivalents, and restricted cash | $ | 137,153 | | $ | 108,468 |
| Working capital | | | 109,827 | | | 80,009 |
| Total assets | | | 154,416 | | | 136,388 |
| Total liabilities | | | 62,168 | | | 79,995 |
| Total stockholders' equity | | $ | 92,248 | | $ | 56,393 |
| Common stock outstanding | | | 24,088,425 | | | 8,202,715 |

View source version on businesswire.com: https://www.businesswire.com/news/home/20260312974135/en/
Investor and Media Contact:
Naresh Tanna
Vice President of Investor Relations
[email protected]
Source: Precision BioSciences, Inc.
Investors
Investor Tools