November 3, 2026
- Company Identified Errors in Fixed Asset Reporting
- Delays Third Quarter Earnings Call and Filing of Third Quarter 2026 Form 10-Q
- Preliminary Third Quarter Driven Brands Same Store Sales Increase of 2.0% and Take 5 Same Store Sales Increase of 4.9%
- Continued Strong Cash Generation and Debt Paydown
CHARLOTTE, N.C.--(BUSINESS WIRE)-- Driven Brands Holdings Inc. (NASDAQ: DRVN) (“Driven Brands” or the “Company”) today announced the Audit Committee of the Company’s Board of Directors, after consultation with the Company’s management, concluded there were material errors in the Company’s previously issued consolidated financial statements for fiscal years ended December 27, 2025, December 28, 2024, and December 30, 2023 contained in the Company’s Annual Report on Form 10-K for the fiscal year 2025, and in its previously issued unaudited condensed consolidated financial statements for each of the quarterly and year-to-date periods within fiscal years 2025 and 2024 as well as the quarterly and year-to-date periods ended June 27, 2026 and March 28, 2026.
As a result, the Audit Committee concluded that such financial statements require restatement and should not be relied upon. The errors identified to date primarily relate to the accounting for fixed assets.
Management Commentary
While preparing for the Company’s Whole Business Securitization (“WBS”) subsidiary audits, management identified additional errors primarily in the historical accounting for fixed assets.
The fixed asset errors identified to date fall largely into three categories:
- Failure to timely write-off fixed assets, primarily related to sale leaseback transactions;
- Misclassification of fixed assets within fixed asset categories; and
- Incorrect useful lives across certain fixed asset categories.
“To address these issues, we are continuing to add accounting resources and work with outside accounting advisors to correct the errors we’ve identified, including reconciling our fixed asset records,” said Mike Diamond, Chief Financial Officer. “We are also reviewing whether any other areas require adjustment. To date, the adjustments from these issues have a negligible impact on Adjusted EBITDA.”
There is no set timeline for completing the restatement, and the Company will provide an update as soon as practicable. Until that time, the Company will limit communications to required public disclosures.
“I understand the frustration this causes our shareholders, lenders, employees, and franchisees as we work through this matter,” said Danny Rivera, President and Chief Executive Officer. “Our top priority is to complete the restatement, continue to strengthen our processes and controls, and earn back trust one quarter at a time.”
Preliminary Third Quarter 2026 Performance(1)
In light of the ongoing review tied to this restatement, the Company is delaying its third quarter earnings call and will not file its Form 10-Q for the third quarter by the filing deadline. In the interim, the Company is providing the following update on preliminary third quarter performance.
| Same Store Sales | Net Unit Growth | |
| Driven Brands | 2.0% | (7) |
| Take 5 | 4.9% | 27 |
| Franchise Brands | 0.5% | (34) |
| Auto Glass Now | 6.5% | 0 |
| (1) | The results for the third quarter ended September 26, 2026, set forth above are preliminary and unaudited in nature and subject to change as results for the period are finalized. The Company’s actual results for the period may differ materially from the preliminary estimates presented herein, and additional developments and adjustments may arise before results for the period are finalized. Estimates of results are inherently uncertain and subject to change, and the Company undertakes no obligation to update the estimated results. Accordingly, you should not place undue reliance on these estimates. |
On a preliminary and unaudited basis, the Company also announces:
- The Company had approximately $230 million in cash and cash equivalents as of September 26, 2026, and continues to generate strong free cash flow.
- The Company ended the third quarter with total net debt of approximately $1.4 billion, reflecting the repayment of approximately $485 million of long-term debt through the third quarter.
- During the third quarter, the Company purchased approximately 315,000 shares for $3.8 million. Since authorization, the Company has purchased approximately 1.7 million shares for $19.7 million. The Company is required to temporarily cease its share repurchases until it becomes current with its reporting obligations.
“Take 5 had a strong third quarter, with same store sales up 4.9%, marking its 25th consecutive quarter of growth, and 27 net new units,” said Rivera. “Our priorities are clear: complete the restatement and strengthen our accounting processes and controls, while continuing to deliver growth at Take 5 and strong cash generation.”
Revised Fiscal Year 2026 Outlook
The Company is updating its 2026 outlook, which is subject to adjustments the Company may identify during its ongoing review:
| Updated FY Outlook | Prior FY Outlook | |
| Driven Brands Same Store Sales | 1.0 – 1.5% | Flat - 2% |
| Take 5 Same Store Sales | 3.5 – 4.0% | N/A |
| Driven Brands Revenue | $1.95 - $2.05 billion | $1.95 - $2.05 billion |
| Driven Brands Adjusted EBITDA | $410 - $430 million | $430 - $460 million |
| Adjusted Diluted EPS | $1.10 - $1.20 | $1.15 - $1.25 |
| Take 5 Net Unit Growth | 155+ | N/A |
| Free Cash Flow | $125 - $145 million | $125 - $145 million |
“Our updated outlook reflects ongoing macroeconomic headwinds, continued pressure on lower-income consumers across Take 5, Maaco and Collision, and additional restatement-related costs,” said Rivera. “Against this backdrop, we now expect Take 5 same store sales growth of 3.5% to 4.0% for the full year.”
The Company expects:
- Restatement-related costs of at least $50 million in 2026, up from its previous expectation of the high end of its initial range of $35 million to $45 million. These costs are included in the updated outlook for Adjusted EBITDA. The Company has significantly expanded the scope of its review and the resources dedicated to it and expects to incur additional restatement-related costs in 2027 as it completes this work.
- Net capital expenditures of approximately 6.5% of revenue.
- Total net unit growth of 80 to 100 units. Delays in issuing Franchise Disclosure Documents (“FDDs”), which require completion of the WBS audits, have constrained Franchise Brand new unit openings in the third and fourth quarters of 2026, with this impact expected to continue until the restatement is completed and updated FDDs are issued.
Note: The Company’s 2026 outlook excludes the impact of any potential M&A and divestitures other than the completed divestiture of the international car wash business.
About Driven Brands
Driven Brands™, headquartered in Charlotte, NC, is the largest automotive services company in North America, providing a range of consumer and commercial automotive services, including oil change, paint, collision, glass, vehicle repair, and maintenance. Driven Brands is the parent company of some of North America’s leading automotive service businesses including Take 5 Oil Change®, Meineke Car Care Centers®, Maaco®, 1-800-Radiator & A/C®, Auto Glass Now®, and CARSTAR®. As of the end of fiscal year 2025, Driven Brands had over 4,200 locations across the U.S. and Canada, and services tens of millions of vehicles annually. Driven Brands’ network generated approximately $1.9 billion in annual revenue from approximately $6.1 billion in system-wide sales.
Disclosure Regarding Forward-Looking Statements
This press release contains forward-looking statements within the meaning of Section 27A of the Securities Act of 1933, as amended, and Section 21E of the Securities Exchange Act of 1934, as amended. All statements other than statements of historical facts contained in this press release, including statements regarding our strategy, future operations, future financial position, future revenue, projected costs, prospects, plans, objectives of management, impact of accounting standards and outlook, impairments, and expected market growth are “forward-looking statements” for the purposes of federal and state securities laws, including, among other things, any statements relating to: (i) the current geopolitical environment, including the impact, both direct and indirect, of global conflicts, government actions, such as proposed and enacted tariffs and governmental shutdowns; (ii) our strategy, outlook, and growth prospects; (iii) our operational and financial targets, dividend policy, and capital allocation strategy; (iv) general economic trends and trends in our industry and markets; (v) the risks and costs associated with the integration of, and or ability to integrate, our stores and business units successfully; (vi) our internal control over financial reporting; (vii) the proper application of generally accepted accounting principles in the preparation of our financial statements, which are highly complex and involve many subjective assumptions, estimates, and judgments; (viii) the competitive environment in which we operate; (ix) potential post-closing obligations and liabilities relating to the sale of our car wash businesses; (x) the restatement described above, including the categories, estimated amounts and effects of the errors, which are management’s preliminary estimates, and the timing and content of the Company’s amended and future SEC filings; and (xi) the preliminary third quarter information presented above. Forward-looking statements may include, among others, the words “anticipate,” “believe,” “continue,” “could,” “estimate,” “expect,” “intend,” “likely,” “may,” “plan,” “possible,” “potential,” “predict,” “project,” “should,” “target,” “will,” “would” or any other similar words.
Although we believe that the expectations reflected in any of our forward-looking statements are reasonable, actual results or outcomes could differ materially from those projected or assumed in any of our forward-looking statements. Our future financial condition and results of operations, as well as any forward-looking statements, are subject to change and to inherent risks and uncertainties, many of which are beyond our control. Important factors that could cause our actual results, performance and achievements, or industry results to differ materially from estimates or projections contained in or implied by our forward-looking statements include the following: our ability to compete with other businesses in the automotive aftermarket industries; advances and changes in automotive technology; changes in consumer preferences, perceptions, and spending patterns; changes in general economic conditions and the geographic concentration of our locations; our ability to timely recruit and retain qualified accounting personnel; the need to rely on third-party service providers, which could result in significant costs; diversion of management’s time, attention and resources from strategic matters due to remediation efforts related to the material weaknesses in our internal control over financial reporting and disclosure controls and procedures; our inability to maintain an effective system of internal controls; the risk that additional information may arise out of the continuing review of the financial statements and the evaluation of accounting practices, the preparation of the Company’s restated financial statements or other subsequent events that would require the Company to make additional adjustments, or to identify additional material weaknesses; the risk that the Company will not complete the restatement or file its amended or future SEC reports within the periods it currently expects; the consequences of any failure to timely file periodic reports, including under the listing rules of The Nasdaq Stock Market LLC and the agreements governing the Company’s securitization and credit facilities; the costs of the restatement and of remediating material weaknesses; securities litigation and any regulatory inquiries or proceedings relating to the Company’s financial reporting; our inability to remediate the material weaknesses in our internal control over financial reporting and disclosure controls and procedures; and the risks and uncertainties, as they may be amended from time to time, set forth in our filings with the U.S. Securities and Exchange Commission, including our most recently filed Annual Report on Form 10-K.
There may be other factors not presently known to us or which we currently consider to be immaterial that could cause our actual results to differ materially from those projected in any forward-looking statements we make.
Forward-looking statements made in this release speak only as of the date hereof. We do not undertake any obligation to update or release any revisions to any forward-looking statement or to report any events or circumstances after the date hereof or to reflect the occurrence of unanticipated events, except as required by law. Given these uncertainties, you should not place undue reliance on these forward-looking statements.
Non-GAAP Financial Measures in Outlook
In the Company’s Fiscal Year 2026 Outlook, Driven Brands includes:
- Adjusted Earnings Before Interest, Tax, Depreciation and Amortization (“Adjusted EBITDA”), which excludes certain amounts included in net income calculated in accordance with GAAP,
- Adjusted Earnings per Share (“Adjusted Diluted EPS”), which excludes certain amounts included in diluted earnings per share attributable to Driven Brands common stockholders calculated in accordance with GAAP, and
- Free Cash Flow, which is defined as cash provided by operating activities less capital expenditures, net of proceeds from sale leaseback transactions.
Adjusted EBITDA, Adjusted Diluted EPS and Free Cash Flow are non-GAAP financial measures and have not been reconciled to the most comparable GAAP financial measures because it is not possible to do so without unreasonable efforts due to the uncertainty and potential variability of reconciling items, which are dependent on future events and often outside of management’s control and which could be significant. Because such items cannot be reasonably predicted with the level of precision required, we are unable to provide an outlook for the comparable GAAP measures. Forward-looking estimates of Adjusted EBITDA, Adjusted Diluted EPS, and Free Cash Flow are made in a manner consistent with the relevant definitions and assumptions noted herein and in our filings with the SEC.
Shareholder/Analyst inquiries:
Steve Alexander
[email protected]
(972) 467-6180
**Media inquiries:
**Krista Busada
[email protected]
(704) 644-8129
Source: Driven Brands
Multimedia Files:
-
Company's logo
Download:
Download original 230 KB (2314 x 546) Download image: Company's logo as a original in JPG format. Opens in a new window
Quick Links
Investor Email Alerts
To opt-in for investor email alerts, please enter your email address in the field below and select at least one alert option. After submitting your request, you will receive an activation email to the requested email address. You must click the activation link in order to complete your subscription. You can sign up for additional alert options at any time.
At Driven Brands, we promise to treat your data with respect and will not share your information with any third party. You can unsubscribe to any of our investor alerts following the instructions in the unsubscribe section below. If you experience any issues with this process, please contact us for further assistance.
By providing your email address below, you are providing consent to Driven Brands to send you the requested Investor Email Alert updates.
* Required
Email Address *
Investor Alert OptionsInvestor Alert Options *
| News |
| Quarterly Reports |
| Annual Reports |
| SEC Filings |
| End of Day Stock Quote |
| Events & Presentations |
Submit Sign Up
Email Alert Sign Up Confirmation
REQUEST A MEETING WITH MANAGEMENT >
A Family of Driven Brands


© Driven Brands, Inc. - All rights reserved


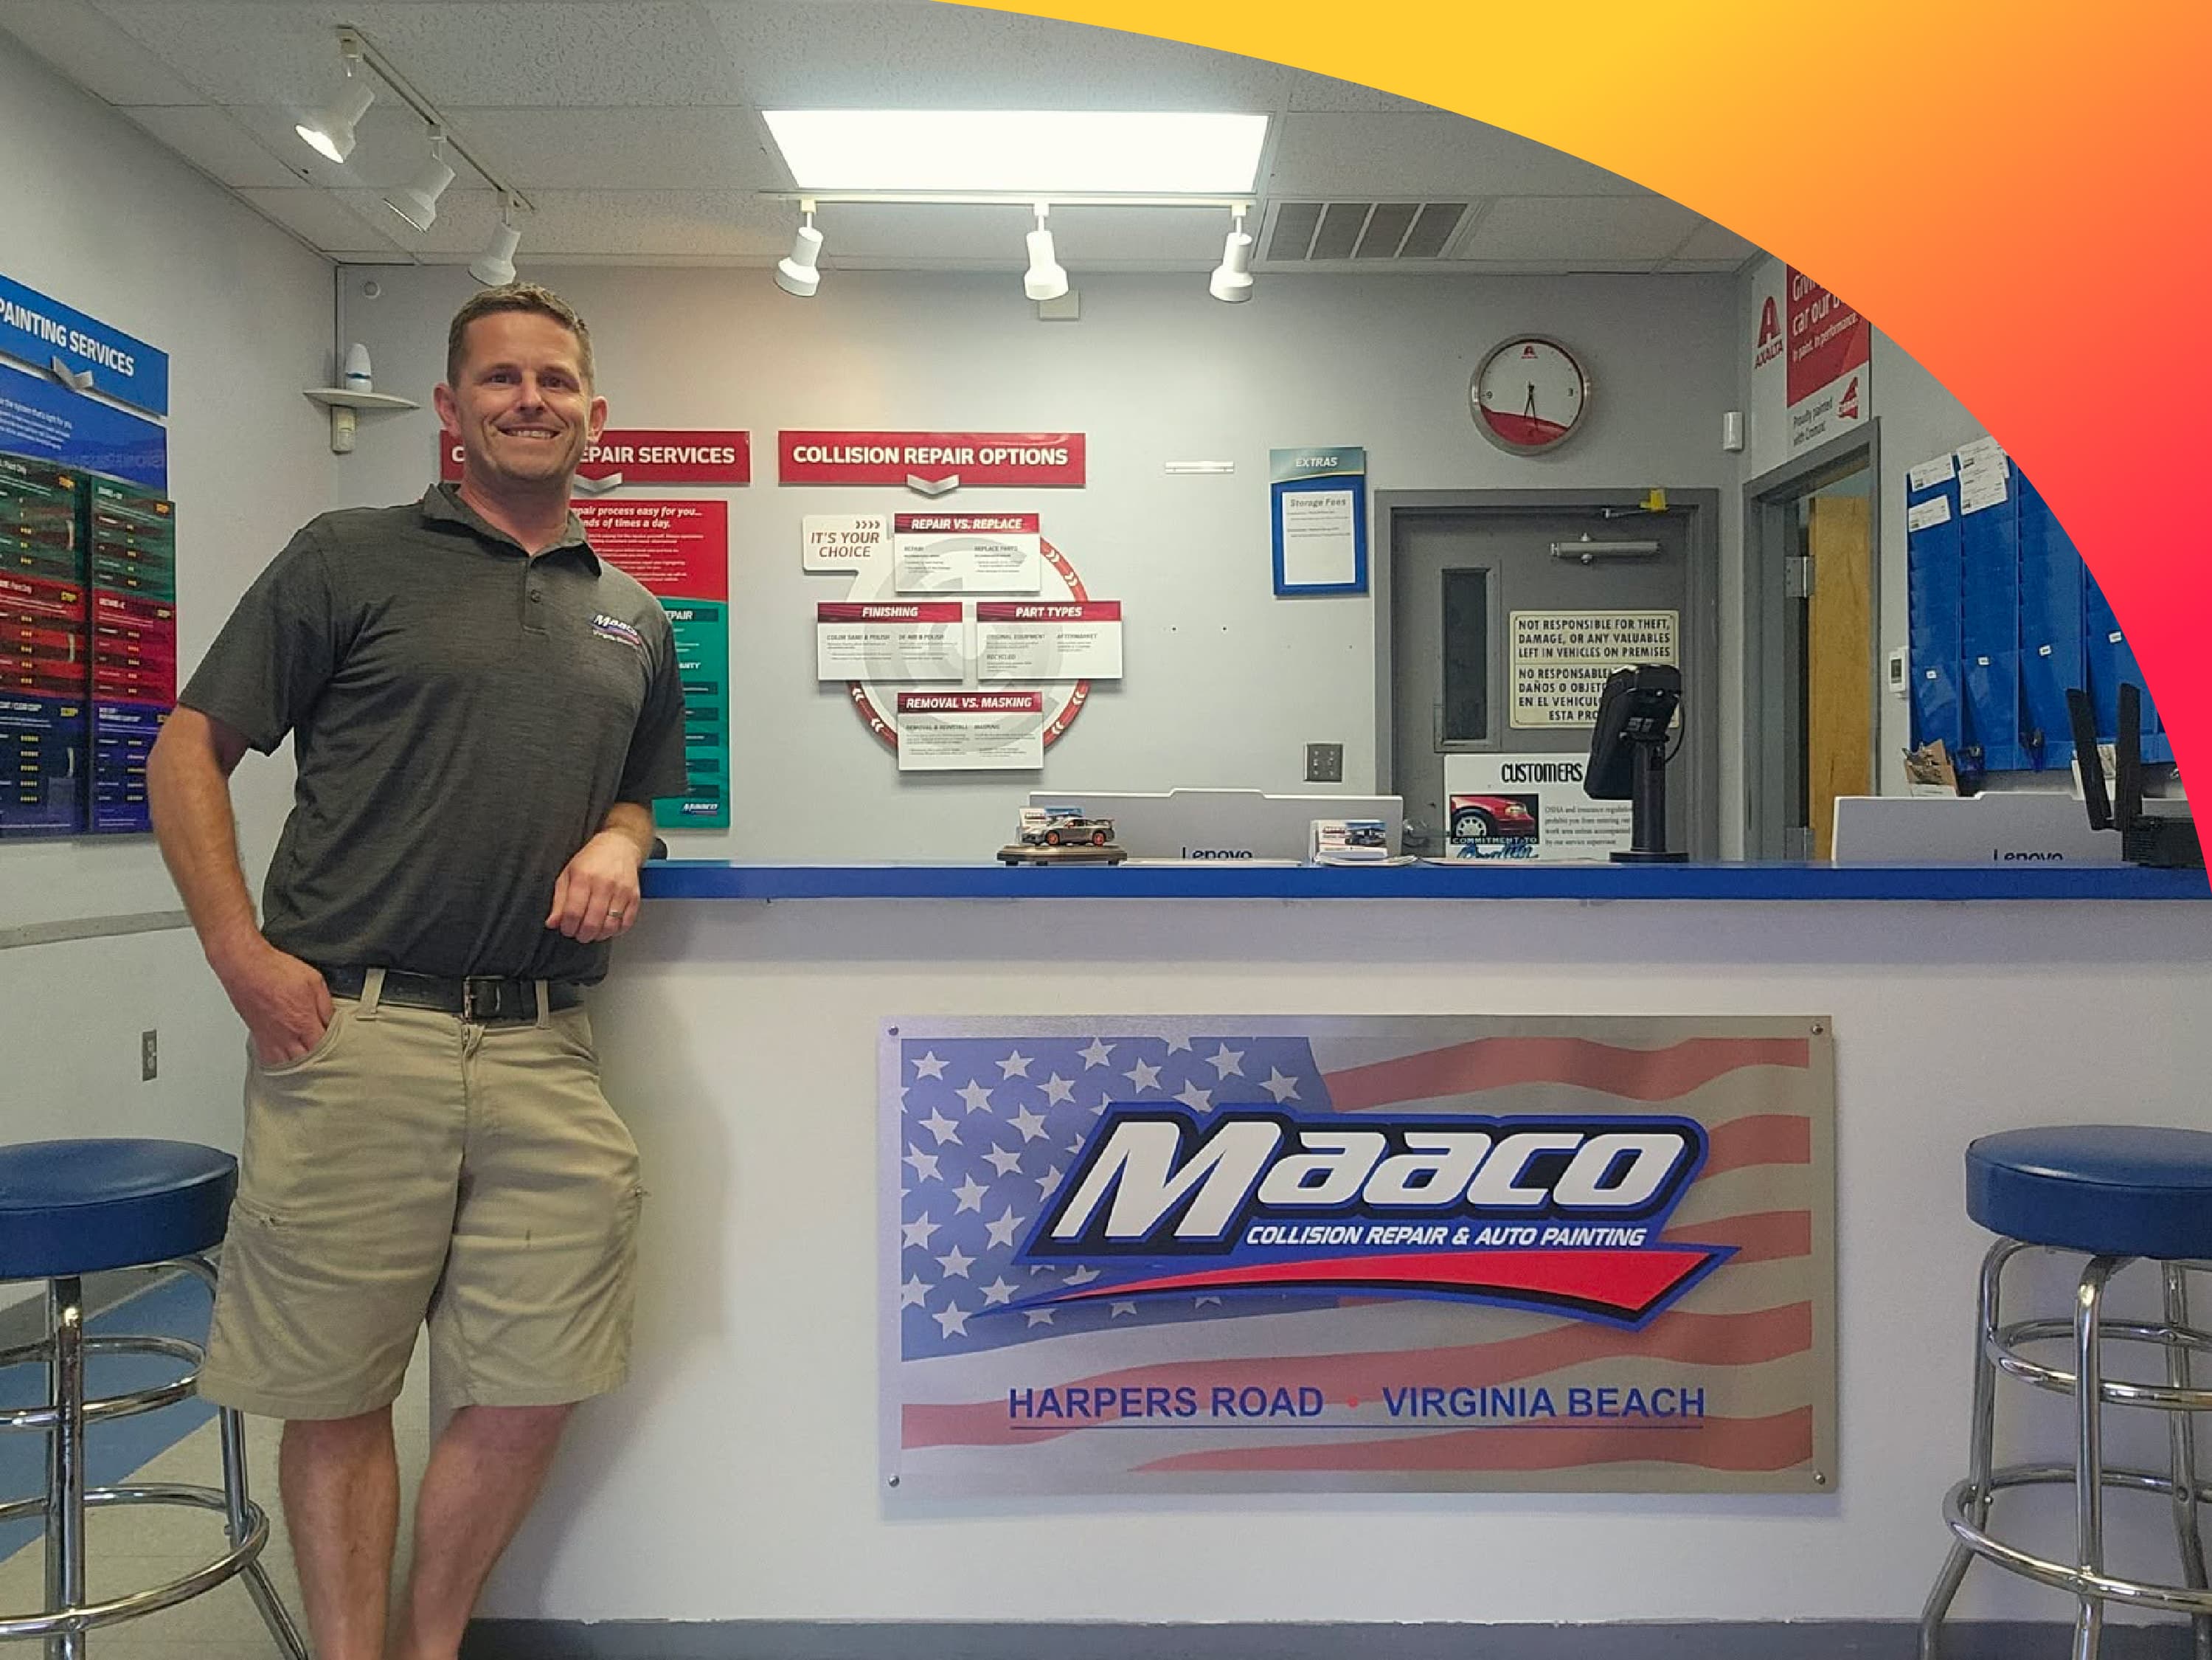
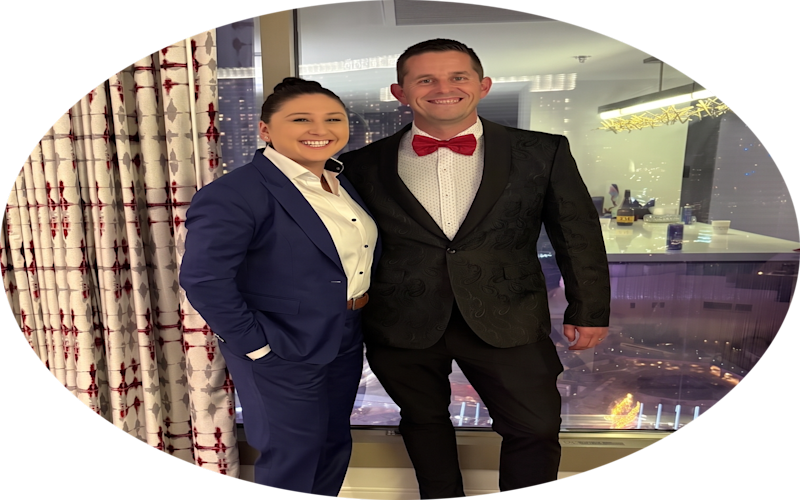 It was there he met AJ’s daughter Katie, his future business partner. When Katie joined the center full time, she and Brian increasingly took responsibility for running the shop as a team. Over the years, they helped grow the Chesapeake location exponentially.


 Currently attending: University of South Carolina, studying international business; op operations and supply chain management


 After her internship, she moved into marketing for Maaco. Later, Driven sent her through training programs that put her directly inside the business—first at Maaco in King of Prussia, Pennsylvania, then a Meineke shop in North Carolina.


