October 29, 2026
PDF Version 158.7 KB
-
Revenue: $1.1 billion, up 11% year-over-year
-
Net Earnings: $115 million, up 60% year-over-year
-
Adjusted EBITDA: $149 million, up 27% year-over-year
-
Diluted EPS:$0.43, up 65% year-over-year
-
Adjusted Diluted EPS:$0.46, up 59% year-over-year
-
Bookings:$1.6 billion (book-to-bill ratio of 1.5x)
-
Record Funded Backlog:$5.6 billion, up 21% year-over-year
-
Raises2026guidance for Revenue, Adjusted EBITDA and Adjusted Diluted EPS
-
Dividend: Company declares cash dividend of $0.09 per share to be paid on November 25, 2026
ARLINGTON, Va., Oct. 29, 2026 (GLOBE NEWSWIRE) -- Leonardo DRS, Inc. (Nasdaq: DRS), a leading provider of advanced defense technologies, today reported financial results for the third quarter 2026, which ended September 30, 2026.
CEO Commentary “Leonardo DRS delivered a strong third quarter, with 11% organic revenue growth and profitability growing even faster. Bookings exceeded $1.6 billion, representing a 1.5x book-to-bill ratio — both our strongest since becoming a public company four years ago. These results reinforce a strategy that is working — investing ahead of demand, in both differentiated capability and capacity, to help our customers maintain overmatch and enable us to scale when the mission requires it. Our record funded backlog, together with improved visibility into the fourth quarter, gives us confidence to raise and narrow our full-year revenue and profitability outlook,” said John Baylouny, President and CEO of Leonardo DRS.
Summary Financial Results
| (In millions, except per share amounts) | Three Months Ended, | | | | Nine Months Ended | | |
| September 30, | | | September 30, | | |
| | 2026 | | 2025 | | Change | | 2026 | | 2025 | | Change |
| Revenues | $1,066 | | $960 | | 11% | | $2,825 | | $2,588 | | 9% |
| | | | | | | | | | | | |
| Net Earnings | $115 | | $72 | | 60% | | $263 | | $176 | | 49% |
| Net Margin | 10.8% | | 7.5% | | 330 bps | | 9.3% | | 6.8% | | 250 bps |
| | | | | | | | | | | | |
| Diluted weighted average number of shares outstanding (WASO) | 268.275 | | 268.426 | | | | 268.617 | | 268.749 | | |
| Diluted Earnings Per Share (EPS) | $0.43 | | $0.26 | | 65% | | $0.98 | | $0.65 | | 51% |
| | | | | | | | | | | | |
| Non-GAAP Financial Measures (1) | | | | | |
| Adjusted EBITDA | $149 | | $117 | | 27% | | $382 | | $295 | | 29% |
| Adjusted EBITDA Margin | 14.0% | | 12.2% | | 180 bps | | 13.5% | | 11.4% | | 210 bps |
| | | | | | | | | | | | |
| Adjusted Net Earnings | $124 | | $78 | | 59% | | $287 | | $195 | | 47% |
| Adjusted Diluted EPS | $0.46 | | $0.29 | | 59% | | $1.07 | | $0.73 | | 47% |
| | | | | | | | | | | | |
(1) The company reports its financials in accordance with U.S. generally accepted accounting principles (“GAAP”). Information about the company’s use of non-GAAP financial measures, including a reconciliation of the non-GAAP financial measures to the most comparable financial measures calculated and presented in accordance with U.S. GAAP, is provided under "Non-GAAP Financial Measures."
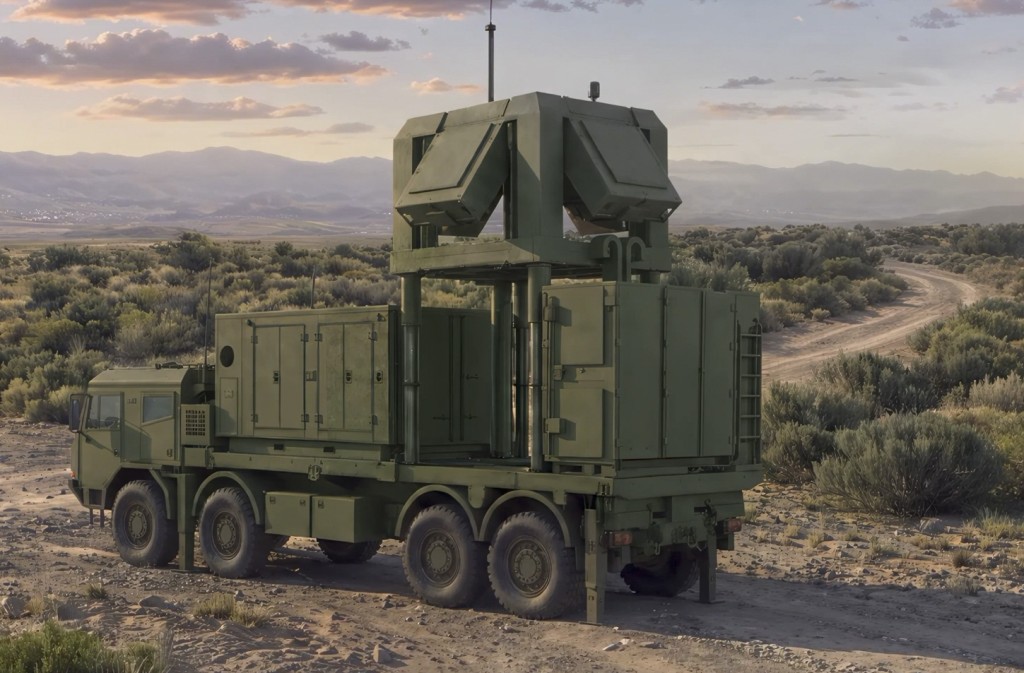
The company reported 11% revenue growth in the third quarter 2026. The year-over-year growth was primarily led by programs related to tactical radars, naval power and propulsion programs and progress on our space sensing programs.
Rigorous program execution across the portfolio, favorable mix and operating leverage of greater volume drove meaningful Adjusted EBITDA growth and margin expansion. The strong operational performance, coupled with a lower tax rate, supported year-over-year growth in third quarter net earnings, Adjusted Net Earnings, diluted EPS and Adjusted Diluted EPS.
Cash Flow Net cash provided by operating activities was $96 million for the third quarter. The company’s free cash flow generation was $61 million in the quarter. Both operating and free cash flow generation were lower than the third quarter 2025 due to higher cash used to fund working capital, partially offset by increased earnings.
Year to date, both operating and free cash flow remain well ahead of the prior-year period, driven by higher profitability and more efficient working capital management.
Dividends and Stock Repurchases During the third quarter, dividends paid to stockholders totaled approximately $24 million or $0.09 per share of common stock. Today, Leonardo DRS announced that its Board of Directors declared a cash dividend of $0.09 per share of common stock payable on November 25, 2026, to stockholders of record on November 12, 2026.
In addition, the company repurchased 288,633 shares of its common stock for approximately $12 million in the third quarter, pursuant to a previously announced stock repurchase program.
Balance Sheet At the end of the third quarter, the company held $294 million of cash and had no outstanding borrowings under its credit facility. The company’s strong balance sheet provides flexibility to pursue organic and inorganic growth opportunities to create shareholder value.
Bookings and Funded Backlog
| (Dollars in millions) | Three Months Ended | | Nine Months Ended |
| | September 30, | | September 30, |
| | 2026 | | 2025 | | 2026 | | 2025 |
| Bookings | $1,639 | | $1,307 | | $3,609 | | $3,151 |
| Book-to-Bill | 1.5x | | 1.4x | | 1.3x | | 1.2x |
| Funded Backlog | $5,640 | | $4,678 | | $5,640 | | $4,678 |
| | | | | | | | |
New funded bookings totaled $1.6 billion. Customer demand remained robust, led by contributions from naval power and propulsion, tactical radars and force protection programs. Funded backlog at quarter end reached a new record of $5.6 billion, a 21% increase year-over-year.
Segment Results Advanced Sensing and Computing (ASC) Segment
| (Dollars in millions) | Three Months Ended | | | | Nine Months Ended | | |
| | September 30, | | | | September 30, | | |
| | 2026 | | 2025 | | Change | | 2026 | | 2025 | | Change |
| Revenues | $659 | | $580 | | 14% | | $1,805 | | $1,633 | | 11% |
| Operating Earnings | $57 | | $45 | | 27% | | $146 | | $107 | | 36% |
| Operating Margin | 8.6% | | 7.8% | | 80 bps | | 8.1% | | 6.6% | | 150 bps |
| Bookings | $1,017 | | $757 | | | | $2,137 | | $1,985 | | |
| Book-to-Bill | 1.5x | | 1.3x | | | | 1.2x | | 1.2x | | |
| | | | | | | | | | | | |
| Non-GAAP Financial Measures**(1)** | | | | | | | | | | | |
| Segment Adjusted EBITDA | $78 | | $64 | | 22% | | $209 | | $164 | | 27% |
| Segment Adjusted EBITDA Margin | 11.8% | | 11.0% | | 80 bps | | 11.6% | | 10.0% | | 160 bps |
| | | | | | | | | | | | |
(1) The company reports its financials in accordance with U.S. GAAP. Information about the company’s use of non-GAAP financial measures, including a reconciliation of the non-GAAP financial measures to the most comparable financial measures calculated and presented in accordance with U.S. GAAP, is provided under "Non-GAAP Financial Measures."
Healthy demand for naval network computing and tactical radars supported ASC quarterly bookings. The segment’s revenue growth was driven primarily by programs associated with tactical radars and space sensing programs. Adjusted EBITDA and margin rose versus third quarter 2025 on strong operational delivery, favorable mix and volume leveraging.
Integrated Mission Systems (IMS) Segment
| (Dollars in millions) | Three Months Ended | | | | Nine Months Ended | | |
| | September 30, | | | | September 30, | | |
| | 2026 | | 2025 | | Change | | 2026 | | 2025 | | Change |
| Revenues | $428 | | $383 | | 12% | | $1,056 | | $964 | | 10% |
| Operating Earnings | $64 | | $48 | | 33% | | $154 | | $115 | | 34% |
| Operating Margin | 15.0% | | 12.5% | | 250 bps | | 14.6% | | 11.9% | | 270 bps |
| Bookings | $622 | | $550 | | | | $1,472 | | $1,166 | | |
| Book-to-Bill | 1.5x | | 1.4x | | | | 1.4x | | 1.2x | | |
| | | | | | | | | | | | |
| Non-GAAP Financial Measures**(1)** | | | | | | | | | | | |
| Segment Adjusted EBITDA | $71 | | $53 | | 34% | | $173 | | $131 | | 32% |
| Segment Adjusted EBITDA Margin | 16.6% | | 13.8% | | 280 bps | | 16.4% | | 13.6% | | 280 bps |
| | | | | | | | | | | | |
(1) The company reports its financials in accordance with U.S. GAAP. Information about the company’s use of non-GAAP financial measures, including a reconciliation of the non-GAAP financial measures to the most comparable financial measures calculated and presented in accordance with U.S. GAAP, is provided under "Non-GAAP Financial Measures."
Quarterly IMS bookings were well balanced across electric power and propulsion and force protection programs, and revenue growth reflected strength across naval power and propulsion programs. Adjusted EBITDA and margin expanded significantly over third quarter 2025, supported by operational leverage from higher volume and strong execution within electric power and propulsion programs, despite increased investment in internal research and development.
2026****Guidance Leonardo DRS is increasing 2026 guidance for Revenue, Adjusted EBITDA and Adjusted Diluted EPS based on strong year-to-date performance, as specified in the table below:
| Measure | Current 2026 Guidance | Prior 2026 Guidance |
| Revenue | $3,950 million - $3,985 million | $3,900 million - $3,975 million |
| Adjusted EBITDA | $545 million - $555 million | $525 million - $540 million |
| Tax Rate | 13.0% | 16.5% |
| Diluted WASO | 269.0 million | 269.0 million |
| Adjusted Diluted EPS | $1.50 - $1.53 | $1.34 - $1.39 |
| | | |
The guidance excludes the pending acquisition of Raft LLC (“Raft”).
The company does not provide a reconciliation of forward-looking Adjusted EBITDA and Adjusted Diluted EPS due to the inherent difficulty in forecasting and quantifying the adjustments that are necessary to calculate such non-GAAP measures without unreasonable effort. Material changes to any one of these items could have a significant effect on future GAAP results.
Conference Call Leonardo DRS management will host a conference call beginning at 10:00 a.m. ET on October 29, 2026 to discuss the financial results for its third quarter 2026.
A live audio broadcast of the conference call along with a supplemental presentation will be available to the public through links on the Leonardo DRS Investor Relations website (https://investors.leonardodrs.com).
A replay of the conference call will be available on the Leonardo DRS website approximately 2 hours after the conclusion of the conference call.
About Leonardo DRS Leonardo DRS, Inc. (Nasdaq: DRS) is at the forefront of developing transformative defense technologies using its proven agility and delivering innovative solutions for U.S. national security customers and allies worldwide. We specialize in rapidly providing high-performance, multi-domain capabilities across next-generation advanced sensing, network computing, force protection, and electric power and propulsion. Our reputation as a trusted provider is built on a continuous focus on practical innovation, delivering quality, and meeting our customers’ most demanding mission requirements. For further information on our complete range of capabilities, visit www.LeonardoDRS.com.
Leonardo DRS Contacts
| Investors | | Media |
| Camilla Yanushevsky | | Charles Jones |
| Director, Investor Relations | | Director, Marketing and Corporate Communications |
| +1 571 309 8216 | | +1 571 737 8800 |
| [email protected] | | [email protected] |
| | | |
Forward-Looking Statements In this press release, when using the terms the “company”, “Leonardo DRS”, “we”, “us” and “our,” unless otherwise indicated or the context otherwise requires, we are referring to Leonardo DRS, Inc. This press release contains forward-looking statements and cautionary statements within the meaning of the Private Securities Litigation Reform Act of 1995. Some of the forward-looking statements can be identified by the use of forward-looking terms such as “believes,” “expects,” “may,” “will,” “shall,” “should,” “would,” “could,” “seeks,” “aims,” “strives,” “targets,” “projects,” “guidance,” “intends,” “plans,” “estimates,” “anticipates” or other comparable terms. Forward-looking statements include, without limitation, all matters that are not historical facts. They appear in a number of places throughout this press release and include, without limitation, statements regarding our intentions, beliefs, assumptions or current expectations concerning, among other things, financial goals, financial position, results of operations, cash flows, prospects, strategies or expectations, the proposed acquisition of Raft, including the expected timing of completion of the transaction, the satisfaction of closing conditions, the receipt of regulatory approvals, the anticipated benefits of the transaction, the expected impact of the transaction on DRS or Raft’s financial results, including expected accretion and tax benefits, the expected financing of the transaction, plans for the integration of the acquired business, and the impact of prevailing economic conditions.
Forward-looking statements are subject to known and unknown risks and uncertainties, many of which may be beyond our control. We caution you that forward-looking statements are not guarantees of future performance or outcomes and that actual performance and outcomes may differ materially from those made in or suggested by the forward-looking statements contained in this press release. In addition, even if future performance and outcomes are consistent with the forward-looking statements contained in this press release, those results or developments may not be indicative of results or developments in subsequent periods. New factors emerge from time to time that may cause our business not to develop as we expect and it is not possible for us to predict all of them. Factors that could cause actual results and outcomes to differ from those reflected in forward-looking statements include, without limitation: disruptions, including from government shutdowns, or deteriorations in our relationship with the relevant agencies of the U.S. government, as well as any failure to pass routine audits or otherwise comply with governmental requirements including those related to security clearance or procurement rules, including the False Claims Act; significant delays, including from government shutdowns, or reductions in appropriations for our programs and changes in U.S. government priorities and spending levels more broadly; any failure to comply with the amended and restated proxy agreement with the U.S. Department of War (“DoW”); the effect of inflation and other cost pressures on our supply chain and/or our labor costs; our mix of fixed-price, cost-plus and time-and-materials type contracts and any resulting impact on our cash flows due to cost overruns; failure to properly comply with various covenants of the agreements governing our debt could negatively impact our business; our dependence on U.S. government contracts, which often are only partially funded and are subject to immediate termination, some of which are classified and the concentration of our customer base in the U.S. defense industry; our use of estimates in pricing and accounting for many of our programs that are inherently uncertain and which may not prove to be accurate; our ability to realize the full value of our backlog; our ability to predict future capital needs or to obtain additional financing if needed, on terms acceptable to us, if at all; our ability to respond to the rapid technological changes in the markets in which we compete; the effect of global and regional economic downturns and rising interest rates; our ability to maintain an effective system of internal control over financial reporting; our inability to appropriately manage our inventory; our inability to fully realize the value of our total estimated contract value or bookings; our ability to compete efficiently, including due to U.S. government organizational conflict of interest rules which may limit new contract opportunities or require us to wind down existing contracts; our relationships with other industry participants, including any contractual disputes or the inability of our key suppliers to timely deliver our components, parts or services; preferences or set-asides for small or small disadvantaged businesses could impact our ability to be a prime contractor; any failure to meet our contractual obligations including due to potential impacts to our business from supply chain risks, such as longer lead times and shortages of electronics and other components; any security breach, including any cyber-attack, cyber intrusion, insider threat, or other significant disruption of our IT networks and related systems, as well as any act of terrorism or other threat to our physical security and personnel; our ability to fully exploit or obtain patents or other intellectual property protections necessary to secure our proprietary technology, including our ability to avoid infringing upon the intellectual property of third parties or prevent third parties from infringing upon our own intellectual property; the conduct of our employees, agents, affiliates, subcontractors, suppliers, business partners or joint ventures in which we participate which may impact our reputation and ability to do business; the outcome of litigation, arbitration, investigations, claims, disputes, enforcement actions and other legal proceedings in which we are involved; various geopolitical and economic factors, laws and regulations including the Foreign Corrupt Practices Act, the Arms Export Control Act, the International Traffic in Arms Regulations, the Export Administration Regulations, recent U.S. tariffs imposed or threatened to be imposed on other countries and any related retaliatory actions taken by such countries and those that we are exposed to as a result of our international business; our ability to obtain export licenses necessary to conduct certain operations abroad, including any attempts by Congress to prevent proposed sales to certain foreign governments; our ability to attract and retain technical and other key personnel; the occurrence of prolonged work stoppages; the unavailability or inadequacy of our insurance coverage, customer indemnifications or other liability protections to cover all of our significant risks or to pay for material losses we incur; future changes in U.S. tax laws and regulations or interpretations thereof; future changes in the DoW’s and other governments’ budgets; certain limitations on our ability to use our net operating losses to offset future taxable income; termination of our leases or our inability to renew our leases on acceptable terms; changes in estimates used in accounting for our pension plans, including with respect to the funding status thereof; changes in future business or other market conditions that could cause business investments and/or recorded goodwill or other long-term assets to become impaired; risks related to our proposed acquisition of Raft, including the failure to complete the transaction on the anticipated timeline or at all, the failure to realize the anticipated benefits of the transaction, including expected accretion and tax benefits, integration difficulties, retention of key personnel, transaction and integration costs, and increased indebtedness incurred to fund the transaction; adverse consequences from any acquisitions such as operating difficulties, dilution and other harmful consequences or any modification, delay or prevention of any future acquisition or investment activity by the Committee on Foreign Investment in the United States; natural disasters, severe weather or other significant disruptions; failure to properly contain a global pandemic in a timely manner could materially affect how we and our business partners operate; our compliance with environmental laws and regulations and any environmental liabilities that may affect our reputation or financial position; any conflict of interest that may arise because Leonardo US Holding, LLC, our majority stockholder, or Leonardo S.p.A., our indirect majority stockholder, may have interests that are different from, or conflict with, those of our other stockholders, including as a result of any ongoing business relationships Leonardo S.p.A. may have with us and their significant ownership in us may discourage change of control transactions (our amended and restated certificate of incorporation provides that we waive any interest or expectancy in corporate opportunities presented to Leonardo S.p.A.); or our obligations to provide certain services to Leonardo S.p.A., which may divert human and financial resources from our business.
You should read this press release completely and with the understanding that actual future results may be materially different from expectations. All forward-looking statements made in this press release are qualified by these cautionary statements. These forward-looking statements are made only as of the date of this press release and we do not undertake any obligation, other than as may be required by law, to update or revise any forward-looking or cautionary statements to reflect changes in assumptions, the occurrence of events, unanticipated or otherwise and changes in future operating results over time or otherwise.
Other risks, uncertainties and factors, including those discussed in our SEC filings under “Risk Factors” of our latest Annual Report on Form 10-K and subsequent Quarterly Reports on Form 10-Q, all of which may be viewed or obtained through the investor relations section of our website at www.LeonardoDRS.com, could cause our actual results to differ materially from those projected in any forward-looking statements we make. Readers should read the discussion of these factors carefully to better understand the risks and uncertainties inherent in our business and underlying any forward-looking statements.
| |
| Consolidated Statements of Earnings (Unaudited) |
| |
| (Dollars in millions, except per share amounts) | Three Months Ended | | Nine Months Ended |
| | September 30, | | September 30, |
| | | 2026 | | | | 2025 | | | | 2026 | | | | 2025 | |
| Revenues | | 1,066 | | | | 960 | | | | 2,825 | | | | 2,588 | |
| Cost of revenues | | (803 | ) | | | (738 | ) | | | (2,113 | ) | | | (1,988 | ) |
| Gross profit | | 263 | | | | 222 | | | | 712 | | | | 600 | |
| General and administrative expenses | | (142 | ) | | | (123 | ) | | | (401 | ) | | | (361 | ) |
| Amortization of acquired intangible assets | | (5 | ) | | | (5 | ) | | | (16 | ) | | | (16 | ) |
| Other operating expenses, net | | — | | | | (1 | ) | | | — | | | | (1 | ) |
| Operating earnings | | 116 | | | | 93 | | | | 295 | | | | 222 | |
| Interest income (expense), net | | 1 | | | | (4 | ) | | | 3 | | | | (7 | ) |
| Other, net | | (1 | ) | | | (2 | ) | | | (5 | ) | | | (3 | ) |
| Earnings before taxes | | 116 | | | | 87 | | | | 293 | | | | 212 | |
| Income tax provision | | (1 | ) | | | (15 | ) | | | (30 | ) | | | (36 | ) |
| Net earnings | $115 | | | $72 | | | $263 | | | $176 | |
| | | | | | | | |
| Net earnings per share from common stock: | | | | | | | |
| Basic earnings per share | $0.43 | | | $0.27 | | | $0.99 | | | $0.66 | |
| Diluted earnings per share | $0.43 | | | $0.26 | | | $0.98 | | | $0.65 | |
| | | | | | | | | | | | |
| Consolidated Balance Sheets (Unaudited) |
| |
| (Dollars in millions, except per share amounts) | September 30, | | December 31, |
| | | 2026 | | | | 2025 | |
| ASSETS | | | |
| Current assets: | | | |
| Cash and cash equivalents | $294 | | | $647 | |
| Accounts receivable, net | | 358 | | | | 334 | |
| Contract assets | | 1,083 | | | | 931 | |
| Inventories | | 374 | | | | 352 | |
| Prepaid expenses | | 45 | | | | 26 | |
| Other current assets | | 25 | | | | 36 | |
| Total current assets | | 2,179 | | | | 2,326 | |
| Noncurrent assets: | | | |
| Property, plant and equipment, net | | 572 | | | | 512 | |
| Intangible assets, net | | 94 | | | | 112 | |
| Goodwill | | 1,238 | | | | 1,238 | |
| Deferred tax assets | | 87 | | | | 88 | |
| Other noncurrent assets | | 204 | | | | 210 | |
| Total noncurrent assets | | 2,195 | | | | 2,160 | |
| Total assets | **$**4,374 | | | **$**4,486 | |
| LIABILITIES AND STOCKHOLDERS' EQUITY | | | |
| Current liabilities: | | | |
| Short-term borrowings and current portion of long-term debt | $10 | | | $26 | |
| Accounts payable | | 257 | | | | 351 | |
| Contract liabilities | | 594 | | | | 585 | |
| Other current liabilities | | 296 | | | | 269 | |
| Total current liabilities | | 1,157 | | | | 1,231 | |
| Noncurrent liabilities: | | | |
| Long-term debt | | 165 | | | | 321 | |
| Pension and other postretirement benefit plan liabilities | | 28 | | | | 35 | |
| Deferred tax liabilities | | 3 | | | | 3 | |
| Other noncurrent liabilities | | 131 | | | | 166 | |
| Total noncurrent liabilities | **$**327 | | | **$**525 | |
| Stockholders' equity: | | | |
| Preferred stock, $0.01 par value: 10,000,000 shares authorized; none issued | | $— | | | | $— | |
| Common stock, $0.01 par value: 350,000,000 shares authorized; 266,711,588 and 265,822,404 shares issued and outstanding as of September 30, 2026 and December 31, 2025, respectively | | 3 | | | | 3 | |
| Additional paid-in capital | | 4,983 | | | | 5,083 | |
| Accumulated deficit | | (2,052 | ) | | | (2,315 | ) |
| Accumulated other comprehensive loss | | (44 | ) | | | (41 | ) |
| Total stockholders' equity | | 2,890 | | | | 2,730 | |
| Total liabilities and stockholders' equity | **$**4,374 | | | **$**4,486 | |
| | | | | | |
| Consolidated Statements of Cash Flows (Unaudited) |
| |
| (Dollars in millions) | Nine Months Ended |
| | September 30, |
| | | 2026 | | | | 2025 | |
| Operating activities | | | |
| Net earnings | $263 | | | $176 | |
| Adjustments to reconcile net earnings to net cash provided by (used in) operating activities: | | | |
| Depreciation and amortization | | 77 | | | | 69 | |
| Deferred income taxes | | (4 | ) | | | — | |
| Stock-based compensation expense | | 17 | | | | 19 | |
| Changes in assets and liabilities: | | | |
| Accounts receivable | | (24 | ) | | | (74 | ) |
| Contract assets | | (153 | ) | | | (182 | ) |
| Inventories | | (22 | ) | | | (46 | ) |
| Prepaid expenses | | (19 | ) | | | (5 | ) |
| Other current assets | | 7 | | | | 19 | |
| Other noncurrent assets | | 14 | | | | 13 | |
| Defined benefit obligations | | (7 | ) | | | (6 | ) |
| Accounts payable | | (85 | ) | | | (80 | ) |
| Contract liabilities | | 9 | | | | 41 | |
| Other current liabilities | | 33 | | | | 9 | |
| Other noncurrent liabilities | | (41 | ) | | | (12 | ) |
| Net cash provided by (used in) operating activities | | 65 | | | | (59 | ) |
| Investing activities | | | |
| Capital expenditures | | (97 | ) | | | (90 | ) |
| Proceeds from sales of assets | | 1 | | | | — | |
| Purchases of investments | | — | | | | (15 | ) |
| Other | | 1 | | | | — | |
| Net cash used in investing activities | | (95 | ) | | | (105 | ) |
| Financing activities | | | |
| Net decrease in borrowings (maturities of 90 days or less) | | (5 | ) | | | (1 | ) |
| Repayments of borrowings | | (191 | ) | | | (9 | ) |
| Proceeds from stock issuance | | 8 | | | | 9 | |
| Repurchases of common stock | | (28 | ) | | | (24 | ) |
| Payments of employee taxes withheld from stock-based awards | | (25 | ) | | | (21 | ) |
| Dividends paid | | (21 | ) | | | (21 | ) |
| Dividends paid to related party | | (51 | ) | | | (51 | ) |
| Other | | (10 | ) | | | (7 | ) |
| Net cash used in financing activities | | (323 | ) | | | (125 | ) |
| Effect of exchange rate changes on cash and cash equivalents | | — | | | | — | |
| Net decrease in cash and cash equivalents | | (353 | ) | | | (289 | ) |
| Cash and cash equivalents at beginning of year | | 647 | | | | 598 | |
| Cash and cash equivalents at end of period | **$**294 | | | **$**309 | |
| | | | | | |
Non-GAAP Financial Measures (Unaudited) In addition to the results reported in accordance with U.S. GAAP included throughout this document, the company has provided information regarding “Adjusted EBITDA,” “Adjusted EBITDA Margin,” “Segment Adjusted EBITDA,” “Segment Adjusted EBITDA Margin,” “Adjusted Net Earnings,” “Adjusted Diluted Earnings Per Share” and “Free Cash Flow” (each, a non-GAAP financial measure).
We believe the non-GAAP financial measures presented in this document will help investors understand our financial condition and operating results and assess our future prospects. We believe these non-GAAP financial measures, each of which is discussed in greater detail below, are important supplemental measures because they exclude unusual or non-recurring items as well as non-cash items that are unrelated to or may not be indicative of our ongoing operating results. Further, when read in conjunction with our GAAP results, these non-GAAP financial measures provide a baseline for analyzing trends in our underlying businesses and can be used by management as a tool to help make financial, operational and planning decisions. Finally, these measures are often used by analysts and other interested parties to evaluate companies in our industry by providing more comparable measures that are less affected by factors such as capital structure.
We recognize that these non-GAAP financial measures have limitations, including that they may be calculated differently by other companies or may be used under different circumstances or for different purposes, thereby affecting their comparability from company to company. In order to compensate for these and the other limitations discussed below, management does not consider these measures in isolation from or as alternatives to the comparable financial measures determined in accordance with U.S. GAAP. Readers should review the reconciliations below and should not rely on any single financial measure to evaluate our business.
We define these non-GAAP financial measures as:
Adjusted EBITDA and Adjusted EBITDA Margin are defined as net earnings before income taxes, net interest expense, amortization of acquired intangible assets, depreciation, deal-related transaction costs, restructuring costs and other one-time non-operational events (which include non-service pension expense, legal liability accrual reversals, executive transition costs and foreign exchange impacts), then in the case of Adjusted EBITDA Margin dividing Adjusted EBITDA by revenues.
| (Dollars in millions) | Three Months Ended | | Nine Months Ended |
| September 30, | September 30, |
| | | 2026 | | | | 2025 | | | | 2026 | | | | 2025 | |
| Net earnings | **$**115 | | | **$**72 | | | **$**263 | | | **$**176 | |
| Income tax provision | | 1 | | | | 15 | | | | 30 | | | | 36 | |
| Interest (income) expense, net | | (1 | ) | | | 4 | | | | (3 | ) | | | 7 | |
| Amortization of intangibles | | 5 | | | | 5 | | | | 16 | | | | 16 | |
| Depreciation | | 22 | | | | 18 | | | | 61 | | | | 53 | |
| Deal-related transaction costs | | 4 | | | | — | | | | 4 | | | | — | |
| Restructuring costs | | — | | | | 1 | | | | — | | | | 1 | |
| Other one-time non-operational events | | 3 | | | | 2 | | | | 11 | | | | 6 | |
| Adjusted EBITDA | **$**149 | | | **$**117 | | | **$**382 | | | **$**295 | |
| Adjusted EBITDA Margin | | 14.0 | % | | | 12.2 | % | | | 13.5 | % | | | 11.4 | % |
| | | | | | | | | | | | | | | | |
Segment Adjusted EBITDA and Segment Adjusted EBITDA Margin are defined as operating earnings before amortization of acquired intangible assets, depreciation, deal-related transaction costs, restructuring costs and other one-time non-operational events, then in the case of Segment Adjusted EBITDA Margin dividing Segment Adjusted EBITDA by revenues.
Advanced Sensing and Computing (ASC) Segment Adjusted EBITDA
| (Dollars in millions) | Three Months Ended | | Nine Months Ended |
| | September 30, | September 30, |
| | | 2026 | | | | 2025 | | | | 2026 | | | | 2025 | |
| Operating earnings | **$**57 | | | **$**45 | | | **$**146 | | | **$**107 | |
| Amortization of intangibles | | 5 | | | | 5 | | | | 16 | | | | 16 | |
| Depreciation | | 15 | | | | 12 | | | | 42 | | | | 36 | |
| Restructuring costs | | — | | | | 1 | | | | — | | | | 1 | |
| Other one-time non-operational events | | 1 | | | | 1 | | | | 5 | | | | 4 | |
| Segment Adjusted EBITDA | **$**78 | | | **$**64 | | | **$**209 | | | **$**164 | |
| Segment Adjusted EBITDA Margin | | 11.8 | % | | | 11.0 | % | | | 11.6 | % | | | 10.0 | % |
| | | | | | | | | | | | | | | | |
Integrated Mission Systems (IMS) Segment Adjusted EBITDA
| (Dollars in millions) | Three Months Ended | | Nine Months Ended |
| | September 30, | September 30, |
| | | 2026 | | | | 2025 | | | | 2026 | | | | 2025 | |
| Operating earnings | **$**64 | | | **$**48 | | | **$**154 | | | **$**115 | |
| Depreciation | | 7 | | | | 6 | | | | 19 | | | | 17 | |
| Other one-time non-operational events | | — | | | | (1 | ) | | | — | | | | (1 | ) |
| Segment Adjusted EBITDA | **$**71 | | | **$**53 | | | **$**173 | | | **$**131 | |
| Segment Adjusted EBITDA Margin | | 16.6 | % | | | 13.8 | % | | | 16.4 | % | | | 13.6 | % |
| | | | | | | | | | | | | | | | |
Adjusted Net Earningsand Adjusted Diluted EPSare defined as net earnings excluding amortization of acquired intangible assets, deal-related transaction costs, restructuring costs and other one-time non-operational events (which include non-service pension expense, legal liability accrual reversals, executive transition costs and foreign exchange impacts) and the related tax impacts, then in the case of Adjusted Diluted EPS dividing Adjusted Net Earnings by the diluted weighted average number of shares outstanding (WASO).
| (In millions, except per share amounts) | Three Months Ended | | Nine Months Ended |
| September 30, | September 30, |
| | | 2026 | | | | 2025 | | | | 2026 | | | | 2025 | |
| Net earnings | **$**115 | | | **$**72 | | | **$**263 | | | **$**176 | |
| Amortization of intangibles | | 5 | | | | 5 | | | | 16 | | | | 16 | |
| Deal-related transaction costs | | 4 | | | | — | | | | 4 | | | | — | |
| Restructuring costs | | — | | | | 1 | | | | — | | | | 1 | |
| Other one-time non-operational events | | 3 | | | | 2 | | | | 11 | | | | 6 | |
| Tax effect of adjustments (1) | | (3 | ) | | | (2 | ) | | | (7 | ) | | | (4 | ) |
| Adjusted Net Earnings | **$**124 | | | **$**78 | | | **$**287 | | | **$**195 | |
| | | | | | | | |
| Per share information | | | | | | | |
| Diluted WASO | | 268.275 | | | | 268.426 | | | | 268.617 | | | | 268.749 | |
| | | | | | | | |
| Diluted EPS | **$**0.43 | | | **$**0.26 | | | **$**0.98 | | | **$**0.65 | |
| Adjusted Diluted EPS | **$**0.46 | | | **$**0.29 | | | **$**1.07 | | | **$**0.73 | |
(1) Calculation uses an estimated statutory tax rate on non-GAAP adjustments.
Free Cash Flow is defined as the sum of the cash flows provided by (used in) operating activities, transaction-related expenditures (net of tax), capital expenditures and proceeds from sale of assets.
| (Dollars in millions) | Three Months Ended | | Nine Months Ended |
| September 30, | | September 30, |
| | | 2026 | | | | 2025 | | | | 2026 | | | | 2025 | |
| Net cash provided by (used in) operating activities | **$**96 | | | **$**107 | | | **$**65 | | | ($ | 59 | ) |
| Transaction-related expenditures, net of tax | | 3 | | | | — | | | | 3 | | | | — | |
| Capital expenditures | | (38 | ) | | | (30 | ) | | | (97 | ) | | | (90 | ) |
| Proceeds from sales of assets | | — | | | | — | | | | 1 | | | | — | |
| Free Cash Flow | **$**61 | | | **$**77 | | | ($ | 28 | ) | | ($ | 149 | ) |


Source: Leonardo DRS, Inc.
Close page