PDF Version Oct 21, 2026 Third Quarter 2026 Net earnings of $78.1 million, or $0.44 per share Net interest margin expanded to 3.89% Return on average assets (“ROAA”) of 1.48% R****eturn on average tangible common equity (“ROATCE”)1 of 16.22% Ontario,…
PDF Version
Oct 21, 2026
Third Quarter 2026
-
Net earnings of $78.1 million, or $0.44 per share
-
Net interest margin expanded to 3.89%
-
Return on average assets (“ROAA”) of 1.48%
-
R****eturn on average tangible common equity (“ROATCE”)1 of 16.22%
Ontario, CA, Oct. 21, 2026 (GLOBE NEWSWIRE) -- CVB Financial Corp. (NASDAQ: CVBF) (“CVBF” or the “Company”) and its subsidiary, Citizens Business Bank, National Association (“Citizens” or the “Bank”), announced earnings for the quarter ended September 30, 2026.
CVB Financial Corp. reported net income of $78.1 million for the quarter ended September 30, 2026, compared with $48.3 million for the second quarter of 2026 and $52.6 million for the third quarter of 2025. Diluted earnings per share were $0.44 for the third quarter, compared to $0.29 for the prior quarter and $0.38 for the same period last year.
For the third quarter of 2026, annualized return on average equity (“ROAE”) was 9.70%, annualized ROATCE1 was 16.22%, and annualized ROAA was 1.48%.
David Brager, Chief Executive Officer of the Company, commented, “Our third-quarter results reflect solid financial performance, increased profitability, net interest margin expansion and disciplined expense management following the Heritage Bank of Commerce acquisition. The third quarter represented our 198th consecutive quarter of profitability. We remain focused on the integration, serving our customers and supporting our communities and associates as we extend our relationship-focused banking model across California’s major economic centers. We are grateful for the continued trust of our customers and the dedication of our associates.”
1 Non-U.S. generally accepted accounting principles (“GAAP”) financial measures. See GAAP to non–GAAP reconciliations of the measures are set forth at the last section of this press release.
Highlights for the Third Quarter of 2026
-
Earnings per share growth of 15.8% from Q3 of 2025
-
Net interest income increased $16.7 million, or 10.3% from Q2 of 2026
-
Net interest margin increased 17 basis points to 3.89% from Q2 of 2026
-
Adjusted ROAA of 1.59%2, excluding acquisition expense
-
Adjusted ROATCE of 17.38%2, excluding acquisition expense
-
Adjusted efficiency ratio2 of 42.10%, excluding acquisition expense
-
Acquisition related expenses declined to $8.1 million, compared with $31.4 million for Q2 of 2026
-
Loans increased $105.0 million, or 0.87% from the end of Q2 of 2026
-
Average loans increased by $476.7 million, 4.13% from Q2 2026
-
Recapture of credit losses of $1.0 million, compared with provision for credit losses of $1 million in Q3 of 2025
-
Average total deposit and customer repurchase agreements increased by $577.9 million, or 3.59% from Q2 of 2026
-
Noninterest-bearing deposits represented 53.5% of total deposits at quarter end
-
Repurchased $17.5 million of common stock during Q3 of 2026, bringing year-to-date repurchases to $22.6 million, or 1.0 million shares
2 Non-GAAP financial measures. See GAAP to non–GAAP reconciliations of the measures are set forth at the last section of this press release.
INCOME STATEMENT HIGHLIGHTS
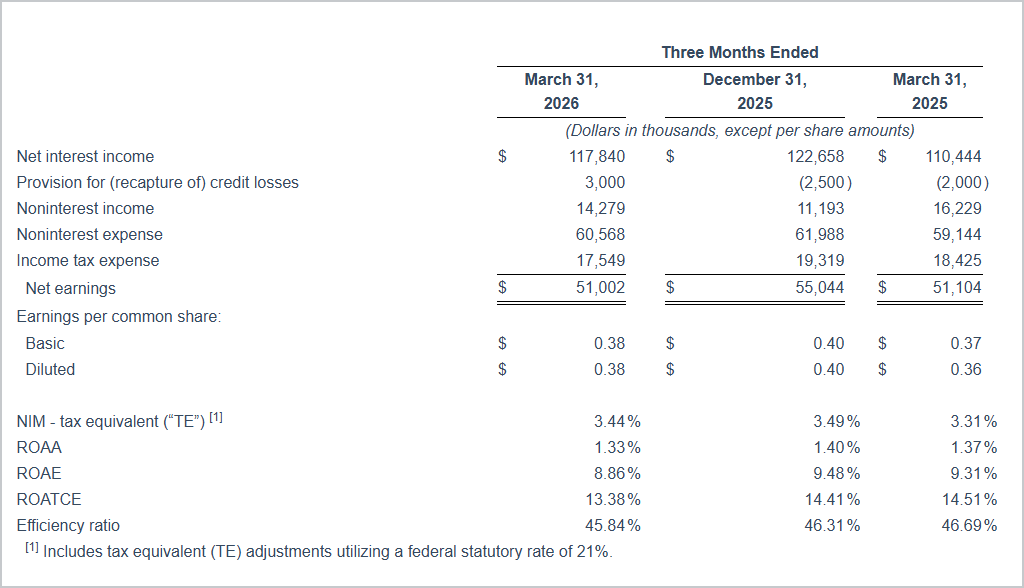
| | Three Months Ended | | | Nine Months Ended | |
| (Dollars in thousands, except per share amounts) | September 30, 2026 | | | June 30, 2026 | | | September 30, 2025 | | | September 30, 2026 | | | September 30, 2025 | |
| Net interest income | $ | 179,066 | | | $ | 162,415 | | | $ | 115,577 | | | $ | 459,321 | | | $ | 337,629 | |
| (Recapture of) provision for credit losses | | (1,000 | ) | | | — | | | | 1,000 | | | | 2,000 | | | | (1,000 | ) |
| Noninterest income | | 16,494 | | | | 17,010 | | | | 13,006 | | | | 47,783 | | | | 43,978 | |
| Noninterest expense | | 90,480 | | | | 114,378 | | | | 58,576 | | | | 265,426 | | | | 175,276 | |
| Income tax expense | | 27,982 | | | | 16,786 | | | | 16,421 | | | | 62,317 | | | | 53,077 | |
| Net earnings | $ | 78,098 | | | $ | 48,261 | | | $ | 52,586 | | | $ | 177,361 | | | $ | 152,254 | |
| Earnings per common share: | | | | | | | | | | | | | | |
| Basic | $ | 0.44 | | | $ | 0.29 | | | $ | 0.38 | | | $ | 1.11 | | | $ | 1.12 | |
| Diluted | $ | 0.44 | | | $ | 0.29 | | | $ | 0.38 | | | $ | 1.11 | | | $ | 1.11 | |
| | | | | | | | | | | | | | | |
| NIM - tax equivalent (“TE”) [1] | | 3.89 | % | | | 3.72 | % | | | 3.33 | % | | | 3.70 | % | | | 3.32 | % |
| ROAA | | 1.48 | % | | | 0.97 | % | | | 1.35 | % | | | 1.26 | % | | | 1.35 | % |
| ROAE | | 9.70 | % | | | 6.41 | % | | | 9.19 | % | | | 8.31 | % | | | 9.18 | % |
| ROATCE | | 16.22 | % | | | 10.85 | % | | | 14.11 | % | | | 13.55 | % | | | 14.23 | % |
| Efficiency ratio | | 46.27 | % | | | 63.75 | % | | | 45.56 | % | | | 52.34 | % | | | 45.93 | % |
| [1] Includes tax equivalent (TE) adjustments utilizing a federal statutory rate of 21%. |
| | | | | | | | | | | |
Net Interest IncomeNet interest income was $179.1 million for the third quarter of 2026, an increase of $16.7 million, or 10.25%, from the second quarter of 2026, and an increase of $63.5 million, or 54.93%, from the third quarter of 2025. The increases in net interest income compared to both periods largely reflect the full quarter impact of the Heritage acquisition, which closed on April 17, 2026. Interest income increased by $18.5 million, or 9.16%, from the second quarter of 2026, while interest expense increased by $1.9 million, or 4.71%, to $41.6 million in the third quarter of 2026. The quarter-over-quarter increase in net interest income was primarily due to a 17 basis point increase in tax equivalent net interest margin and a $891.9 million increase in average interest-earning assets.
Compared to the third quarter of 2025, the $63.5 million increase in net interest income was primarily attributable to a $70.5 million increase in interest income driven by a $4.58 billion increase in average interest-earning assets and a 47 basis point increase in the yield on average earning assets. The increase in interest income was offset by a $7.0 million increase in interest expense, primarily attributable to a $2.90 billion increase in average interest-bearing deposits and customer repurchase agreements.
Net Interest MarginOur tax equivalent net interest margin was 3.89% for the third quarter of 2026, compared to 3.72% for the second quarter of 2026 and 3.33% for the third quarter of 2025. The 17 basis point increase in our net interest margin compared to the second quarter of 2026 was primarily attributable to a 16 basis points increase in our average interest-earning assets yield, driven by a 23 basis points increase in our average investment securities yield and a 13 basis points increase in our average loan yield. Discount accretion for acquired loans was approximately $3.3 million in the third quarter of 2026, compared to $3.0 million in the second quarter of 2026. The increase in investment securities yield reflected the Company’s post merger balance sheet optimization strategy, which included repositioning the investment portfolio acquired from Heritage as well as deploying the proceeds from the sale of Heritage’s mortgage loan pools into higher-yielding securities. The increase in average loan yields was primarily driven by the full quarter impact of the higher-yielding acquired assets, including $103.4 million of average factored receivables, which generated an average yield of 17.21% during the quarter. Cost of funds remained stable at 0.96% for the third quarter of 2026, as a four basis point decrease in our cost of deposits from 0.83% in the second quarter to 0.79% in the third quarter of 2026 was offset by increases in Federal Home Loan Bank (“FHLB”) borrowings and associated costs of cash flow hedges that hedged brokered time deposits in prior quarters.
Compared to the third quarter of 2025, tax equivalent net interest margin for the third quarter of 2026 increased by 56 basis points, reflecting a 47 basis point increase in the average interest-earning assets yield and a nine basis point decrease in cost of funds. The increase in earning assets yield was primarily due to a 41 basis point increase in average loan yields, due to continuing impact of originating new loans at higher yields compared to the lower yields on principal payments and payoffs of older loans and the impact from the loans acquired from Heritage. The average yield on investment securities increased by 31 basis points from the third quarter of 2025, despite the impact of $1.5 million reduction in interest income from the fair value hedges of our investment securities available-for-sale ("AFS"), which generated a negative carry during the third quarter of 2026 compared to the positive carry recognized in the same quarter last year. Partially offsetting these increases was a 75 basis point lower yield on funds deposited at the Federal Reserve, reflecting the impact of Federal Open Market Committee (“FOMC”) rate cuts during the latter part of 2025. The 25 basis point increase in the federal funds target rate at the end of the third quarter of 2026 had minimal impact on the third quarter’s interest income. Cost of funds decreased to 0.96% in the third quarter of 2026 from 1.05% in the third quarter of 2025. This decrease was driven by a 45 basis point reduction in cost of interest-bearing deposits and a 23 basis point decrease in cost of FHLB advances. Partially offsetting these lower funding costs, was a less favorable deposit mix, as noninterest-bearing deposits declined as a percentage of average total deposits to 52.6% in the third quarter of 2026 from 59.3% in the third quarter of 2025.
Earning Assets and DepositsThe increases in average earning assets and average total deposits were primarily attributable to the full quarter’s impact of the Heritage acquisition. On average, earning assets increased by $891.9 million compared to the second quarter of 2026 and increased $4.58 billion compared to the third quarter of 2025. The quarter-over-quarter increase in interest-earning assets was primarily attributable to a $489.6 million increase in investment securities, a $476.7 million increase in average loans, partially offset with a decrease of $77.9 million in average interest-earning deposits at the Federal Reserve. The increase from the third quarter of 2025 in interest-earning assets was primarily attributable to a $3.65 billion increase in average loans, a $924.6 million increase in average investment securities, partially offset by a $45.1 million decrease in average interest-earning deposits at the Federal Reserve.
The average balance on noninterest-bearing deposits increased by $330.6 million, or 4.07%, from the second quarter of 2026 and by $1.33 billion, or 18.68%, from the third quarter of 2025. The average balance on interest-bearing deposits and customer repurchase agreements increased $247.2 million from the second quarter of 2026 and $2.86 billion from the third quarter of 2025. On average, noninterest-bearing deposits were 52.6% of total deposits for the third quarter of 2026, compared to 52.3% for the second quarter of 2026 and 59.3% for the third quarter of 2025.
SELECTED FINANCIAL HIGHLIGHTS
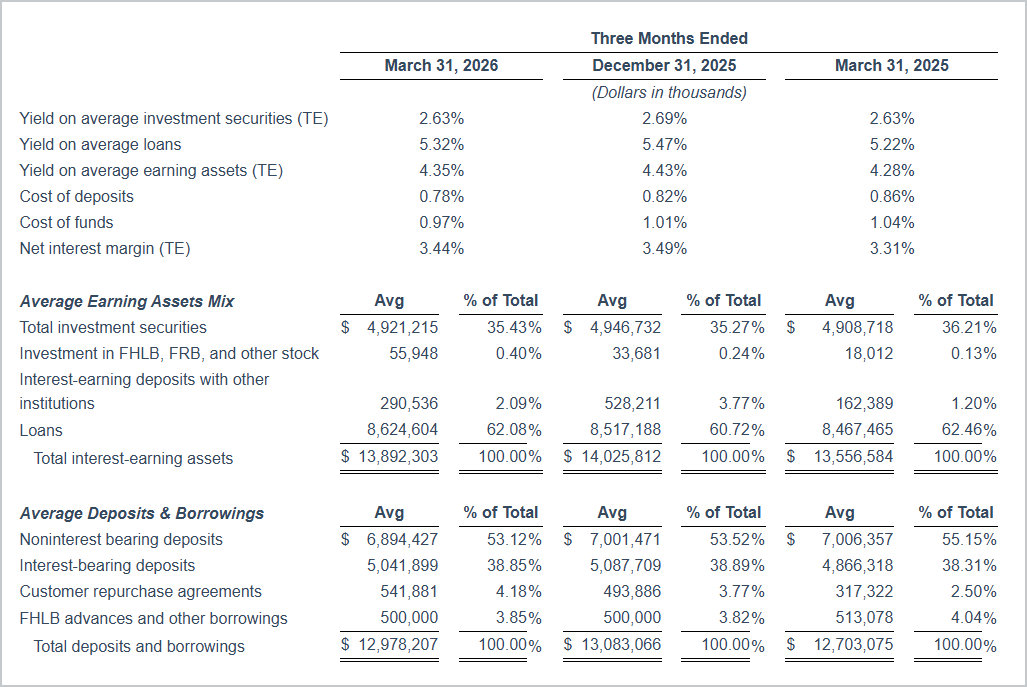
| | Three Months Ended |
| (Dollars in thousands) | September 30, 2026 | | | June 30, 2026 | | | September 30, 2025 | |
| Yield on average investment securities (TE) | 2.97% | | | 2.74% | | | 2.66% | |
| Yield on average loans | 5.66% | | | 5.53% | | | 5.25% | |
| Yield on average earning assets (TE) | 4.78% | | | 4.62% | | | 4.32% | |
| Cost of deposits | 0.79% | | | 0.83% | | | 0.86% | |
| Cost of funds | 0.96% | | | 0.96% | | | 1.05% | |
| Net interest margin (TE) | 3.89% | | | 3.72% | | | 3.33% | |
| | | | | | | | | | | | | | | |
| Average Earning Assets Mix | Avg | | | % of Total | | Avg | | | % of Total | | Avg | | | % of Total |
| Total investment securities | $ | 5,760,514 | | | | 31.21 | % | | $ | 5,270,895 | | | | 30.01 | % | | $ | 4,835,928 | | | | 34.86 | % |
| Investment in FHLB, FRB, and other stock | | 81,753 | | | | 0.44 | % | | | 77,891 | | | | 0.44 | % | | | 18,012 | | | | 0.13 | % |
| Interest-earning deposits with other institutions | | 590,860 | | | | 3.20 | % | | | 669,165 | | | | 3.81 | % | | | 646,979 | | | | 4.66 | % |
| Loans | | 12,024,828 | | | | 65.15 | % | | | 11,548,138 | | | | 65.74 | % | | | 8,372,383 | | | | 60.35 | % |
| Total interest-earning assets | $ | 18,457,955 | | | | 100.00 | % | | $ | 17,566,089 | | | | 100.00 | % | | $ | 13,873,302 | | | | 100.00 | % |
| | | | | | | | | | | | | | | |
| Average Deposits & Borrowings | Avg | | | % of Total | | Avg | | | % of Total | | Avg | | | % of Total |
| Noninterest bearing deposits | $ | 8,454,481 | | | | 49.14 | % | | $ | 8,123,844 | | | | 49.22 | % | | $ | 7,123,511 | | | | 54.91 | % |
| Interest-bearing deposits | | 7,613,314 | | | | 44.25 | % | | | 7,400,171 | | | | 44.84 | % | | | 4,893,214 | | | | 37.72 | % |
| Customer repurchase agreements | | 598,857 | | | | 3.48 | % | | | 564,766 | | | | 3.42 | % | | | 456,230 | | | | 3.52 | % |
| FHLB advances and other borrowings | | 500,440 | | | | 2.91 | % | | | 384,295 | | | | 2.33 | % | | | 500,005 | | | | 3.85 | % |
| Subordinated debentures | | 39,100 | | | | 0.22 | % | | | 31,993 | | | | 0.19 | % | | | — | | | | 0.00 | % |
| Total deposits and borrowings | $ | 17,206,192 | | | | 100.00 | % | | $ | 16,505,069 | | | | 100.00 | % | | $ | 12,972,960 | | | | 100.00 | % |
| | | | | | | | | | | | | | | | | | | | | | | | |
Provision for Credit LossesThe Company recorded a $1.0 million recapture of credit losses in the third quarter of 2026, compared to no provision for credit losses in the second quarter of 2026 and $1.0 million provision for credit losses in the third quarter of 2025.
Noninterest IncomeNoninterest income totaled $16.5 million for the third quarter of 2026, a decrease of $500,000 from $17.0 million for the second quarter of 2026 and an increase of $3.5 million from $13.0 million for the third quarter of 2025. The quarter-over-quarter decrease was primarily attributable to a $507,000 decrease in value of a CRA investment fund, a $359,000 decrease in trust and investment services income, and a $134,000 loss on the sale of two other real estate owned (“OREO”) properties, partially offset by a $580,000 increase in bank owned life insurance (“BOLI”) income and a $226,000 increase in service charges on deposit accounts. The year-over-year increase primarily reflected higher customer fee income and BOLI income resulting from the Heritage acquisition. Noninterest income in the third quarter of 2025 included $8.1 million in losses on the sale of AFS investments securities, partially offset by a $6.0 million legal settlement recorded in other income.
Noninterest ExpenseNoninterest expense totaled $90.5 million for the third quarter of 2026, compared to $114.4 million for the second quarter of 2026 and $58.6 million for the third quarter of 2025. Acquisition related expenses associated with the Heritage merger totaled $8.1 million in the third quarter of 2026, compared to $31.4 million for the second quarter of 2026. Excluding acquisition related expense and the $4.3 million provision for unfunded loan commitments recorded in the second quarter, noninterest expense increased by $3.6 million from the second quarter of 2026. This increase was primarily driven by a full quarter of operating expenses associated with the Heritage acquisition.
As a percentage of average assets, noninterest expense was 1.71% for the third quarter of 2026, compared to 2.31% for the second quarter of 2026 and 1.50% for the third quarter of 2025. The efficiency ratio was 46.27% for the third quarter of 2026, compared to 63.75% for the second quarter of 2026 and 45.56% for the third quarter of 2025. Excluding acquisition related expenses and the provision for unfunded loan commitments, the adjusted efficiency ratio3 was 42.10% for the third quarter of 2026, compared to 43.88% for the second quarter of 2026 and 45.56% for the third quarter of 2025.
Income TaxesOur effective tax rate for the quarter ended September 30, 2026 was 26.38%, compared with 25.81% for the second quarter of 2026 and 23.80% for the third quarter of 2025. Our estimated annual effective tax rate can vary depending upon the level of tax-advantaged income from municipal securities and BOLI, as well as tax credit investments.
3 Non-GAAP financial measures. See GAAP to non–GAAP reconciliations of the measures are set forth at the last section of this press release.
BALANCE SHEET HIGHLIGHTS
AssetsTotal assets were $20.52 billion at September 30, 2026, a decrease of $660.5 million, or 3.12%, from $21.18 billion at June 30, 2026. The decrease was primarily attributable to a $815.8 million decrease in interest-earning balances due from the Federal Reserve, partially offset by a $105.0 million increase in total loans and a $46.8 million increase in investment securities.
Total assets increased by $4.89 billion, or 31.29%, from $15.63 billion at December 31, 2025. The increase in assets was primarily driven by an increase of $3.42 billion in total loans, a $769.7 million increase in investment securities, partially offset by a $174.9 million decrease in interest-earnings balances due from the Federal Reserve.
Compared to September 30, 2025, total assets increased by $4.86 billion, or 31.00%, from $15.67 billion. The increase in assets was primarily driven by an increase of $3.65 billion in total loans, an increase of $845.8 million in investment securities, offset by a decrease of $538.1 million in interest-earning balances due from the Federal Reserve.
The increases in total assets compared to December 31, 2025 and September 30, 2025 primarily reflect the impact of the Heritage acquisition completed on April 17, 2026, partially offset by balance sheet optimization activities during the second quarter of 2026.
Investment SecuritiesTotal investment securities were $5.72 billion at September 30, 2026, an increase of $46.8 million, or 0.83%, from $5.68 billion at June 30, 2026, an increase of $769.7 million, or 15.54%, from December 31, 2025, and an increase of $845.8 million, or 17.34%, from $4.88 billion at September 30, 2025. The quarter-over-quarter increase in investment securities was primarily attributable to purchases of approximately $137.4 million of AFS securities and $6.2 million of held-to-maturity (“HTM”) securities.
The increase compared to December 31, 2025 and September 30, 2025 primarily reflected the result of the Heritage acquisition as well as the Company's post merger balance sheet optimization strategy.
At September 30, 2026, HTM investment securities totaled $2.20 billion, a decrease of $23.2 million, or 1.05%, from June 30, 2026, a decrease of $75.1 million, or 3.31%, from December 31, 2025, and a decrease of $102.6 million, or 4.47%, from September 30, 2025.
At September 30, 2026, AFS investment securities totaled $3.53 billion, inclusive of a pre-tax net unrealized loss of $439.0 million. AFS securities increased $70.1 million, or 2.03%, from June 30, 2026, $844.8 million, or 31.48%, from December 31, 2025, and $948.4 million, or 36.77%, from September 30, 2025. The pre-tax net unrealized loss at September 30, 2026 increased $115.5 million from June 30, 2026, $131.2 million from December 31, 2025 and $105.2 million from September 30, 2025. The increase in net unrealized losses was primarily attributable to changes in market interest rates during the quarter.
LoansTotal loans and leases, at amortized cost, were $12.12 billion at September 30, 2026, an increase of $105.0 million, or 0.87%, from $12.02 billion at June 30, 2026. The quarter-over-quarter increase was primarily due to increases of $60.8 million in dairy & livestock and agribusiness loans, $48.8 million in commercial real estate loans, $28.7 million in Small Business Administration (“SBA”) loans, $19.1 million in construction loans, partially offset by decreases of $39.1 million in commercial and industrial loans, $9.1 million in consumer and other loans, $2.9 million in single-family residential (“SFR”) mortgage loans, and $2.3 million in municipal lease finance receivables.
Total loans and leases, at amortized cost, increased by $3.42 billion, or 39.35%, from December 31, 2025. The increase primarily reflected increases of $2.46 billion in commercial real estate loans, $466.2 million in commercial and industrial loans, $191.2 million in construction loans, $187.9 million in SBA loans, $157.6 million in consumer and other loans, and $56.6 million in SFR mortgage loans. These increases were partially offset by decreases of $89.8 million in dairy & livestock and agribusiness loans, and $5.7 million in municipal lease finance receivables loans.
Total loans and leases, at amortized cost, increased by $3.65 billion, or 43.10%, from September 30, 2025. The $3.65 billion increase included increases of $2.50 billion in commercial real estate loans, $500.7 million in commercial and industrial loans, $204.1 million in SBA loans, $199.1 million in construction loans, $156.3 million in consumer loans, $52.3 million in SFR mortgage loans, $48.8 million in dairy & livestock and agribusiness loans, partially offset by a decrease of $7.6 million in municipal lease finance receivables.
The increase in total loans and leases compared to December 31, 2025 and September 30, 2025 primarily reflected the Heritage acquisition, which added $3.10 billion of loans held for investment recorded at fair value on the acquisition date.
Asset Quality
During the third quarter of 2026, the Company recorded net charge-offs of $20,000, compared to $137,000 in the second quarter of 2026. The allowance for credit losses (“ACL”) totaled $125.6 million at September 30, 2026, compared to $126.7 million at June 30, 2026 and $79.3 million at September 30, 2025. The $46.3 million year-over-year increase primarily reflected the initial ACL of $46.6 million established for the purchased credit deteriorated (“PCD”) loans and purchased seasoned loans (“PSL”) acquired from the Heritage acquisition. At September 30, 2026, the ACL represented 1.04% of total loans and leases, compared to 1.05% at June 30, 2026 and 0.94% at September 30, 2025.
Nonperforming loans are defined as nonaccrual loans, including modified loans on nonaccrual, plus loans 90 days or more past due and still accruing interest. Nonperforming assets are defined as nonperforming loans plus OREO. Asset quality metrics are presented below.
| (Dollars in thousands) | | September 30, 2026 | | | June 30, 2026 | | | September 30, 2025 | |
| Nonperforming loans | | | |
| Commercial real estate | | $ | 4,299 | | | $ | 4,905 | | | $ | 23,707 | |
| Construction | | | 685 | | | | 685 | | | | — | |
| SBA | | | 2,652 | | | | 918 | | | | 3,952 | |
| Commercial and industrial | | | 10,514 | | | | 9,672 | | | | 145 | |
| Dairy & livestock and agribusiness | | | — | | | | — | | | | — | |
| Consumer and other loans | | | 575 | | | | 462 | | | | — | |
| Total | | $ | 18,725 | | | $ | 16,642 | | | $ | 27,804 | |
| % of Total loans | | | 0.15 | % | | | 0.14 | % | | | 0.33 | % |
| | | | | | | | | | |
| OREO | | | | | | | | | |
| Commercial real estate | | $ | — | | | $ | 206 | | | $ | 661 | |
| Total | | $ | — | | | $ | 206 | | | $ | 661 | |
| | | | | | | | | | |
| Total nonperforming assets | | $ | 18,725 | | | $ | 16,848 | | | $ | 28,465 | |
| % of Nonperforming assets to total assets | | | 0.09 | % | | | 0.08 | % | | | 0.18 | % |
| | | | | | | | | | |
| Past due 30-89 days (accruing) | | | | | | | | | |
| Commercial real estate | | $ | 4,581 | | | $ | 2,762 | | | $ | 43 | |
| SBA | | | 11 | | | | 785 | | | | 42 | |
| Commercial and industrial | | | 500 | | | | 75 | | | | — | |
| SFR mortgage | | | 596 | | | | — | | | | — | |
| Consumer and other loans | | | — | | | | 123 | | | | — | |
| Total | | $ | 5,688 | | | $ | 3,745 | | | $ | 85 | |
| % of Total loans | | | 0.05 | % | | | 0.03 | % | | | 0.00 | % |
| Total nonperforming, OREO, and past due | | $ | 24,413 | | | $ | 20,593 | | | $ | 28,550 | |
| | | | | | | | | | |
| Classified Loans | | $ | 113,912 | | | $ | 109,718 | | | $ | 78,180 | |
| | | | | | | | | | | | | |
The $2.1 million increase in nonperforming loans from June 30, 2026 was primarily due to the addition of two nonperforming SBA loans totaling $1.7 million, and one commercial and industrial loan of $985,000, partially offset by the payoffs and paydowns.
Classified loans are loans that are graded “substandard” or worse. Classified loans increased $4.2 million from June 30, 2026, primarily due to the downgrade of two nonperforming commercial real estate loans totaling $5.1 million and two commercial and industrial loans totaling $2.1 million, partially offset by upgrades, payoffs and paydowns. The year-over-year increase primarily reflected the addition of $30.8 million of classified loans acquired in the Heritage merger.
Deposits & Customer Repurchase AgreementsDeposits of $15.73 billion and customer repurchase agreements of $571.9 million totaled $16.30 billion at September 30, 2026, compared to $16.85 billion at June 30, 2026, $12.56 billion at December 31, 2025, and $12.58 billion at September 30, 2025. Deposits and customer repurchase agreements decreased $550.0 million, or 3.26%, from June 30, 2026, increased $3.74 billion, or 29.77% from December 31, 2025, and $3.73 billion, or 29.63%, from September 30, 2025. The increases from December 31, 2025 and September 30, 2025 primarily reflected $1.2 billion of noninterest-bearing deposits and $3.5 billion of interest-bearing deposits assumed in connection with the Heritage acquisition completed during the second quarter of 2026.
Noninterest-bearing deposits were $8.42 billion at September 30, 2026, a decrease of $190.6 million, or 2.21%, compared to $8.61 billion at June 30, 2026. Noninterest-bearing deposits increased $1.62 billion, or 23.76%, from $6.80 billion at December 31, 2025 and $1.17 billion, or 16.17%, from $7.24 billion at September 30, 2025. At September 30, 2026, noninterest-bearing deposits were 53.50% of total deposits, compared to 52.84% at June 30, 2026, 56.33% at December 31, 2025, and 59.76% at September 30, 2025. The decrease in the percentage of noninterest-bearing deposits from December 31, 2025 and September 30, 2025 primarily reflected the deposit mix acquired in the Heritage acquisition, which included a higher proportion of interest-bearing deposits.
BorrowingsAs of September 30, 2026, total borrowings were $579.3 million, consisting of $540.0 million of FHLB advances and $39.3 million of subordinated debt assumed in the Heritage acquisition, compared to $539.0 million at June 30, 2026 and $500.0 million at December 31, 2025. At September 30, 2026, FHLB advances consisted of $300.0 million of 90 day advances hedged with cash flow hedges, under which the Company pays an average fixed rate of 4.22% and receives SOFR, a $200.0 million putable advance at a rate of 4.27% maturing in May 2027, and a $40.0 million overnight advance at a rate of 4.36%, which matured on October 1, 2026.
CapitalThe Company’s total equity was $3.13 billion at September 30, 2026, compared to $2.30 billion at December 31, 2025 and $2.28 billion at September 30, 2025. The increase of $835.1 million from December 31, 2025 was primarily due to $840.2 million of common shares issued in connection with the Heritage acquisition in the second quarter of 2026 and $177.4 million in net earnings, partially offset by $97.8 million in cash dividends declared and $22.7 million related to common stock repurchases. During the first nine months of 2026, the Company purchased approximately 1.0 million shares under the 2026 Repurchase Program, at an average price of $22.22 per share for an aggregate purchase price of $22.6 million, including $17.5 million repurchased during the third quarter of 2026.
Our tangible book value per share was $10.92 at September 30, 2026, compared to $11.07 at June 30, 2026, $11.24 at December 31, 2025 and $10.98 at September 30, 2025, respectively.
Our capital ratios remained well above applicable regulatory capital requirements.
| | | | | CVB Financial Corp. Consolidated |
| | | Minimum Required Plus Capital Conservation Buffer | | September 30, 2026 | | December 31, 2025 | | September 30, 2025 |
| Tier 1 leverage capital ratio | | 4.0% | | 11.2% | | 11.6% | | 11.8% |
| Common equity Tier 1 capital ratio | | 7.0% | | 14.8% | | 15.9% | | 16.3% |
| Tier 1 risk-based capital ratio | | 8.5% | | 14.8% | | 15.9% | | 16.3% |
| Total risk-based capital ratio | | 10.5% | | 15.7% | | 16.7% | | 17.1% |
| | | | | | | | | |
| Tangible common equity (“TCE”) ratio | | | | 9.9% | | 10.3% | | 10.1% |
| | | | | | | | | |
CitizensTrust
As of September 30, 2026, CitizensTrust had approximately $4.94 billion in assets under management and administration, including $3.81 billion in assets under management. Revenues were $3.8 million for the third quarter of 2026, compared to $4.2 million for the second quarter of 2026 and $3.9 million for the third quarter of 2025. CitizensTrust provides trust, investment and brokerage related services, as well as financial, estate and business succession planning.
Corporate OverviewCVB Financial Corp. (“CVBF”) is the holding company for Citizens Business Bank, National Association. CVBF is one of the ten largest bank holding companies headquartered in California with more than $20 billion in total assets as of the closing of the mergers with Heritage Commerce Corp and its principal banking subsidiary, Heritage Bank of Commerce. Citizens Business Bank, National Association, is consistently recognized as one of the top performing banks in the nation and offers a wide array of banking, lending and investing services with more than 75 banking centers and three trust office locations serving California.
Shares of CVB Financial Corp. common stock are listed on the NASDAQ under the ticker symbol “CVBF”. For investor information on CVB Financial Corp., visit our Citizens Business Bank website at www.cbbank.com and click on the “Investors” tab.
Conference Call
Management will hold a conference call at 7:30 a.m. PDT/10:30 a.m. EDT on Thursday, October 22, 2026, to discuss the Company’s third quarter 2026 financial results. The conference call can be accessed live by registering at: https://register-conf.media-server.com/register/BI4f86dd7673f14d1694c53fdb20ea376b
The conference call will also be simultaneously webcast over the Internet; please visit our Citizens Business Bank website at www.cbbank.com and click on the “Investors” tab to access the call from the site. Participants are encouraged to access the website at least 15 minutes prior to the start of the call to download any necessary audio software. The webcast will be archived and available for replay on the Company's website approximately two hours following the conclusion of the conference call.
Forward-Looking StatementsCertain statements set forth herein constitute forward-looking statements within the meaning of Section 27A of the Securities Act of 1933, as amended, and Section 21E of the Securities Exchange Act of 1934, as amended, which are intended to be covered by the safe harbor for "forward-looking statements" provided by the Private Securities Litigation Reform Act of 1995. Words such as “will likely result”, “aims”, “anticipates”, “believes”, “could”, “estimates”, “expects”, “hopes”, “intends”, “may”, “plans”, “projects”, “seeks”, “should”, “will,” “strategy”, “possibility”, and variations of these words and similar expressions help to identify these forward-looking statements, which involve risks and uncertainties that could cause actual results or performance to differ mlaterially from those projected. These forward-looking statements are based on management’s current expectations and beliefs concerning future developments and their potential effects on the Company including, without limitation, plans, strategies, goals and statements about the Company’s outlook regarding revenue and asset growth, financial performance and profitability, capital and liquidity levels, loan and deposit levels, growth and retention, yields and returns, loan diversification and credit management, shareholder value creation, tax rates, the impact of business, economic, or political developments, the impact of monetary, fiscal and trade policies, and the impact of acquisitions we have made or may make, including our recent acquisition of Heritage Commerce Corp and its wholly-owned banking subsidiary, Heritage Bank of Commerce (collectively “Heritage”). Such statements involve inherent risks and uncertainties, many of which are difficult to predict and are generally beyond the control of the Company, and there can be no assurance that future developments affecting the Company will be the same as those anticipated by management. The Company cautions readers that a number of important factors, in addition to those set forth below, could cause actual results to differ materially from those expressed in, or implied or projected by, such forward-looking statements.
General risks and uncertainties include, but are not limited to, the following: the strength of the United States economy and the strength of the local economies in which we conduct business; the effects of, and changes in, immigration, trade, tariff, monetary, and fiscal policies and laws, including interest rate policies of the Board of Governors of the Federal Reserve System; inflation/deflation, interest rate, market and monetary fluctuations; the effects of acquisitions we have made or may make, including, without limitation, the failure to achieve the expected efficiencies and financial results from such acquisitions; the timely development of competitive new products and services, and the acceptance of these products and services by potential and existing customers; the impact of changes in financial services policies, laws, and regulations, including those concerning banking, taxes, securities, and insurance, and the application thereof by regulatory agencies; changes in the scope and cost of Federal Deposit Insurance Corporation (“FDIC”) insurance; the effectiveness of our risk management framework and quantitative models; changes in the level of our nonperforming assets and charge-offs; the effect of changes in accounting policies and practices or accounting standards, as may be adopted from time-to-time by bank regulatory agencies, the U.S. Securities and Exchange Commission (“SEC”), the Public Company Accounting Oversight Board, the Financial Accounting Standards Board or other accounting standards setters; possible credit related impairments or declines in the fair value of loans and securities held by us; possible impairment charges to goodwill, including any impairment that may result from increased volatility in our stock price; changes in consumer or business spending, borrowing, and savings habits; the effects of risks associated with geographic and industry concentrations within our loan portfolio; periodic fluctuations in commercial or residential real estate prices or values; our ability to attract or retain deposits (including low cost deposits) or to access government or private lending facilities and other sources of liquidity; the possibility that we may reduce or discontinue the payment of dividends on our common stock; changes in the financial performance and/or condition of our borrowers or depositors; changes in the competitive environment among financial and bank holding companies and other financial service providers; technological changes, including the adoption of artificial intelligence, in banking and financial services; the use, reliability and accuracy of the financial models and data on which we rely; systemic or non-systemic bank failures or crises; geopolitical conditions, including acts or threats of terrorism, actions taken by the United States or other governments in response to acts or threats of terrorism, and/or military conflicts, which could impact business and economic conditions in the United States and abroad; catastrophic events or natural disasters, including earthquakes, drought, climate change or extreme weather events that may affect our assets, communications or computer services, customers, employees or third party vendors; public health crises and pandemics, and their effects on the economic and business environments in which we operate, including on our asset credit quality, business operations, and employees, as well as the impact on general economic and financial market conditions; cybersecurity threats and fraud and the costs of defending against them, including the costs of compliance with legislation or regulations to combat fraud and cybersecurity threats; our ability to recruit and retain key executives, board members and other employees, and our ability to comply with federal and state employment laws and regulations; ongoing or unanticipated regulatory or legal proceedings or outcomes; risks associated with our recently completed merger with Heritage, including difficulties in retaining Heritage’s customers, key personnel and business relationships, and achieving anticipated cost savings and revenue synergies; and our ability to manage the risks involved in the foregoing.
Additional factors that could cause actual results to differ materially from those expressed in the forward-looking statements are discussed in the Company's Annual Report on Form 10-K for the year ended December 31, 2025 and in subsequent filings filed with the SCE, including our quarterly reports on Form 10-Q, and in particular the discussion of "Risk Factors" set forth in such files. These filings are available at the SEC’s website (http://www.sec.gov).
The Company does not undertake, and specifically disclaims any obligation, to update any forward-looking statements to reflect occurrences or unanticipated events or circumstances after the date of such statements, except as required by law. Any statements about future operating results, such as those concerning accretion and dilution to the Company’s earnings, equity, or shareholder returns, are for illustrative purposes only, are not forecasts, and actual results may differ.
Non-GAAP Financial Measures — Certain financial information provided in this earnings release has not been prepared in accordance with GAAP and is presented on a non-GAAP basis. Investors and analysts should refer to the reconciliations included in this earnings release and should consider the Company’s non-GAAP measures in addition to, not as a substitute for or as superior to, measures prepared in accordance with GAAP. These non-GAAP measures may or may not be comparable to similarly titled measures used by other companies.
| CVB FINANCIAL CORP. AND SUBSIDIARIES | |
| CONDENSED CONSOLIDATED BALANCE SHEETS | |
| (Unaudited) | |
| | | | | | | | | | |
| (Dollars in thousands) | | September 30, 2026 | | | December 31, 2025 | | | September 30, 2025 | |
| Assets | | | | | | | | | |
| Cash and due from banks | | $ | 162,082 | | | $ | 107,511 | | | $ | 151,848 | |
| Interest-earning balances due from Federal Reserve | | | 93,980 | | | | 268,878 | | | | 632,072 | |
| Total cash and cash equivalents | | | 256,062 | | | | 376,389 | | | | 783,920 | |
| Interest-earning balances due from depository institutions | | | 490 | | | | 13,064 | | | | 13,163 | |
| Investment securities available-for-sale | | | 3,527,833 | | | | 2,683,070 | | | | 2,579,397 | |
| Investment securities held-to-maturity | | | 2,195,292 | | | | 2,270,391 | | | | 2,297,909 | |
| Total investment securities | | | 5,723,125 | | | | 4,953,461 | | | | 4,877,306 | |
| Investment in FHLB, FRB, and other stock | | | 81,921 | | | | 55,948 | | | | 18,012 | |
| Loans and lease finance receivables | | | 12,122,015 | | | | 8,699,193 | | | | 8,470,906 | |
| Allowance for credit losses | | | (125,641 | ) | | | (77,161 | ) | | | (79,336 | ) |
| Net loans and lease finance receivables | | | 11,996,374 | | | | 8,622,032 | | | | 8,391,570 | |
| Premises and equipment, net | | | 32,856 | | | | 26,505 | | | | 26,595 | |
| Bank owned life insurance (“BOLI”) | | | 418,119 | | | | 325,299 | | | | 323,881 | |
| Intangibles | | | 113,947 | | | | 5,774 | | | | 6,654 | |
| Goodwill | | | 1,099,936 | | | | 765,822 | | | | 765,822 | |
| Other assets | | | 799,363 | | | | 486,760 | | | | 459,283 | |
| Total assets | | $ | 20,522,193 | | | $ | 15,631,054 | | | $ | 15,666,206 | |
| Liabilities | | | | | | | | | |
| Deposits: | | | | | | | | | |
| Noninterest-bearing | | $ | 8,416,327 | | | $ | 6,800,691 | | | $ | 7,244,968 | |
| Investment checking | | | 1,023,199 | | | | 509,272 | | | | 487,738 | |
| Savings and money market | | | 5,710,066 | | | | 4,185,244 | | | | 3,809,768 | |
| Time deposits | | | 580,587 | | | | 576,775 | | | | 581,765 | |
| Total deposits | | | 15,730,179 | | | | 12,071,982 | | | | 12,124,239 | |
| Customer repurchase agreements | | | 571,884 | | | | 490,601 | | | | 451,258 | |
| Federal Home Loan Bank advances and other borrowings | | | 540,000 | | | | 500,000 | | | | 500,000 | |
| Subordinated debentures | | | 39,253 | | | | — | | | | — | |
| Other liabilities | | | 510,555 | | | | 273,247 | | | | 308,642 | |
| Total liabilities | | | 17,391,871 | | | | 13,335,830 | | | | 13,384,139 | |
| Stockholders' Equity | | | | | | | | | |
| Common Stock | | | 2,045,583 | | | | 1,222,365 | | | | 1,257,194 | |
| Retained Earnings | | | 1,380,074 | | | | 1,300,513 | | | | 1,272,649 | |
| Accumulated other comprehensive loss, net | | | (295,335 | ) | | | (227,654 | ) | | | (247,776 | ) |
| Total stockholders' equity | | | 3,130,322 | | | | 2,295,224 | | | | 2,282,067 | |
| Total liabilities and stockholders' equity | | $ | 20,522,193 | | | $ | 15,631,054 | | | $ | 15,666,206 | |
| CVB FINANCIAL CORP. AND SUBSIDIARIES | |
| CONDENSED CONSOLIDATED AVERAGE BALANCE SHEETS | |
| (Unaudited) | |
| | | | | | | | | | | | | | | | |
| | | Three Months Ended | | | Nine Months Ended | |
| (Dollars in thousands) | | September 30, 2026 | | | June 30, 2026 | | | September 30, 2025 | | | September 30, 2026 | | | September 30, 2025 | |
| Assets | | | | | | | | | | | | | | | |
| Cash and due from banks | | $ | 165,602 | | | $ | 168,621 | | | $ | 150,152 | | | $ | 159,817 | | | $ | 153,073 | |
| Interest-earning balances due from Federal Reserve | | | 590,207 | | | | 668,130 | | | | 635,331 | | | | 513,969 | | | | 377,976 | |
| Total cash and cash equivalents | | | 755,809 | | | | 836,751 | | | | 785,483 | | | | 673,786 | | | | 531,049 | |
| Interest-earning balances due from depository institutions | | | 653 | | | | 1,035 | | | | 11,648 | | | | 3,985 | | | | 6,232 | |
| Investment securities available-for-sale | | | 3,555,319 | | | | 3,034,877 | | | | 2,522,720 | | | | 3,086,918 | | | | 2,522,451 | |
| Investment securities held-to-maturity | | | 2,205,195 | | | | 2,236,018 | | | | 2,313,208 | | | | 2,233,698 | | | | 2,341,303 | |
| Total investment securities | | | 5,760,514 | | | | 5,270,895 | | | | 4,835,928 | | | | 5,320,616 | | | | 4,863,754 | |
| Investment in FHLB, FRB, and other stock | | | 81,753 | | | | 77,891 | | | | 18,012 | | | | 71,958 | | | | 18,012 | |
| Loans and lease finance receivables | | | 12,024,828 | | | | 11,548,138 | | | | 8,372,383 | | | | 10,744,979 | | | | 8,397,900 | |
| Allowance for credit losses | | | (126,638 | ) | | | (118,594 | ) | | | (78,161 | ) | | | (107,665 | ) | | | (78,837 | ) |
| Net loans and lease finance receivables | | | 11,898,190 | | | | 11,429,544 | | | | 8,294,222 | | | | 10,637,314 | | | | 8,319,063 | |
| Premises and equipment, net | | | 33,126 | | | | 33,177 | | | | 26,679 | | | | 31,089 | | | | 27,020 | |
| BOLI | | | 415,858 | | | | 398,014 | | | | 322,591 | | | | 380,297 | | | | 319,627 | |
| Intangibles | | | 116,459 | | | | 100,373 | | | | 7,111 | | | | 74,465 | | | | 8,278 | |
| Goodwill | | | 1,099,936 | | | | 1,041,190 | | | | 765,822 | | | | 970,207 | | | | 765,822 | |
| Other assets | | | 778,138 | | | | 692,558 | | | | 430,894 | | | | 649,265 | | | | 425,972 | |
| Total assets | | $ | 20,940,436 | | | $ | 19,881,428 | | | $ | 15,498,390 | | | $ | 18,812,982 | | | $ | 15,284,829 | |
| Liabilities | | | | | | | | | | | | | | | |
| Deposits: | | | | | | | | | | | | | | | |
| Noninterest-bearing | | $ | 8,454,481 | | | $ | 8,123,844 | | | $ | 7,123,511 | | | $ | 7,829,965 | | | $ | 7,060,953 | |
| Interest-bearing | | | 7,613,314 | | | | 7,400,171 | | | | 4,893,214 | | | | 6,694,547 | | | | 4,838,551 | |
| Total deposits | | | 16,067,795 | | | | 15,524,015 | | | | 12,016,725 | | | | 14,524,512 | | | | 11,899,504 | |
| Customer repurchase agreements | | | 598,857 | | | | 564,766 | | | | 456,230 | | | | 568,710 | | | | 383,903 | |
| Federal Home Loan Bank advances and other borrowings | | | 500,440 | | | | 384,295 | | | | 500,005 | | | | 461,581 | | | | 507,033 | |
| Subordinated debentures | | | 39,100 | | | | 31,993 | | | | — | | | | 23,841 | | | | — | |
| Other liabilities | | | 538,338 | | | | 356,655 | | | | 254,279 | | | | 380,759 | | | | 248,878 | |
| Total liabilities | | | 17,744,530 | | | | 16,861,724 | | | | 13,227,239 | | | | 15,959,403 | | | | 13,039,318 | |
| Stockholders' Equity | | | | | | | | | | | | | | | |
| Common Stock | | | 2,052,534 | | | | 1,887,018 | | | | 1,260,256 | | | | 1,723,575 | | | | 1,271,013 | |
| Retained Earnings | | | 1,384,128 | | | | 1,360,935 | | | | 1,278,189 | | | | 1,359,219 | | | | 1,255,923 | |
| Accumulated other comprehensive loss, net | | | (240,756 | ) | | | (228,249 | ) | | | (267,294 | ) | | | (229,215 | ) | | | (281,425 | ) |
| Total stockholders' equity | | | 3,195,906 | | | | 3,019,704 | | | | 2,271,151 | | | | 2,853,579 | | | | 2,245,511 | |
| Total liabilities and stockholders' equity | | $ | 20,940,436 | | | $ | 19,881,428 | | | $ | 15,498,390 | | | $ | 18,812,982 | | | $ | 15,284,829 | |
| CVB FINANCIAL CORP. AND SUBSIDIARIES | |
| CONDENSED CONSOLIDATED STATEMENTS OF EARNINGS | |
| (Unaudited) | |
| | | | | | | | | | | | | | | | |
| | | Three Months Ended | | | Nine Months Ended | |
| (Dollars in thousands, except per share amounts) | | September 30, 2026 | | | June 30, 2026 | | | September 30, 2025 | | | September 30, 2026 | | | September 30, 2025 | |
| Interest income | | | | | | | | | | | | | | | |
| Loans and leases, including fees | | $ | 171,500 | | | $ | 159,212 | | | $ | 110,825 | | | $ | 443,984 | | | $ | 328,741 | |
| Investment securities: | | | | | | | | | | | | | | | |
| Investment securities available-for-sale | | | 29,384 | | | | 23,229 | | | | 18,867 | | | | 72,013 | | | | 55,900 | |
| Investment securities held-to-maturity | | | 12,180 | | | | 12,322 | | | | 12,812 | | | | 36,968 | | | | 38,719 | |
| Total investment income | | | 41,564 | | | | 35,551 | | | | 31,679 | | | | 108,981 | | | | 94,619 | |
| Dividends from FHLB, FRB, and other stock | | | 2,039 | | | | 1,227 | | | | 377 | | | | 4,577 | | | | 1,167 | |
| Interest-earning deposits with other institutions | | | 5,546 | | | | 6,138 | | | | 7,231 | | | | 14,345 | | | | 12,796 | |
| Total interest income | | | 220,649 | | | | 202,128 | | | | 150,112 | | | | 571,887 | | | | 437,323 | |
| Interest expense | | | | | | | | | | | | | | | |
| Deposits | | | 31,965 | | | | 32,119 | | | | 26,096 | | | | 87,136 | | | | 76,247 | |
| Borrowings and customer repurchase agreements | | | 8,582 | | | | 6,707 | | | | 8,109 | | | | 23,261 | | | | 22,310 | |
| Subordinated debentures | | | 780 | | | | 639 | | | | — | | | | 1,419 | | | | — | |
| Other | | | 256 | | | | 248 | | | | 330 | | | | 750 | | | | 1,137 | |
| Total interest expense | | | 41,583 | | | | 39,713 | | | | 34,535 | | | | 112,566 | | | | 99,694 | |
| Net interest income before (recapture of) provision for credit losses | | | 179,066 | | | | 162,415 | | | | 115,577 | | | | 459,321 | | | | 337,629 | |
| (Recapture of) provision for credit losses | | | (1,000 | ) | | | — | | | | 1,000 | | | | 2,000 | | | | (1,000 | ) |
| Net interest income after (recapture of) provision for credit losses | | | 180,066 | | | | 162,415 | | | | 114,577 | | | | 457,321 | | | | 338,629 | |
| Noninterest income | | | | | | | | | | | | | | | |
| Service charges on deposit accounts | | | 5,562 | | | | 5,336 | | | | 4,859 | | | | 15,715 | | | | 14,726 | |
| Trust and investment services | | | 3,825 | | | | 4,184 | | | | 3,875 | | | | 11,733 | | | | 11,002 | |
| Loss on sale of AFS Investment Securities | | | — | | | | — | | | | (8,185 | ) | | | — | | | | (8,185 | ) |
| (Loss) gain on other real estate owned (“OREO”), net | | | (134 | ) | | | — | | | | — | | | | (134 | ) | | | 2,183 | |
| Other | | | 7,241 | | | | 7,490 | | | | 12,457 | | | | 20,469 | | | | 24,252 | |
| Total noninterest income | | | 16,494 | | | | 17,010 | | | | 13,006 | | | | 47,783 | | | | 43,978 | |
| Noninterest expense | | | | | | | | | | | | | | | |
| Salaries and employee benefits | | | 47,608 | | | | 46,568 | | | | 35,876 | | | | 131,637 | | | | 107,352 | |
| Occupancy and equipment | | | 8,510 | | | | 8,293 | | | | 5,823 | | | | 22,878 | | | | 17,927 | |
| Professional services | | | 3,708 | | | | 3,250 | | | | 2,350 | | | | 9,476 | | | | 6,622 | |
| Computer software expense | | | 5,744 | | | | 6,136 | | | | 4,350 | | | | 16,183 | | | | 12,981 | |
| Marketing and promotion | | | 2,692 | | | | 2,098 | | | | 1,738 | | | | 6,851 | | | | 5,543 | |
| Amortization of intangible assets | | | 3,980 | | | | 3,577 | | | | 1,003 | | | | 8,407 | | | | 3,312 | |
| Provision for unfunded loan commitments | | | — | | | | 4,250 | | | | 500 | | | | 4,750 | | | | 1,000 | |
| Acquisition related expenses | | | 8,140 | | | | 31,400 | | | | — | | | | 40,669 | | | | — | |
| Other | | | 10,098 | | | | 8,806 | | | | 6,936 | | | | 24,575 | | | | 20,539 | |
| Total noninterest expense | | | 90,480 | | | | 114,378 | | | | 58,576 | | | | 265,426 | | | | 175,276 | |
| Earnings before income taxes | | | 106,080 | | | | 65,047 | | | | 69,007 | | | | 239,678 | | | | 207,331 | |
| Income tax expense | | | 27,982 | | | | 16,786 | | | | 16,421 | | | | 62,317 | | | | 53,077 | |
| Net earnings | | $ | 78,098 | | | $ | 48,261 | | | $ | 52,586 | | | $ | 177,361 | | | $ | 154,254 | |
| | | | | | | | | | | | | | | | |
| Basic earnings per common share | | $ | 0.44 | | | $ | 0.29 | | | $ | 0.38 | | | $ | 1.11 | | | $ | 1.12 | |
| Diluted earnings per common share | | $ | 0.44 | | | $ | 0.29 | | | $ | 0.38 | | | $ | 1.11 | | | $ | 1.11 | |
| Cash dividends declared per common share | | $ | 0.20 | | | $ | 0.20 | | | $ | 0.20 | | | $ | 0.60 | | | $ | 0.60 | |
| CVB FINANCIAL CORP. AND SUBSIDIARIES | |
| SELECTED FINANCIAL DATA | |
| (Unaudited) | |
| | | | | | | | | | | | | | | | |
| | | | | | | | | | | | | | | | |
| | | Three Months Ended | | | Nine Months Ended | |
| (Dollars in thousands, except per share amounts) | | September 30, 2026 | | | June 30, 2026 | | | September 30, 2025 | | | September 30, 2026 | | | September 30, 2025 | |
| Interest income - tax equivalent (TE) | | $ | 221,282 | | | $ | 202,634 | | | $ | 150,626 | | | $ | 573,805 | | | $ | 438,879 | |
| Interest expense | | | 41,583 | | | | 39,713 | | | | 34,535 | | | | 112,566 | | | | 99,694 | |
| Net interest income - (TE) | | $ | 179,699 | | | $ | 162,921 | | | $ | 116,091 | | | $ | 461,239 | | | $ | 339,185 | |
| | | | | | | | | | | | | | | | |
| Return on average assets, annualized | | | 1.48 | % | | | 0.97 | % | | | 1.35 | % | | | 1.26 | % | | | 1.35 | % |
| Return on average equity, annualized | | | 9.70 | % | | | 6.41 | % | | | 9.19 | % | | | 8.31 | % | | | 9.18 | % |
| Efficiency ratio | | | 46.27 | % | | | 63.75 | % | | | 45.56 | % | | | 52.34 | % | | | 45.93 | % |
| Adjusted efficiency ratio [1] | | | 42.10 | % | | | 43.88 | % | | | 45.17 | % | | | 43.38 | % | | | 45.67 | % |
| Noninterest expense to average assets, annualized | | | 1.71 | % | | | 2.31 | % | | | 1.50 | % | | | 1.89 | % | | | 1.53 | % |
| Yield on average loans | | | 5.66 | % | | | 5.53 | % | | | 5.25 | % | | | 5.52 | % | | | 5.23 | % |
| Yield on average earning assets (TE) | | | 4.78 | % | | | 4.62 | % | | | 4.32 | % | | | 4.60 | % | | | 4.29 | % |
| Cost of deposits | | | 0.79 | % | | | 0.83 | % | | | 0.86 | % | | | 0.80 | % | | | 0.86 | % |
| Cost of deposits and customer repurchase agreements | | | 0.83 | % | | | 0.86 | % | | | 0.90 | % | | | 0.84 | % | | | 0.88 | % |
| Cost of funds | | | 0.96 | % | | | 0.96 | % | | | 1.05 | % | | | 0.96 | % | | | 1.04 | % |
| Net interest margin (TE) | | | 3.89 | % | | | 3.72 | % | | | 3.33 | % | | | 3.70 | % | | | 3.32 | % |
| | | | | | | | | | | | | | | | |
| TCE ratio [1] | | | | | | | | | | | | | | | |
| CVB Financial Corp. Consolidated | | | 9.93 | % | | | 9.78 | % | | | 10.14 | % | | | | | | |
| Citizens Business Bank, National Association | | | 9.59 | % | | | 9.47 | % | | | 10.00 | % | | | | | | |
| | | | | | | | | | | | | | | | |
| Weighted average shares outstanding | | | | | | | | | | | | | | | |
| Basic | | | 174,986,550 | | | | 167,038,874 | | | | 136,830,437 | | | | 159,076,268 | | | | 137,265,804 | |
| Diluted | | | 175,163,482 | | | | 167,186,423 | | | | 137,152,562 | | | | 159,220,729 | | | | 137,543,044 | |
| Dividends declared | | $ | 35,253 | | | $ | 35,350 | | | $ | 27,548 | | | $ | 97,800 | | | $ | 83,104 | |
| Dividend payout ratio [2] | | | 45.14 | % | | | 73.25 | % | | | 52.39 | % | | | 55.14 | % | | | 53.87 | % |
| | | | | | | | | | | | | | | | |
| Number of shares outstanding - (end of period) | | | 175,493,977 | | | | 176,247,135 | | | | 137,509,649 | | | | | | | |
| Book value per share | | $ | 17.84 | | | $ | 17.98 | | | $ | 16.60 | | | | | | | |
| Tangible book value per share [1] | | $ | 10.92 | | | $ | 11.07 | | | $ | 10.98 | | | | | | | |
| | | | | | | | | | | | | | | | |
| [1] Non-GAAP financial measures. See GAAP to non-GAAP reconciliations of the measures are set forth at the last section of this press release. |
| [2] Dividends declared on common stock divided by net earnings. | | | | | | | |
| CVB FINANCIAL CORP. AND SUBSIDIARIES | |
| NONPERFORMING ASSETS AND ALLOWANCE FOR CREDIT LOSSES | |
| (Unaudited) | |
| | | | | | | | | | | | | | | | |
| | | Three Months Ended | | | | |
| (Dollars in thousands) | | September 30, 2026 | | | December 31, 2025 | | | September 30, 2025 | | | | | | | |
| Nonperforming assets | | | | | | | | | | | | | | | |
| Nonaccrual loans | | $ | 18,725 | | | $ | 4,685 | | | $ | 27,804 | | | | | | | |
| Other real estate owned (“OREO”), net | | | — | | | | 163 | | | | 661 | | | | | | | |
| Total nonperforming assets | | $ | 18,725 | | | $ | 4,848 | | | $ | 28,465 | | | | | | | |
| Loan modifications to borrowers experiencing financial difficulty | | $ | 26,835 | | | $ | 16,902 | | | $ | 10,756 | | | | | | | |
| | | | | | | | | | | | | | | | |
| Percentage of nonperforming assets to total loans outstanding and OREO | | | 0.15 | % | | | 0.06 | % | | | 0.34 | % | | | | | | |
| Percentage of nonperforming assets to total assets | | | 0.09 | % | | | 0.03 | % | | | 0.18 | % | | | | | | |
| Allowance for credit losses to nonperforming assets | | | 670.98 | % | | | 1591.60 | % | | | 278.71 | % | | | | | | |
| | | | | | | | | | | | | | | | |
| | | Three Months Ended | | | Nine Months Ended | |
| | | September 30, 2026 | | | June 30, 2026 | | | September 30, 2025 | | | September 30, 2026 | | | September 30, 2025 | |
| Allowance for credit losses | | | | | | | | | | | | | | | |
| Balance at beginning of period | | $ | 126,661 | | | $ | 80,170 | | | $ | 78,003 | | | $ | 77,161 | | | $ | 80,122 | |
| Initial ACL on PCD and PSL loans acquired during the period | | | — | | | | 46,628 | | | | — | | | | 46,628 | | | | — | |
| Charge-offs | | | (20 | ) | | | (141 | ) | | | (67 | ) | | | (284 | ) | | | (536 | ) |
| Recoveries | | | — | | | | 4 | | | | 400 | | | | 136 | | | | 750 | |
| Net (charge-offs) recoveries | | | (20 | ) | | | (137 | ) | | | 333 | | | | (148 | ) | | | 214 | |
| (Recapture of) provision for credit losses | | | (1,000 | ) | | | — | | | | 1,000 | | | | 2,000 | | | | (1,000 | ) |
| Balance at end of period | | $ | 125,641 | | | $ | 126,661 | | | $ | 79,336 | | | $ | 125,641 | | | $ | 79,336 | |
| | | | | | | | | | | | | | | | |
| Net charge-offs to average loans | | | 0.000 | % | | | -0.001 | % | | | 0.004 | % | | | -0.001 | % | | | 0.003 | % |
| CVB FINANCIAL CORP. AND SUBSIDIARIES |
| ALLOWANCE FOR CREDIT LOSSES BY LOAN TYPE |
| (Unaudited) |
| | | | | | | | | | | | | | |
| | | September 30, 2026 | | December 31, 2025 | | September 30, 2025 |
| (Dollars in thousands) | | Allowance For Credit Losses | | Allowance as a % of Total Loans by Respective Loan Type | | Allowance For Credit Losses | | Allowance as a % of Total Loans by Respective Loan Type | | Allowance For Credit Losses | | Allowance as a % of Total Loans by Respective Loan Type |
| Commercial real estate | | $ | 75,410 | | | 0.83% | | $ | 61,661 | | | 0.94% | | $ | 65,394 | | | 1.00% |
| Construction | | | 2,537 | | | 1.11% | | | 593 | | | 1.57% | | | 522 | | | 1.74% |
| SBA | | | 4,555 | | | 0.97% | | | 2,720 | | | 0.96% | | | 2,580 | | | 0.97% |
| Commercial and industrial | | | 36,169 | | | 2.51% | | | 8,438 | | | 0.87% | | | 6,656 | | | 0.71% |
| Dairy & livestock and agribusiness | | | 3,638 | | | 1.06% | | | 2,486 | | | 0.58% | | | 2,791 | | | 0.95% |
| Municipal lease finance receivables | | | 210 | | | 0.39% | | | 251 | | | 0.42% | | | 224 | | | 0.36% |
| SFR mortgage | | | 526 | | | 0.16% | | | 442 | | | 0.16% | | | 493 | | | 0.17% |
| Consumer and other loans | | | 2,596 | | | 1.20% | | | 570 | | | 0.98% | | | 676 | | | 1.13% |
| Total | | $ | 125,641 | | | 1.04% | | $ | 77,161 | | | 0.89% | | $ | 79,336 | | | 0.94% |
| CVB FINANCIAL CORP. AND SUBSIDIARIES | |
| QUARTERLY COMMON STOCK PRICE AND QUARTERLY CONSOLIDATED STATEMENTS OF EARNINGS | |
| (Unaudited) | |
| | | | | | | | | | | | | | | | | | | |
| | | 2026 | | | 2025 | | | 2024 | |
| Quarter End | | High | | | Low | | | High | | | Low | | | High | | | Low | |
| March 31, | | $ | 21.48 | | | $ | 18.26 | | | $ | 21.71 | | | $ | 18.22 | | | $ | 20.45 | | | $ | 15.95 | |
| June 30, | | $ | 22.57 | | | $ | 19.17 | | | $ | 20.15 | | | $ | 16.01 | | | $ | 17.91 | | | $ | 15.71 | |
| September 30, | | $ | 23.41 | | | $ | 21.56 | | | $ | 21.34 | | | $ | 18.12 | | | $ | 20.29 | | | $ | 16.08 | |
| December 31, | | $ | — | | | $ | — | | | $ | 20.70 | | | $ | 17.95 | | | $ | 24.58 | | | $ | 17.20 | |
| | | | | | | | | | | | | | | | | | | |
| | | | | | | | | | | | | | | | | | | |
| | | | | | Q3 | | | Q2 | | | Q1 | | | Q4 | | | Q3 | |
| (Dollars in thousands, except per share amounts) | | | 2026 | | | 2026 | | | 2026 | | | 2025 | | | 2025 | |
| Interest income | | | | | | | | | | | | | | | | | | |
| Loans and leases, including fees | | | | | $ | 171,500 | | | $ | 159,212 | | | $ | 113,272 | | | $ | 117,415 | | | $ | 110,825 | |
| Investment securities and other | | | | | | 49,149 | | | | 42,916 | | | | 35,838 | | | | 38,564 | | | | 39,287 | |
| Total interest income | | | | | | 220,649 | | | | 202,128 | | | | 149,110 | | | | 155,979 | | | | 150,112 | |
| Interest expense | | | | | | | | | | | | | | | | | | |
| Deposits | | | | | | 31,965 | | | | 32,119 | | | | 23,052 | | | | 25,047 | | | | 26,096 | |
| Borrowings and customer repurchase agreements | | | | 8,582 | | | | 6,707 | | | | 7,972 | | | | 8,007 | | | | 8,109 | |
| Subordinated debentures | | | | 780 | | | | 639 | | | | — | | | | — | | | | — | |
| Other | | | | | | 256 | | | | 248 | | | | 246 | | | | 267 | | | | 330 | |
| Total interest expense | | | | | | 41,583 | | | | 39,713 | | | | 31,270 | | | | 33,321 | | | | 34,535 | |
| | | | | | | | | | | | | | | | | | | |
| Net interest income before (recapture of) provision for credit losses | | | | 179,066 | | | | 162,415 | | | | 117,840 | | | | 122,658 | | | | 115,577 | |
| (Recapture of) provision for credit losses | | | | (1,000 | ) | | | — | | | | 3,000 | | | | (2,500 | ) | | | 1,000 | |
| Net interest income after (recapture of) provision for credit losses | | | | 180,066 | | | | 162,415 | | | | 114,840 | | | | 125,158 | | | | 114,577 | |
| | | | | | | | | | | | | | | | | | | |
| Noninterest income | | | | | | 16,494 | | | | 17,010 | | | | 14,279 | | | | 11,193 | | | | 13,006 | |
| Noninterest expense | | | | | | 90,480 | | | | 114,378 | | | | 60,568 | | | | 61,988 | | | | 58,576 | |
| Earnings before income taxes | | | | | | 106,080 | | | | 65,047 | | | | 68,551 | | | | 74,363 | | | | 69,007 | |
| Income taxes | | | | | | 27,982 | | | | 16,786 | | | | 17,549 | | | | 19,319 | | | | 16,421 | |
| Net earnings | | | | | $ | 78,098 | | | $ | 48,261 | | | $ | 51,002 | | | $ | 55,044 | | | $ | 52,586 | |
| | | | | | | | | | | | | | | | | | | |
| Effective tax rate | | | | | | 26.38 | % | | | 25.81 | % | | | 25.60 | % | | | 25.98 | % | | | 23.80 | % |
| | | | | | | | | | | | | | | | | | | |
| Basic earnings per common share | | | | | $ | 0.44 | | | $ | 0.29 | | | $ | 0.38 | | | $ | 0.40 | | | $ | 0.38 | |
| Diluted earnings per common share | | | | | $ | 0.44 | | | $ | 0.29 | | | $ | 0.38 | | | $ | 0.40 | | | $ | 0.38 | |
| | | | | | | | | | | | | | | | | | | |
| Cash dividends declared per common share | | | | | $ | 0.20 | | | $ | 0.20 | | | $ | 0.20 | | | $ | 0.20 | | | $ | 0.20 | |
| | | | | | | | | | | | | | | | | | | |
| Cash dividends declared | | | | | $ | 35,253 | | | $ | 35,350 | | | $ | 27,197 | | | $ | 27,180 | | | $ | 27,548 | |
| CVB FINANCIAL CORP. AND SUBSIDIARIES | |
| LOAN PORTFOLIO BY TYPE | |
| (Unaudited) | |
| | | | | | | | | | | | | | | | |
| (Dollars in thousands) | | September 30, 2026 | | | June 30, 2026 | | | March 31, 2026 | | | December 31, 2025 | | | September 30, 2025 | |
| Commercial real estate | | $ | 9,032,741 | | | $ | 8,983,934 | | | $ | 6,631,238 | | | $ | 6,574,395 | | | $ | 6,535,319 | |
| Construction | | | 229,046 | | | | 209,993 | | | | 59,329 | | | | 37,812 | | | | 29,976 | |
| SBA | | | 470,293 | | | | 441,572 | | | | 291,702 | | | | 282,401 | | | | 266,279 | |
| Commercial and industrial | | | 1,439,834 | | | | 1,478,884 | | | | 952,260 | | | | 973,631 | | | | 939,174 | |
| Dairy & livestock and agribusiness | | | 341,801 | | | | 280,994 | | | | 314,838 | | | | 431,577 | | | | 292,963 | |
| Municipal lease finance receivables | | | 53,800 | | | | 56,086 | | | | 57,453 | | | | 59,542 | | | | 61,383 | |
| SFR mortgage | | | 338,394 | | | | 341,340 | | | | 278,214 | | | | 281,766 | | | | 286,111 | |
| Consumer and other loans | | | 216,106 | | | | 224,252 | | | | 58,282 | | | | 58,069 | | | | 59,701 | |
| Gross loans, at amortized cost | | | 12,122,015 | | | | 12,017,055 | | | | 8,643,316 | | | | 8,699,193 | | | | 8,470,906 | |
| Allowance for credit losses | | | (125,641 | ) | | | (126,661 | ) | | | (80,170 | ) | | | (77,161 | ) | | | (79,336 | ) |
| Net loans | | $ | 11,996,374 | | | $ | 11,890,394 | | | $ | 8,563,146 | | | $ | 8,622,032 | | | $ | 8,391,570 | |
| | | | | | | | | | | | | | | | |
| | |
| CVB FINANCIAL CORP. AND SUBSIDIARIES | |
| DEPOSIT COMPOSITION BY TYPE AND CUSTOMER REPURCHASE AGREEMENTS | |
| (Unaudited) | |
| | | | | | | | | | | | | | | | |
| (Dollars in thousands) | | September 30, 2026 | | | June 30, 2026 | | | March 31, 2026 | | | December 31, 2025 | | | September 30, 2025 | |
| Noninterest-bearing | | $ | 8,416,327 | | | $ | 8,606,924 | | | $ | 7,100,507 | | | $ | 6,800,691 | | | $ | 7,244,968 | |
| Investment checking | | | 1,023,199 | | | | 1,022,887 | | | | 497,609 | | | | 509,272 | | | | 487,738 | |
| Savings and money market | | | 5,710,066 | | | | 5,968,351 | | | | 3,802,623 | | | | 4,185,244 | | | | 3,809,768 | |
| Time deposits | | | 580,587 | | | | 690,539 | | | | 544,485 | | | | 576,775 | | | | 581,765 | |
| Total deposits | | | 15,730,179 | | | | 16,288,701 | | | | 11,945,224 | | | | 12,071,982 | | | | 12,124,239 | |
| Customer repurchase agreements | | | 571,884 | | | | 563,405 | | | | 494,257 | | | | 490,601 | | | | 451,258 | |
| Total deposits and customer repurchase agreements | | $ | 16,302,063 | | | $ | 16,852,106 | | | $ | 12,439,481 | | | $ | 12,562,583 | | | $ | 12,575,497 | |
| CVB FINANCIAL CORP. AND SUBSIDIARIES | |
| NONPERFORMING ASSETS AND DELINQUENCY TRENDS | |
| (Unaudited) | |
| | |
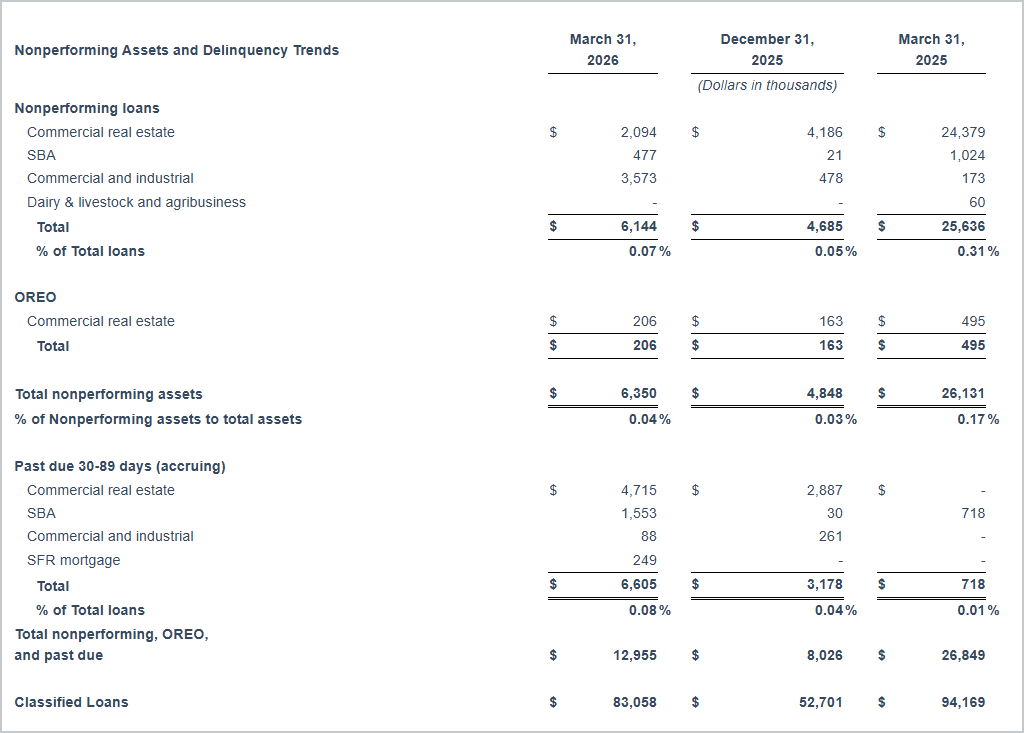
| (Dollars in thousands) | | September 30, 2026 | | | June 30, 2026 | | | March 31, 2026 | | | December 31, 2025 | | | September 30, 2025 | |
| Nonperforming loans | | | | | | | | | | | | | | | |
| Commercial real estate | | $ | 4,299 | | | $ | 4,905 | | | $ | 2,094 | | | $ | 4,186 | | | $ | 23,707 | |
| Construction | | | 685 | | | | 685 | | | | — | | | | — | | | | — | |
| SBA | | | 2,652 | | | | 918 | | | | 477 | | | | 21 | | | | 3,952 | |
| Commercial and industrial | | | 10,514 | | | | 9,672 | | | | 3,573 | | | | 478 | | | | 145 | |
| Dairy & livestock and agribusiness | | | — | | | | — | | | | — | | | | — | | | | — | |
| Consumer and other loans | | | 575 | | | | 462 | | | | — | | | | — | | | | — | |
| Total | | $ | 18,725 | | | $ | 16,642 | | | $ | 6,144 | | | $ | 4,685 | | | $ | 27,804 | |
| % of Total loans | | | 0.15 | % | | | 0.14 | % | | | 0.07 | % | | | 0.05 | % | | | 0.33 | % |
| | | | | | | | | | | | | | | | |
| Past due 30-89 days (accruing) | | | | | | | | | | | | | | | |
| Commercial real estate | | $ | 4,581 | | | $ | 2,762 | | | $ | 4,715 | | | $ | 2,887 | | | $ | 43 | |
| SBA | | | 11 | | | | 785 | | | | 1,553 | | | | 30 | | | | 42 | |
| Commercial and industrial | | | 500 | | | | 75 | | | | 88 | | | | 261 | | | | — | |
| SFR mortgage | | | 596 | | | | — | | | | 249 | | | | — | | | | — | |
| Consumer and other loans | | | — | | | | 123 | | | | — | | | | — | | | | — | |
| Total | | $ | 5,688 | | | $ | 3,745 | | | $ | 6,605 | | | $ | 3,178 | | | $ | 85 | |
| % of Total loans | | | 0.05 | % | | | 0.03 | % | | | 0.08 | % | | | 0.04 | % | | | 0.00 | % |
| | | | | | | | | | | | | | | | |
| OREO | | | | | | | | | | | | | | | |
| Commercial real estate | | $ | — | | | $ | 206 | | | $ | 206 | | | $ | 163 | | | $ | 661 | |
| Total | | $ | — | | | $ | 206 | | | $ | 206 | | | $ | 163 | | | $ | 661 | |
| Total nonperforming, past due, and OREO | | $ | 24,413 | | | $ | 20,593 | | | $ | 12,955 | | | $ | 8,026 | | | $ | 28,550 | |
| % of Total loans | | | 0.20 | % | | | 0.17 | % | | | 0.15 | % | | | 0.09 | % | | | 0.34 | % |
| CVB FINANCIAL CORP. AND SUBSIDIARIES |
| REGULATORY CAPITAL RATIOS |
| (Unaudited) |
| | | | | | | | | |
| | | Minimum Required | | CVB Financial Corp. Consolidated |
| | | Plus Capital Conservation Buffer | | September 30, 2026 | | December 31, 2025 | | September 30, 2025 |
| Tier 1 leverage capital ratio | | 4.0% | | 11.2% | | 11.6% | | 11.8% |
| Common equity Tier 1 capital ratio | | 7.0% | | 14.8% | | 15.9% | | 16.3% |
| Tier 1 risk-based capital ratio | | 8.5% | | 14.8% | | 15.9% | | 16.3% |
| Total risk-based capital ratio | | 10.5% | | 15.7% | | 16.7% | | 17.1% |
| | | | | | | | | |
GAAP TO NON-GAAP RECONCILIATIONSThe Company uses certain non-GAAP financial measures to provide supplemental information regarding the Company's operational performance and to enhance investors’ overall understanding of such financial performance. However, these non-GAAP financial measures are supplemental and are not a substitute for an analysis based on GAAP measures. As other companies may use different calculations for these adjusted measures, this presentation may not be comparable to other similarly titled adjusted measures reported by other companies.
**Pretax Pre-Provision Income (Non-GAAP)**Pretax pre-provision income is a Non-GAAP financial measure that represents total revenue less noninterest expense and is calculated before provision for credit losses and income tax expense. Management believes this measure provides useful information for comparing the results of operations between periods.
| | | Three Months Ended | | | Nine Months Ended | |
| (Dollars in thousands) | | September 30, 2026 | | | June 30, 2026 | | | September 30, 2025 | | | September 30, 2026 | | | September 30, 2025 | |
| Net Income | | $ | 78,098 | | | $ | 48,261 | | | $ | 52,586 | | | $ | 177,361 | | | $ | 154,254 | |
| Add: (Recapture of) provision for credit losses | | | (1,000 | ) | | | — | | | | 1,000 | | | | 2,000 | | | | (1,000 | ) |
| Add: Income tax expense | | | 27,982 | | | | 16,786 | | | | 16,421 | | | | 62,317 | | | | 53,077 | |
| Pretax pre-provision income | | $ | 105,080 | | | $ | 65,047 | | | $ | 70,007 | | | $ | 241,678 | | | $ | 206,331 | |
| | | | | | | | | | | | | | | | | | | | | |
**Adjusted Return on Average Assets Ratio (Non-GAAP)**Adjusted return on average assets ratio is a non-GAAP financial measure derived from GAAP-based amounts. This figure represents the ratio of net income, excluding acquisition related expense, adjusted for tax effect where applicable, to average assets. Management believes that the exclusion of such items from this financial measure provides useful information to gain an understanding of the operating results of our core business.
| | | Three Months Ended | | | Nine Months Ended | |
| (Dollars in thousands) | | September 30, 2026 | | | June 30, 2026 | | | September 30, 2025 | | | September 30, 2026 | | | September 30, 2025 | |
| Net Income | | $ | 78,098 | | | $ | 48,261 | | | $ | 52,586 | | | $ | 177,361 | | | $ | 154,254 | |
| Add: Acquisition related expenses | | | 8,140 | | | | 31,400 | | | | — | | | | 40,669 | | | | — | |
| Less: Tax effect (1) | | | (2,366 | ) | | | (9,127 | ) | | | — | | | | (11,821 | ) | | | — | |
| Adjusted net income for average assets | | $ | 83,872 | | | $ | 70,534 | | | $ | 52,586 | | | $ | 206,209 | | | $ | 154,254 | |
| | | | | | | | | | | | | | | | |
| Average Assets | | $ | 20,940,436 | | | $ | 19,881,428 | | | $ | 15,498,390 | | | $ | 18,812,982 | | | $ | 15,284,829 | |
| | | | | | | | | | | | | | | | |
| Return on average assets, annualized | | | 1.48 | % | | | 0.97 | % | | | 1.35 | % | | | 1.26 | % | | | 1.35 | % |
| Adjusted return on average assets, excluding acquisition related expenses, annualized | | | 1.59 | % | | | 1.42 | % | | | 1.35 | % | | | 1.47 | % | | | 1.35 | % |
| | | | | | | | | | | | | | | | |
| (1) Tax effected at respective statutory rates. | | | | | | | | | | | | | | | |
| | | | | | | | | | | | | | | | |
**Tangible Book Value and Tangible Common Equity Ratio (Non-GAAP)**The tangible book value per share and tangible common equity ratios are a Non-GAAP financial measures derived from GAAP-based amounts. The following is a reconciliation of tangible book value and tangible common equity to the Company stockholders' equity computed in accordance with GAAP, as well as a calculation of tangible book value per share and tangible common equity ratio.
| (Dollars in thousands, except per share amounts) | | September 30, 2026 | | | December 31, 2025 | | | September 30, 2025 | |
| CVB Financial Corp. and Subsidiaries | | | | | | | | | |
| Stockholders' equity | | $ | 3,130,322 | | | $ | 2,295,224 | | | $ | 2,282,067 | |
| Less: Goodwill | | | (1,099,936 | ) | | | (765,822 | ) | | | (765,822 | ) |
| Less: Intangible assets | | | (113,947 | ) | | | (5,774 | ) | | | (6,654 | ) |
| Tangible book value | | $ | 1,916,439 | | | $ | 1,523,628 | | | $ | 1,509,591 | |
| | | | | | | | | | |
| Total assets | | | 20,522,193 | | | | 15,631,054 | | | | 15,666,206 | |
| Less: Goodwill | | | (1,099,936 | ) | | | (765,822 | ) | | | (765,822 | ) |
| Less: Intangible assets | | | (113,947 | ) | | | (5,774 | ) | | | (6,654 | ) |
| Tangible assets | | $ | 19,308,310 | | | $ | 14,859,458 | | | $ | 14,893,730 | |
| | | | | | | | | | |
| Common shares issued and outstanding | | | 175,493,977 | | | | 135,551,799 | | | | 137,509,649 | |
| | | | | | | | | | |
| Book value per share | | $ | 17.84 | | | $ | 16.93 | | | $ | 16.60 | |
| Tangible book value per share | | $ | 10.92 | | | $ | 11.24 | | | $ | 10.98 | |
| Tangible common equity ratio | | | 9.93 | % | | | 10.25 | % | | | 10.14 | % |
| | | | | | | | | | |
| Citizens Business Bank, National Association | | | |
| Stockholders' equity | | $ | 3,065,282 | | | $ | 2,270,968 | | | $ | 2,262,447 | |
| Less: Goodwill | | | (1,099,936 | ) | | | (765,822 | ) | | | (765,822 | ) |
| Less: Intangible assets | | | (113,947 | ) | | | (5,774 | ) | | | (6,654 | ) |
| Tangible book value | | $ | 1,851,399 | | | $ | 1,499,372 | | | $ | 1,489,971 | |
| | | | | | | | | | |
| Total assets | | | 20,522,160 | | | | 15,634,835 | | | | 15,669,875 | |
| Less: Goodwill | | | (1,099,936 | ) | | | (765,822 | ) | | | (765,822 | ) |
| Less: Intangible assets | | | (113,947 | ) | | | (5,774 | ) | | | (6,654 | ) |
| Tangible assets | | $ | 19,308,277 | | | $ | 14,863,239 | | | $ | 14,897,399 | |
| | | | | | | | | | |
| Common shares issued and outstanding | | | 175,493,977 | | | | 135,551,799 | | | | 137,509,649 | |
| | | | | | | | | | |
| Book value per share | | $ | 17.47 | | | $ | 16.75 | | | $ | 16.45 | |
| Tangible book value per share | | $ | 10.55 | | | $ | 11.06 | | | $ | 10.84 | |
| Tangible common equity ratio | | | 9.59 | % | | | 10.09 | % | | | 10.00 | % |
| | | | | | | | | | | | | |
**Return on Average Tangible Common Equity (Non-GAAP)**The return on average tangible common equity is a non-GAAP disclosure. The following is a reconciliation of net income, adjusted for tax-effected amortization of intangibles, to net income computed in accordance with GAAP; a reconciliation of average tangible common equity to the Company's average stockholders' equity computed in accordance with GAAP; as well as a calculation of return on average tangible common equity.
| | | Three Months Ended | | | Nine Months Ended | |
| (Dollars in thousands) | | September 30, 2026 | | | June 30, 2026 | | | September 30, 2025 | | | September 30, 2026 | | | September 30, 2025 | |
| Net Income | | $ | 78,098 | | | $ | 48,261 | | | $ | 52,586 | | | $ | 177,361 | | | $ | 154,254 | |
| Add: Amortization of intangible assets | | | 3,980 | | | | 3,577 | | | | 1,003 | | | | 8,407 | | | | 3,312 | |
| Less: Tax effect (1) | | | (1,157 | ) | | | (1,040 | ) | | | (297 | ) | | | (2,444 | ) | | | (979 | ) |
| Tangible net income | | $ | 80,921 | | | $ | 50,798 | | | $ | 53,292 | | | $ | 183,324 | | | $ | 156,587 | |
| Add: Acquisition related expenses | | | 8,140 | | | | 31,400 | | | | — | | | | 40,669 | | | | — | |
| Less: Tax effect (1) | | | (2,366 | ) | | | (9,127 | ) | | | — | | | | (11,821 | ) | | | — | |
| Adjusted tangible net income | | $ | 86,695 | | | $ | 73,071 | | | $ | 53,292 | | | $ | 212,172 | | | $ | 156,587 | |
| | | | | | | | | | | | | | | | |
| Average stockholders' equity | | $ | 3,195,906 | | | $ | 3,019,704 | | | $ | 2,271,151 | | | $ | 2,853,579 | | | $ | 2,245,511 | |
| Less: Average goodwill | | | (1,099,936 | ) | | | (1,041,190 | ) | | | (765,822 | ) | | | (970,207 | ) | | | (765,822 | ) |
| Less: Average intangible assets | | | (116,459 | ) | | | (100,373 | ) | | | (7,111 | ) | | | (74,465 | ) | | | (8,278 | ) |
| Average tangible common equity | | $ | 1,979,511 | | | $ | 1,878,141 | | | $ | 1,498,218 | | | $ | 1,808,907 | | | $ | 1,471,411 | |
| | | | | | | | | | | | | | | | |
| Return on average equity, annualized | | | 9.70 | % | | | 6.41 | % | | | 9.19 | % | | | 8.31 | % | | | 9.18 | % |
| Return on average tangible common equity, annualized | | | 16.22 | % | | | 10.85 | % | | | 14.11 | % | | | 13.55 | % | | | 14.23 | % |
| Adjusted return on average tangible common equity, annualized | | | 17.38 | % | | | 15.61 | % | | | 14.11 | % | | | 15.68 | % | | | 14.23 | % |
| | | | | | | | | | | | | | | | |
| (1) Tax effected at respective statutory rates. | | | | | | | | | | | | | | | |
| | | | | | | | | | | | | | | | |
**Adjusted Efficiency Ratio (Non-GAAP)**Adjusted efficiency ratio is a non-GAAP financial measure derived from GAAP-based amounts. This figure represents the ratio of noninterest expense, less acquisition related expense and provision for unfunded loan commitments, where applicable, to the sum of net interest income before provision for credit losses and total noninterest income. Management believes that the exclusion of such items from this financial measure provides useful information to gain an understanding of the operating results of our core business.
| | | Three Months Ended | | | Nine Months Ended | |
| (Dollars in thousands) | | September 30, 2026 | | | June 30, 2026 | | | September 30, 2025 | | | September 30, 2026 | | | September 30, 2025 | |
| Total noninterest expense | | $ | 90,480 | | | $ | 114,378 | | | $ | 58,576 | | | $ | 265,426 | | | $ | 175,276 | |
| Less: Provision for unfunded loan commitments | | | — | | | | 4,250 | | | | 500 | | | | 4,750 | | | | 1,000 | |
| Less: Acquisition related expenses | | | 8,140 | | | | 31,400 | | | | — | | | | 40,669 | | | | — | |
| Adjusted noninterest expense | | $ | 82,340 | | | $ | 78,728 | | | $ | 58,076 | | | $ | 220,007 | | | $ | 174,276 | |
| | | | | | | | | | | | | | | | |
| Net interest income before provision for credit losses | | $ | 179,066 | | | $ | 162,415 | | | $ | 115,577 | | | $ | 459,321 | | | $ | 337,629 | |
| Add: total noninterest income | | | 16,494 | | | | 17,010 | | | | 13,006 | | | | 47,783 | | | | 43,978 | |
| Total revenue | | $ | 195,560 | | | $ | 179,425 | | | $ | 128,583 | | | $ | 507,104 | | | $ | 381,607 | |
| | | | | | | | | | | | | | | | |
| Efficiency ratio | | | 46.27 | % | | | 63.75 | % | | | 45.56 | % | | | 52.34 | % | | | 45.93 | % |
| Adjusted efficiency ratio, excluding provision for unfunded loan commitments and acquisition related expenses | | | 42.10 | % | | | 43.88 | % | | | 45.17 | % | | | 43.38 | % | | | 45.67 | % |
| | | | | | | | | | | | | | | | | | | | | |







 Not Bank Guaranteed