Download as PDF February 09, 2026 Beloved brand full of fashion, friendship, and fun delights a new generation of kids, and the parents who grew up loving them GONZALES, Louisiana, Feb. 09, 2026 (GLOBE NEWSWIRE) -- Crown Crafts, Inc. (NASDAQ-CM:…
Download as PDF
February 09, 2026
Beloved brand full of fashion, friendship, and fun delights a new generation of kids, and the parents who grew up loving them
GONZALES, Louisiana, Feb. 09, 2026 (GLOBE NEWSWIRE) -- Crown Crafts, Inc. (NASDAQ-CM: CRWS) (the “Company”) today announced that its Manhattan Toy® brand’s Groovy Girls, the iconic soft fashion dolls that sparked joy and self-expression for a generation, are back! Launching at the North American International Toy Fair, the new Groovy Girls collection features fresh designs and diverse characters that celebrate confidence, creativity, and inclusive play.
Originally introduced in the late 1990s, Groovy Girls quickly became a favorite for their bold styles, soft construction, wholesome play, and celebration of individuality. Now, they’re reimagined for today’s kids, and for the Millennial and Gen Z parents who remember the fun and funky originals. Each doll is uniquely designed with vibrant hairstyles, diverse skin tones, and fashion-forward outfits while still embracing the brand’s original soft, huggable form and groovy spirit.
“Groovy Girls have always been more than just dolls, they’re characters that kids connect with, stories waiting to be told,” said Kelly Anderson, Vice President of Marketing of Sassy Baby, Inc. (“Sassy”), a wholly-owned subsidiary of the Company. “We’ve designed this new collection to reflect the world kids see around them today - full of diversity, color, and possibility - while keeping the playful essence that made Groovy Girls so popular in the first place.”
The Groovy Girls doll collection includes five keepsake dolls, each with her own unique style and personality. Every posable soft doll features stylable hair, removable, fashionable outfits that are collectible, and new magnetic hands for interactive play. Dolls are crafted for children aged 3 to 6 with a suggested retail price of $29.99 each, and will be available starting May 2026:
-
Rose: A star athlete and a total style icon! Whether she’s crossing the finish line or hanging out with her friends, she loves rocking outfits that move with her through every activity. She may not win every race, but she is always looking to grow, improve, and cheer on others along the way. With a competitive spirit and a love for teamwork, Rose is always ready to lift others up while chasing her own dreams!
-
Saige: A sweetheart with endless energy and a soft spot for all things furry, Saige is always on the go – whether with her built-in bestie, her mom, or a four-legged friend. Dressed in comfy-cute leisure gear, she views every day as an adventure and smiles through life with confidence and charisma. From the playground to the dog park, Saige makes new friends wherever she goes.
-
Poppy: Top of her class and always ready to lend a helping hand. Whether she's tutoring younger students or solving tricky homework problems, she's your go-to girl for answers and encouragement. Her signature schooltime-chic style is as polished as her report card and perfect for moving from the classroom to after-school fun with friends. With a passion for learning and a heart for helping others, Poppy is proof that smart is seriously stylish!
-
Iris: All about fun, flair, and everything pink! She twirls through life in her favorite tutu, always ready for a spontaneous dance party filled with spins, leaps, and laughter. Her half-up hairstyle is tied with a sweet bow, keeping her look perfectly in place no matter where the day takes her. With a free spirit and a heart full of adventure, Iris brings her own sparkle to every moment because being bold, bright, and true to herself is what she does best!
-
Daisy: With a heart as warm as the sunshine! Daisy spends her days tending flowers in her garden, making friends with the animals who stop by, and sharing the joy of nature with everyone she meets. Dressed in her favorite floral overalls and trusty rain boots, she’s always ready for a day filled with planting, creating, and enjoying the warmth of the sun. Whether she’s picking wildflowers for her friends or introducing them to her furry companions, Daisy feels most like herself when she’s connected to the world around her.
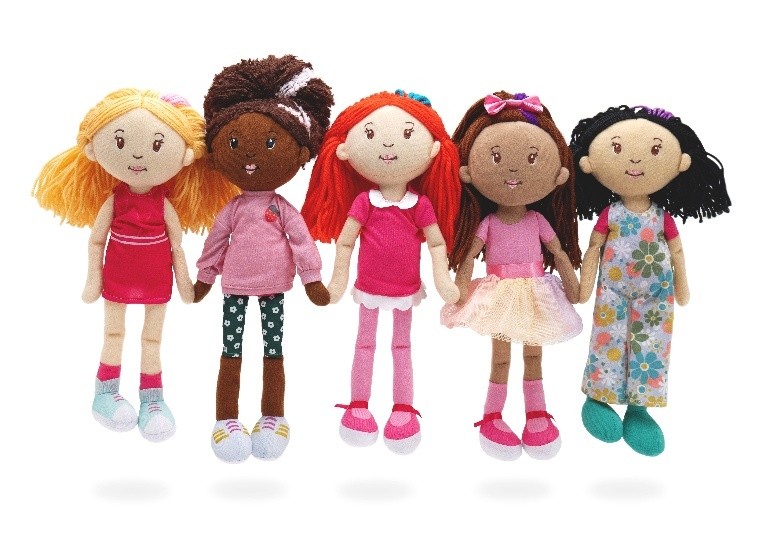
The new Groovy Girls doll collection, featuring (from left) Rose, Saige, Poppy, Iris, and Daisy,
will be available beginning in May 2026 at specialty retailers and manhattantoy.com
.
In addition to the dolls, the Groovy Girl collection will feature a range of outfits and accessories that inspire creative, open-ended play. The accessory line includes funky fan favorites, including pets, camping gear, and furniture, along with some exciting new introductions – each with magnetic features compatible with the dolls to inspire interactive play. The Groovy Girls collection of dolls and accessories will be available at specialty retailers and manhattantoy.com
.
The new Groovy Girls collection of dolls will make its debut at Toy Fair New York, February 14-17, in booth 2206 at the Javits Center. Attending media can contact Kelly Anderson, Vice President of Marketing, at [email protected]
to schedule an appointment.
About Manhattan Toy®
Manhattan Toy®, a brand of Sassy Baby, Inc., offers a wide variety of award-winning toys, dolls, plush, and wooden activity toys designed to help young children learn through the experience of play. We believe that play is essential for a child's cognitive, emotional, and social development and that imagination is the most powerful tool for play.
About Crown Crafts, Inc.
Crown Crafts, Inc. designs, markets and distributes infant, toddler and juvenile consumer products. Founded in 1957, Crown Crafts is one of America’s largest producers of infant bedding, toddler bedding, diaper bags, bibs, toys and disposable products. The Company operates through its wholly owned subsidiaries, NoJo Baby & Kids, Inc. and Sassy Baby, Inc., which market a variety of infant, toddler, and juvenile products under Company-owned trademarks (Sassy®, Manhattan Toy®, NoJo®, Baby Boom® and Neat Solutions®), as well as licensed collections and exclusive private label programs. Sales are made directly to retailers such as mass merchants, large chain stores, juvenile specialty stores, value channel stores, grocery and drug stores, restaurants, wholesale clubs, internet-based retailers and directly to consumers through the Company’s websites. For more information visit the Company’s website at www.crowncrafts.com
.
Forward-Looking Statements
The foregoing contains forward-looking statements within the meaning of the Securities Act of 1933, the Securities Exchange Act of 1934 and the Private Securities Litigation Reform Act of 1995. Such statements are based upon management’s current expectations, projections, estimates and assumptions. Words such as “expects,” “believes,” “anticipates” and variations of such words and similar expressions identify such forward-looking statements. Forward-looking statements involve known and unknown risks and uncertainties that may cause future results to differ materially from those suggested by the forward-looking statements. These risks include, among others, general economic conditions, including the impact of newly imposed or threatened U.S. tariffs and any additional retaliatory measures by impacted exporting countries, and the Company’s ability to mitigate the impact of such tariffs; changes in interest rates, in the overall level of consumer spending and in the price of oil, cotton and other raw materials used in the Company’s products, changing competition, changes in the retail environment, the Company’s ability to successfully integrate newly acquired businesses, the level and pricing of future orders from the Company’s customers, the extent to which the Company’s business is concentrated in a small number of customers, the Company’s dependence upon third-party suppliers, including some located in foreign countries, customer acceptance of both new designs and newly-introduced product lines, actions of competitors that may impact the Company’s business, disruptions to transportation systems or shipping lanes used by the Company or its suppliers, and the Company’s dependence upon licenses from third parties. Reference is also made to the Company’s periodic filings with the Securities and Exchange Commission for additional factors that may impact the Company’s results of operations and financial condition. The Company does not undertake to update the forward-looking statements contained herein to conform to actual results or changes in our expectations, whether as a result of new information, future events or otherwise.