March 5, 2026 ‒ Q4 2025 Net Revenue of $128.6 million ‒ ‒ Pro Forma Full Year 2025 Net Revenue of $401.3 million ‒ ‒ Q4 2025 Net Income of $14.0 million; Adjusted EBITDA of $77.2 million ‒ ‒ Conference Call Scheduled for Today at 8:30 a.m. Eastern…
March 5, 2026
‒ Q4 2025 Net Revenue of $128.6 million ‒
‒ Pro Forma Full Year 2025 Net Revenue of $401.3 million ‒
‒ Q4 2025 Net Income of $14.0 million; Adjusted EBITDA of $77.2 million ‒
‒ Conference Call Scheduled for Today at 8:30 a.m. Eastern Time ‒
Parsippany, NJ – March 5, 2026 – CorMedix Inc. (Nasdaq: CRMD), a biopharmaceutical company focused on developing and commercializing therapeutic products for life-threatening diseases and conditions, today announced financial results for the fourth quarter and full-year ended December 31, 2025 and provided an update on its business.
Recent Corporate Highlights:
- CorMedix announces $128.6 million of net revenue for the fourth quarter of 2025, largely driven by continued utilization of DefenCath by its outpatient dialysis customers. DefenCath sales contributed $91.2 million of net revenue in the quarter.
- For the full-year 2025, CorMedix achieved total revenue of $311.7 million and pro forma total revenue of $401.3 million.(1)
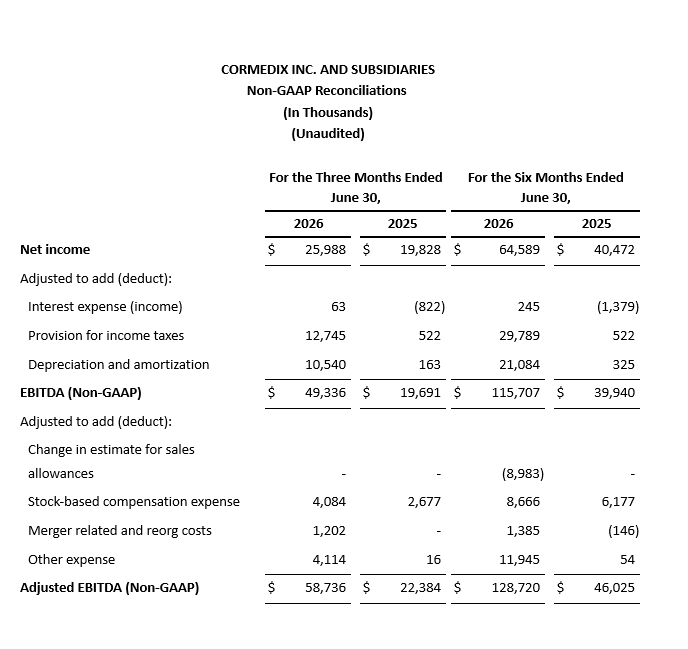
- In the fourth quarter of 2025, the Company recognized Net Income of $14.0 million and adjusted EBITDA of $77.2 million.(2) Basic and Fully Diluted EPS were $0.18 and $0.16 per share, respectively.
- CorMedix reiterates previously established guidance for 2026, including net revenue of between $300 and $320 million and adjusted EBITDA of between $100 and $125 million.
- CorMedix announced in early February that its Board of Directors approved a share repurchase program, which authorizes the Company to repurchase up to $75 million of the Company’s outstanding common stock.
- As highlighted during the Company’s recent Analyst Day, CorMedix expects clinical data from the Phase 3 ReSPECT study of REZZAYO® (rezafungin for injection) in the prophylaxis of invasive fungal infections in adult patients undergoing allogeneic blood and marrow transplant in Q2 2026. In addition, the ongoing Phase 3 study of taurolidine/heparin catheter lock solution in TPN patients continues to enroll patients with targeted completion in the first half of 2027.
- Cash and short-term investments, excluding restricted cash, at December 31, 2025 amounted to $148.5 million.
Joe Todisco, CorMedix Chairman and CEO, commented, “I am proud of the Company’s progress over the past year as we have accelerated the expansion of patient access for DefenCath, completed our acquisition and integration of Melinta, and saw progress in our two ongoing Phase 3 clinical programs for Rezzayo prophylaxis and DefenCath in TPN. With the announcement of our share repurchase program and multiple near-term milestones on the horizon, most notably the Rezzayo ReSPECT phase III data, CorMedix is focused on driving business growth and shareholder value over the year ahead.”
Fourth Quarter and Full Year 2025 Financial Highlights
For the fourth quarter of 2025, CorMedix recorded $128.6 million in net revenue, comprised of $91.2 million in sales of DefenCath and $37.4 million in revenue associated with the Melinta portfolio, an increase from $31.2 million in net revenue in the comparable period of 2024. The fourth quarter of 2025 was the first full quarter of Melinta portfolio revenue after the closing of the acquisition in August 2025.
Total operating expenses in the fourth quarter of 2025 were $48.2 million, compared with $17.1 million in the fourth quarter of 2024, an increase of approximately 182%. The increase of $31.1 million over the prior period was driven primarily by the contribution of operating expenses from the Melinta acquisition for the full quarter. Fourth quarter 2025 operating expenses also included $4.1 million of non-recurring costs, including severance and other integration-related costs associated with the Melinta acquisition. Other drivers of increases year-over-year include stock-based compensation and investment in research and development programs associated with expanded indications for DefenCath, including the Phase III clinical study for prevention of CLABSI in TPN.
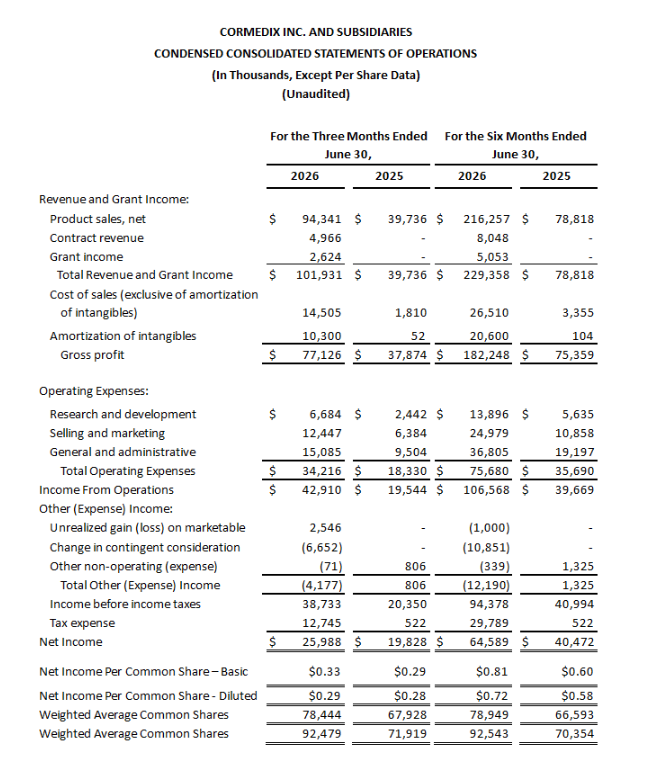
For the fourth quarter of 2025, the Company recorded $14.0 million in net income, or $0.16 per diluted share, compared with net income of $13.5 million, or $0.20 per diluted share, in the fourth quarter of 2024. Net income for the fourth quarter of 2025 included tax expense, primarily associated with the utilization of the Company’s deferred tax assets, of $42.4 million. These deferred tax assets were established in the third quarter of 2025 and are associated with the anticipated future use of CorMedix Net Operating Loss (NOL) carryforwards due to projected future sustained profitability of the Company. Also for the fourth quarter of 2025, CorMedix reported Adjusted EBITDA of $77.2 million, compared to adjusted EBITDA of $15.3 million in the fourth quarter of 2024.
For the year ended December 31, 2025, CorMedix recorded $311.7 million in total revenue, including $258.8 million in net sales of DefenCath and $52.9 million in net revenue from the legacy Melinta portfolio. Pro forma 2025 revenue, which reflects full-year revenue from the Melinta portfolio in addition to full-year net sales of DefenCath, was $401.3 million. The Company reported net income of $163.0 million, or $2.04 per diluted share, compared with a net loss of $17.9 million, or ($0.30) per share, in 2024. Net income was driven primarily by an increase in sales of DefenCath, and, to a lesser extent, net revenue from the acquisition of Melinta, partially offset by higher operating expenses.
Operating expenses during the year ended December 31, 2025 totaled $125.6 million compared with $62.6 million for 2024, an increase of $63.0 million, or 101%. The increase over the prior year was driven primarily by the acquisition of Melinta, including the contribution of operating expenses from Melinta’s business for the period from August 29, 2025 through the end of the year as well as transaction, integration and severance costs. Other drivers of the year-over-year increase include stock-based compensation and investment in research and development programs associated with expanded indications for DefenCath, including the Phase III clinical study for prevention of CLABSI in TPN.
The Company reported cash, cash equivalents and short-term investments of $148.5 million at December 31, 2025, excluding restricted cash.
(1) Pro Forma Total Revenue was prepared by combining the financial results and for CorMedix and Melinta for the full fiscal year ended December 31, 2025, without further adjustment, as if the transaction had closed on January 1, 2025.
(2) Adjusted EBITDA is a non-GAAP financial measure and excludes non-cash items such as depreciation, amortization, stock-based compensation, interest and other income and expense, taxes and certain non-recurring items. See “Non-GAAP Financial Measures” on the following pages for additional information regarding the use of EBITDA and Adjusted EBITDA and a reconciliation to the most comparable GAAP measure.
**Conference Call Information
**
The management team of CorMedix will host a conference call and webcast today, March 5, 2026, at 8:30AM Eastern Time, to discuss recent corporate developments and financial results. Call details and dial-in information are as follows:
March 5, 2026 @ 8:30am ET
Domestic: 1-844-676-2922
International: 1-412-634-6840
Webcast: Webcast Link
About CorMedix
CorMedix Inc. is a biopharmaceutical company focused on developing and commercializing therapeutic products for the prevention and treatment of life-threatening conditions and diseases. CorMedix is commercializing DefenCath® (taurolidine and heparin) for the prevention of catheter-related bloodstream infections in adult patients undergoing hemodialysis via a central venous catheter. Following its August 2025 acquisition of Melinta Therapeutics LLC, CorMedix is also commercializing a portfolio of anti-infective products, including MINOCIN® (minocycline) for Injection, REZZAYO® (rezafungin), VABOMERE® (meropenem and vaborbactam), ORBACTIV™ (oritavancin), BAXDELA® (delafloxacin), and KIMYRSA® (oritavancin), as well as TOPROL-XL® (metoprolol succinate).
CorMedix has ongoing clinical studies for DefenCath in Total Parenteral Nutrition and Pediatric patient populations and also intends to develop DefenCath as a catheter lock solution for use in other patient populations. REZZAYO is currently approved for the treatment of candidemia and invasive candidiasis in adults, with an ongoing Phase III study for the prophylaxis of IFD in adult patients undergoing allogeneic BMT. Topline results of the Phase III study for REZZAYO are expected in Q2 2026. For more information visit: www.cormedix.com
.
Forward-Looking Statements
This press release contains “forward-looking statements” within the meaning of the Private Securities Litigation Reform Act of 1995, Section 27A of the Securities Act of 1933, as amended, and Section 21E of the Securities Exchange Act of 1934, as amended, as amended (the “Exchange Act”), that are subject to risks and uncertainties. Forward-looking statements are often identified by the use of words such as, but not limited to, “anticipate,” “believe,” “can,” “continue,” “could,” “estimate,” “expect,” “intend,” “may,” “plan,” “project,” “seek,” “should,” “target,” “will,” “would,” and similar expressions or variations intended to identify forward-looking statements. All statements, other than statements of historical facts, regarding management’s expectations, beliefs, goals, plans or CorMedix’s prospects should be considered forward-looking statements including, but not limited to statements regarding financial and business guidance; sales, revenue and operating expense estimates; synergy estimates and timing; accretion estimates; expectations regarding product utilization and product reimbursement rates; Adjusted EBITDA estimates; expectations and timing regarding clinical studies and real world studies and development; and expectations of CorMedix’s product pipeline. Readers are cautioned that actual results may differ materially from projections or estimates due to a variety of important factors, and readers are directed to the Risk Factors identified in CorMedix’s filings with the SEC, including its most recent Annual Report on Form 10-K, copies of which are available free of charge at the SEC’s website at www.sec.gov or upon request from CorMedix. CorMedix may not actually achieve the goals or plans described in its forward-looking statements, and such forward-looking statements speak only as of the date of this press release. In addition, pro forma financial information does not necessarily reflect the actual results that we would have achieved had the pro forma transaction been consummated as of the date indicated nor does it reflect the potential future results of the combined company. Investors should not place undue reliance on these statements. CorMedix assumes no obligation and does not intend to update these forward-looking statements, except as required by law.
Non-GAAP Financial Measures
This release includes certain non-GAAP financial measures, including EBITDA and adjusted EBITDA, which are intended as supplemental measures of the Company’s performance that are not required by or presented in accordance with GAAP. Management uses these non-GAAP measures internally to evaluate and manage the Company’s operations and to better understand its business because they facilitate a comparative assessment of the Company’s operating performance relative to its performance based on results calculated under GAAP. These non-GAAP measures also isolate the effects of some items that vary from period to period without any correlation to core operating performance and eliminate certain charges that management believes do not reflect the Company’s operations and underlying operational performance.
The Company believes that these non-GAAP measures also provide useful information to investors regarding certain financial and business trends relating to the Company’s financial condition and operating results, which facilitates an evaluation of the financial performance of the Company and its operations on a consistent basis. Providing this information therefore allows investors to make independent assessments of the Company’s financial performance, results of operations and trends while viewing the information through the eyes of management.
These non-GAAP measures are subject to limitations. The non-GAAP measures presented in this release may not be comparable to similarly titled measures used by other companies because other companies may not calculate one or more in the same manner. Additionally, the non-GAAP performance measures exclude significant expenses and income that are required by GAAP to be recorded in the Company’s financial statements; do not reflect changes in, or cash requirements for, working capital needs. Further, our historical adjusted results are not intended to project our adjusted results of operations or financial position for any future period. To compensate for these limitations, management presents and considers these non-GAAP measures in conjunction with the Company’s GAAP results; no non-GAAP measure should be considered in isolation from or as alternatives to any measure determined in accordance with GAAP. Readers should review the reconciliations included below, and should not rely on any single financial measure to evaluate the Company’s business.
Investor Contact:
Dan Ferry
Managing Director
LifeSci Advisors
[email protected]
(617) 430-7576


- 389 Interpace Pkwy, Suite 450
Parsippany, NJ 07054
- TEL +1 908-517-9500
- FAX +1 908-375-8272
CORMEDIX, the CORMEDIX logo and CORMEDIX INC. are registered trademarks of CorMedix Inc.
All other trademarks, registered or otherwise, are the property of their respective owner(s).
© 2026 CorMedix Inc., generally known as CorMedix Therapeutics. All rights reserved. US-CORP-0152 07/2026
You have clicked on an external link and will be taken offsite.
Would you like to proceed?
CONTINUE
Cancel