On October 29, 2026, Coinbase Global, Inc. (the “Company”) published a presentation related to its financial results for the quarter ended September 30, 2026 (the “Earnings Presentation”). The Company also announced that it will be holding a Q&A session to discuss its financial results for the quarter ended September 30, 2026. A copy of the Earnings Presentation is furnished as Exhibit 99.1 to this Current Report on Form 8-K. In addition to filings with the Securities and Exchange Commission, the Company uses its Investor Relations website (investor.coinbase.com), its blog (blog.coinbase.com), press releases, public conference calls and webcasts, its X feed (@coinbase), Brian Armstrong’s X feed (@brian_armstrong), its LinkedIn page, and its YouTube channel as means of disclosing material non-public information and for complying with its disclosure obligations under Regulation FD.
|
Coinbase Global, Inc. is a digital asset exchange and financial services platform that provides infrastructure for trading, custody, and settlement of crypto assets, equities, and derivatives. The company serves three primary customer groups: consumers, institutions, and developers. For consumers, it offers trading interfaces including Simple and Advanced trade, along with self-custodial wallet services via the Base App. Institutional clients access prime brokerage, custody, and market-making services through Coinbase Prime and four operating exchanges: Coinbase Exchange, Coinbase International Exchange, Coinbase Derivatives Exchange, and Deribit Exchange. The company also operates Base, a Layer 2 Ethereum blockchain, and the Coinbase Developer Platform to support third-party application development. Coinbase partners with Circle Internet Financial to support the USDC and EURC stablecoins, sharing in the economics of the reserves backing these assets. The platform monetizes through transaction fees on trading and subscription fees for stablecoin and other services. In 2025, the company expanded its offerings to include stocks, commodity futures, perpetual futures, and prediction markets, positioning itself as a multi-asset exchange. Summarised from the company's own disclosures, fiscal year ended Feb 2026 |
Industry Capital Markets | Homepage coinbase.com |
| Sector Financial Services | IR page investor.coinbase.com/home/default.aspx | |
|
Tags
cryptocurrency exchange, prime brokerage, digital asset custody, stablecoin infrastructure, blockchain development, derivatives trading, prediction markets, equity trading, layer 2 blockchain, institutional trading, Coinbase Prime, Coinbase Exchange, Coinbase International Exchange, Coinbase Derivatives Exchange, Deribit Exchange, Base, Base App, Coinbase Wallet, Coinbase Developer Platform, Coinbase One, Coinbase Wealth, Coinbase Business, Coinbase Credit Card, Coinbase Debit Card, Token Manager, USDC, EURC, Circle Internet Financial
|
Press page — |
Metrics
| Valuation | |
|---|---|
| Market cap | $ 52.422B |
| Market cap (USD) | $ 52.422B |
| P/E | -71.48 |
| PEG | — |
| P/BV | 3.76 |
| P/S | 9.31 |
| P/OCF | 13.61 |
| P/FCF | 21.60 |
| Dividend yield | — |
| Turnover / mcap | — |
| Returns | |
|---|---|
| ROE | 10.1% |
| ROI | 5.7% |
| ROIC | 5.4% |
| Profit margin | 17.6% |
| Growth | |
|---|---|
| Revenue growing | Yes |
| Profits growing | No |
| Revenue up 3y | No |
| Revenue up 5y | No |
| Earnings growth 3y (net profit CAGR) | — |
| Quality | |
|---|---|
| Profitable | Yes |
| Margin expanding | No |
| Buying back stock | No |
| Diluting (TTM) | No |
| Debt/Equity | — |
| Podcast bulls (TTM) | Sign up |
| Podcast bears (TTM) | Sign up |
| Podcast sentiment (TTM) | Sign up |
| Podcast sentiment % (TTM) | Sign up |
| News sentiment (TTM) | 16 |
| Quality score | -16.7% |
| Insiders | |
|---|---|
| Buys, 1w | Sign up |
| Buys, 1m | Sign up |
| Buys, 1y | Sign up |
| Sells, 1w | Sign up |
| Sells, 1m | Sign up |
| Sells, 1y | Sign up |
Sign up to see this company's insider trades
Filed figures
Lines the statements and their notes report beside the headline figures, read from the filings' XBRL as filed (no restatement applied), with figures computed from one filing's own lines. Cash-flow lines carry their cash direction: an outflow is negative. Each period links to its filing; a figure's period, report date and tag are in its tooltip.
| Figure | Dec 2018 | Dec 2019 | Dec 2020 | Dec 2021 | Dec 2022 | Dec 2023 | Dec 2024 | Dec 2025 |
|---|---|---|---|---|---|---|---|---|
| Balance sheet detail | ||||||||
| Trade receivables (USD) | — | — | 189M | 396M | 404M | 168M | 265M | 307M |
| ↳ YoY growth | +109.0% | +2.1% | -58.4% | +57.6% | +15.8% | |||
| ↳ 5y CAGR | +10.1% | |||||||
| Borrowings, current (USD) | — | — | — | 20.1M | 20.5M | 0.00 | 0.00 | 1.72B |
| Borrowings, non-current (USD) | — | — | 0.00 | 3.38B | 3.39B | 2.98B | 4.23B | 5.94B |
| Lease liabilities (USD) | — | — | 108M | 106M | 75.8M | 14.7M | 85.8M | 173M |
| Cash and deposits (USD) | 1.99B | 1.78B | 1.06B | 7.12B | 4.43B | 5.14B | 8.54B | 11.3B |
| Intangible assets (USD) | — | — | 377M | 1.16B | 135M | 86.4M | 46.8M | 1.4B |
| Right-of-use assets (USD) | — | — | 101M | 98.4M | 69.4M | 12.7M | 81.2M | 142M |
| Net debt (borrowings + leases - cash) (USD) | — | — | -954M | -3.63B | -935M | -2.14B | -4.22B | -3.45B |
| Cash flow detail | ||||||||
| Operating cash flow (USD) | — | -80.6M | 3B | 10.7B | -1.59B | 923M | 2.56B | 2.43B |
| Purchases of property, plant and equipment (USD) | — | -33.5M | -9.91M | -2.91M | -2.93M | — | — | — |
| Change in receivables (cash effect) (USD) | — | 30.7M | -157M | -8.02M | -141M | 80.4M | -101M | -1.98M |
| Change in payables (cash effect) (USD) | — | -2.39M | 6.09M | 27.3M | 18.6M | 954,000 | — | — |
| Share buybacks (cash effect) (USD) | — | — | — | — | — | 0.00 | 0.00 | -790M |
| Interest paid (cash effect) (USD) | — | 0.00 | 0.00 | -3.79M | -82.4M | -76.1M | -68.5M | — |
| Income taxes paid (cash effect) (USD) | — | -2.17M | -62.1M | -68.6M | -35.9M | -39.1M | -140M | -165M |
| Share-based compensation (USD) | — | 31.1M | 70.5M | 821M | 1.57B | 781M | 913M | 839M |
| Operating cash flow before change in receivables (USD) | — | -111M | 3.16B | 10.7B | -1.44B | 843M | 2.66B | 2.43B |
| Free cash flow (OCF - PPE - intangibles) (USD) | — | -114M | 2.99B | 10.7B | -1.59B | — | — | — |
| Income detail | ||||||||
| Research and development expense (USD) | — | 185M | 272M | 1.29B | 2.33B | 1.32B | 1.47B | 1.67B |
| ↳ 5y CAGR | +51.3% | +43.8% | ||||||
| Total comprehensive income (USD) | — | -30.4M | 329M | 3.61B | -2.66B | 103M | 2.56B | 1.32B |
| Comprehensive income to owners (USD) | — | -30.4M | 329M | 3.61B | -2.66B | 103M | 2.56B | 1.32B |
| Provision for credit losses (USD) | — | -4.68M | -2.97M | 22.4M | -13.1M | 11.1M | — | — |
| Credit cost ratio (credit losses / average receivables) (%) | — | — | — | 7.6% | 3.3% | 3.9% | — | — |
| Reported | Feb 25, 2022 | Feb 25, 2022 | Feb 25, 2022 | May 10, 2022 | Feb 21, 2023 | Feb 12, 2026 | Feb 12, 2026 | Feb 12, 2026 |
Sign up to see institutional holdings
Sign UpPodcast Mentions
Sign up to see podcast mentions and sentiment
Sign UpMaterial events reported to the SEC on Form 8-K or 6-K, newest first. The link opens the filing itself on EDGAR. Press releases from the company's own website, newest first.
October 29, 2026
Coinbase Q3 2026 earnings highlights:
- Coinbase reported net income of $719 million and Adjusted net income of $78 million.
- Adjusted EBITDA was $333 million, up 60% quarter over quarter and the company’s 15th consecutive quarter of positive Adjusted EBITDA.
- Coinbase Crypto Trading Volume Market Share reached 10.7%, with gains in both spot and derivatives, marking its fourth consecutive quarter of market share gains.
- Assets on Platform represented 12.5% of Total Crypto Market Capitalization, returning to peak level.
- Average USDC Held in Coinbase Products reached $22 billion, another all-time high for the fourteenth consecutive quarter and a 49% increase year over year.
- Coinbase prediction markets surpassed $200 million in annualized revenue, becoming one of the fastest-growing products in Coinbase’s history.
- Paid Coinbase One Subscribers reached a new all-time high, up 24% year over year.
Everywhere/SAN FRANCISCO--(BUSINESS WIRE)-- Coinbase Global, Inc. (Nasdaq: COIN) today announced financial results for the third quarter ended September 30, 2026. Coinbase’s financial results demonstrate consistent execution through a softer crypto market, including its fourth consecutive quarter of gains in Coinbase Crypto Trading Volume Market Share and record Average USDC Held in Coinbase Products and Paid Coinbase One Subscribers. Coinbase prediction markets surpassed $200 million in annualized revenue, while Subscription and Services revenue represented 49% of net revenue in Q3 — reflecting a focus on building a diversified portfolio of products that supports durable, long-term revenue growth. For definitions and additional information, please see Coinbase’s earnings presentation at investor.coinbase.com.
Coinbase delivers 15th consecutive quarter of positive Adjusted EBITDA: Coinbase maintained positive net income, positive Adjusted net income, and positive Adjusted EBITDA through a softer crypto market.
- Coinbase reported net income of $719 million and Adjusted net income of $78 million in Q3 2026.
- Adjusted EBITDA reached $333 million, up 60% quarter over quarter, marking Coinbase’s 15th consecutive quarter of positive Adjusted EBITDA.
Everything Exchange momentum continues, reaching 10.7% Coinbase Crypto Trading Volume Market Share: Coinbase’s Everything Exchange brings more markets and products into one place, expanding the ways customers can trade.
- Coinbase’s Crypto Trading Volume Market Share reached 10.7% in Q3 2026, its fourth consecutive quarter of market share gains.
- Coinbase gained market share in both spot and derivatives trading, supported by stablecoin demand and diversification into perpetuals, futures, and options.
- Coinbase Crypto Derivatives Trading Volume saw 179% compound annual growth over the last two years, and Coinbase leads in open interest in global options.
- Coinbase expanded its lead as the largest platform for crypto stored globally and returned to peak Assets on Platform market share of 12.5%.
Prediction markets see 82% quarterly compound growth since launch: Coinbase prediction markets are one of the fastest-growing products by revenue in Coinbase’s history, creating a new source of growth for the Everything Exchange.
- Coinbase prediction markets surpassed $200 million in annualized revenue, growing even through seasonally slower sports months.
- Daily traders grew 60%+ quarter-over-quarter.
- Prediction markets revenue has seen 82% quarterly compound growth since launch.
- Users who trade predictions are also driving incremental spot volume.
Average USDC Held in Coinbase Products reaches record $22 billion as Coinbase expands stablecoin payments: Coinbase continued to grow USDC adoption while building toward payments for both people and agents.
- Average USDC Held in Coinbase Products reached an all-time high of $22 billion in Q3 2026, or roughly 30% of average USDC Market Cap.
- Over the past year, Coinbase captured approximately 50% of all USDC economics, with onchain partnerships and deeper product integration driving greater USDC adoption.
Broader product adoption drives continued diversification beyond spot trading: Coinbase continued to expand customer engagement across subscriptions, lending, and onchain products.
- Paid Coinbase One Subscribers reached an all-time high in Q3 2026, up 24% year over year. This group represents Coinbase's most valuable users, with 3.5x higher average revenue per user (ARPU), 4.2x higher balances per user, and 50%+ higher long-term trading retention.
- Subscription and services revenue represented 49% of total net revenue in Q3 2026.
- Coinbase’s Average Daily Loan Book Balance reached an all-time high in Q3 2026, up 74% year over year.
- Base remains the leading L2 for spot crypto trading and leading L2 in DeFi Total Value Locked as of Q3 2026.
- Coinbase Tokenized Stock Volume on Base has grown to over $1 billion since launch, expanding the ways customers can trade onchain.
“We continued to execute well on things in our control and compound gains. One of our major assets is that we are the most trusted player in crypto and store more crypto than any company in the world, so it was great that we returned to our peak Assets on Platform market share,” said Brian Armstrong, Co-Founder and CEO. “Prediction markets have been one of the fastest-growing products in Coinbase history, growing even through slower sports months driven by crypto contracts where we have a strong right to win.”
“We delivered growth across key profitability measures in Q3, including our 15th consecutive quarter of positive Adjusted EBITDA,” said Alesia Haas, Chief Financial Officer. “Subscription and services revenue grew quarter over quarter and now represents nearly half of net revenue. Prediction markets are adding another revenue stream and are less correlated to crypto volatility. These businesses make Coinbase more diversified and resilient across market cycles.”
Non-GAAP Financial Measures
This press release includes Adjusted EBITDA and Adjusted net income, financial measures not prepared in accordance with U.S. generally accepted accounting principles (“GAAP”). For definitions and additional information, please see the Appendix to this press release and Coinbase’s earnings presentation at investor.coinbase.com, as well as other filings it makes with the SEC.
Quarterly Conference Call
Materials containing Coinbase’s financial results for the third quarter ended September 30, 2026 have been posted on its Investor Relations website at investor.coinbase.com. Coinbase will hold a live question & answer session on X at 2:00 p.m. PT today. The event will also be live streamed on YouTube . Following the Q&A session, a replay and transcript will be available on the Investor Relations website .
Disclosure Information
In addition to filings with the Securities and Exchange Commission (SEC), Coinbase uses its Investor Relations website (investor.coinbase.com), its blog (blog.coinbase.com), press releases, public conference calls and webcasts, its X feed (@coinbase), Brian Armstrong’s X feed (@brian_armstrong), its LinkedIn page, and its YouTube channel as means of disclosing material non-public information and for complying with its disclosure obligations under Regulation FD.
Forward-Looking Statements
This press release contains forward-looking statements within the meaning of the Private Securities Litigation Reform Act of 1995. All statements other than statements of historical fact are forward-looking statements. These statements include, but are not limited to, statements regarding our future operating results and financial position; our business strategy and plans; expectations relating to our industry, the regulatory environment, market conditions, trends and growth; our market position; potential market opportunities; and our objectives for future operations. The words “believe,” “may,” “will,” “estimate,” “potential,” “continue,” “anticipate,” “intend,” “expect,” “could,” “would,” “project,” “plan,” “target,” and similar expressions are intended to identify forward-looking statements. Forward-looking statements are based on management’s expectations, assumptions, and projections based on information available at the time the statements were made. These forward-looking statements are subject to a number of risks, uncertainties, and assumptions including those discussed in our SEC filings, including our Annual Report on Form 10-K for the year ended December 31, 2025 filed with the SEC on February 12, 2026 and our Quarterly Report on Form 10-Q for the quarter ended September 30, 2026 filed with the SEC on October 29, 2026. Except as required by law, we assume no obligation to update these forward-looking statements, or to update the reasons if actual results differ materially from those anticipated in the forward-looking statements. In addition, certain data and statistics in this press release are based on information obtained from third-party sources. Coinbase has not independently verified the accuracy or completeness of such data.
About Coinbase
Coinbase (Nasdaq: COIN) is on a mission to increase economic freedom in the world. The most trusted crypto platform, Coinbase stores more digital assets than any other company and is building the everything exchange — one place to access crypto, equities, derivatives, prediction markets, and more. Coinbase serves consumers through its suite of financial apps, institutions through Coinbase Prime, and developers through the Coinbase Developer Platform. Coinbase's full-stack platform was purpose-built to power the future of finance: secure custody, deep exchange liquidity, stablecoin infrastructure, and global settlement rails — all built on a decade-plus foundation of security and compliance.
Appendix
Adjusted Net Income (Loss)
In addition to our results determined in accordance with GAAP, we believe that Adjusted net income (loss), a non-GAAP financial performance measure, provides useful information to help investors evaluate our operating performance. We believe it is useful to exclude tax-effected gains and losses on crypto assets held for investment from Adjusted net income (loss) because (i) such investments are considered primarily long-term holdings, (ii) we do not plan on engaging in regular trading of crypto assets, and, (iii) as an operating company, our investing activities in crypto are not part of our revenue generating activities, which are based on transactions on our platform and the sales of subscriptions and services. Additionally, we believe it is useful to exclude tax-effected gains and losses on our marketable and strategic investments from Adjusted net income (loss) because such investments are not part of our core operating activities and are considered non-operating activities under GAAP.
Reconciliation of Adjusted Net Income (Loss)
| ($ in millions) | Q3’26 |
| Net income (loss) | 718.7 |
| Adjusted to exclude the following: | |
| (Gains) losses on crypto assets held for investment, net | (715.0) |
| Losses (gains) on investments, net | (39.2) |
| Tax effect of non-GAAP net income adjustments | 113.3 |
| Adjusted net income (loss) | 77.7 |
| Note: Amounts may not add as presented due to rounding. |
Adjusted EBITDA
In addition to our results determined in accordance with GAAP, we believe Adjusted EBITDA, a non-GAAP financial performance measure, is useful information to help investors evaluate our operating performance because it: enables investors to compare this measure and component adjustments to similar information provided by peer companies and our past financial performance; provides additional company-specific adjustments for certain items that may be included in income from operations but that we do not consider to be normal, recurring, operating expenses (or income) necessary to operate our business given our operations, revenue generating activities, business strategy, industry, and regulatory environment; and provides investors with visibility to a measure management uses to evaluate our ongoing operations and for internal planning and forecasting purposes. For example:
- We believe it is useful to exclude certain non-cash expenses, such as depreciation and amortization and stock-based compensation, from Adjusted EBITDA because the amounts of such expenses can vary significantly from period to period and may not directly correlate to the underlying performance of our business operations.
- We believe it is useful to exclude certain items that we do not consider to be normal, recurring, cash operating expenses and therefore, not reflective of our ongoing business operations. For example, we exclude: (i) other expense (income), net, as the income and expenses recognized in this line item are not part of our core operating activities and are considered non-operating activities under GAAP, (ii) gains and losses on crypto assets held for investment because such investments are considered primarily long-term holdings, (iii) losses, net of recoveries, directly related to the data theft incident announced on the Current Report on Form 8-K we filed with the SEC on May 15, 2025 (the “Data Theft Incident”), including voluntary customer reimbursements, direct legal costs, and reward payments, if any, in connection with the threat actor’s arrest and conviction, (iv) costs of restructuring, as these costs are associated with discrete organizational changes and are not reflective of our core, ongoing business operations, (v) non-recurring accrued legal contingencies, settlements, and related costs, which reduces cash available to us, and (vi) impairment on crypto assets still held, net, which represents impairment on crypto assets still held and is a non-cash expense, prior to the adoption of Accounting Standards Update (“ASU”) 2023-08. We do not plan on engaging in regular trading of crypto assets, and, as an operating company, our investing activities in crypto are not part of our revenue generating activities, which are primarily based on transactions on our platform and the sales of subscriptions and services.
- We believe Adjusted EBITDA is useful to measure a company’s operating performance without regard to items such as stock-based compensation expense, depreciation and amortization expense, interest expense, other expense (income), net, and (benefit from) provision for income taxes that can vary substantially from company to company depending upon their financing, capital structures, and the method by which assets were acquired.
A reconciliation is provided below for Adjusted EBITDA to net (loss) income, the most directly comparable financial measure stated in accordance with GAAP. Investors are encouraged to review the related GAAP financial measure and the reconciliation of Adjusted EBITDA to net (loss) income, and not to rely on any single financial measure to evaluate our business.
Reconciliation of Adjusted EBITDA
| ($ in millions) | Q3’23 | Q4’23 | Q1’24 | Q2’24 | Q3’24 | Q4’24 | Q1’25 | Q2’25 | Q3’25 | Q4’25 | Q1’26 | Q2’26 | Q3’26 |
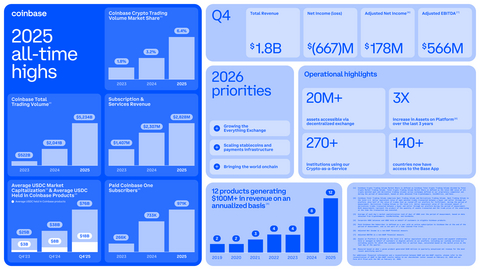
| Net (loss) income | (2.3) | 273.4 | 1,176.2 | 36.2 | 75.5 | 1,291.2 | 65.6 | 1,428.9 | 432.6 | (666.7) | (394.1) | (359.5) | 718.7 |
| Adjusted to exclude the following: | |||||||||||||
| Provision for (benefit from) income taxes | 36.9 | (140.6) | 261.2 | (96.4) | (6.9) | 205.7 | 16.8 | 394.9 | 69.6 | (219.6) | (70.6) | (35.9) | 105.2 |
| Interest expense | 20.8 | 18.7 | 19.1 | 20.5 | 20.5 | 20.5 | 20.5 | 20.5 | 21.8 | 22.6 | 22.6 | 22.5 | 19.5 |
| Depreciation and amortization | 32.0 | 29.5 | 29.3 | 34.5 | 30.7 | 33.0 | 33.3 | 33.9 | 50.1 | 71.1 | 68.0 | 64.4 | 61.2 |
| Stock-based compensation expense | 218.2 | 163.9 | 224.5 | 217.9 | 248.4 | 222.0 | 190.7 | 196.2 | 222.1 | 230.5 | 248.1 | 238.3 | 233.0 |
| (Gains) losses on crypto assets held for investment, net | — | — | (650.4) | 319.0 | 120.5 | (476.2) | 596.7 | (362.1) | (423.9) | 718.2 | 482.4 | 209.5 | (715.0) |
| Data Theft Incident losses (recoveries), net¹ | — | — | — | — | — | — | — | 306.7 | 48.0 | (9.5) | 8.6 | (33.9) | (18.4) |
| Restructuring | (0.9) | — | — | — | — | — | — | — | — | — | — | 52.4 | (4.6) |
| Impairment on crypto assets still held, net (pre-adoption of ASU 2023-08) | 8.9 | — | — | — | — | — | — | — | — | — | — | — | — |
| Non-recurring accrued legal contingencies, settlements, and related costs | — | 15.0 | — | — | — | — | — | — | — | — | — | — | — |
| Other (income) expense, net² | (135.3) | (36.0) | (45.6) | 63.8 | (40.1) | (7.2) | 6.2 | (1,506.9) | 380.5 | 419.3 | (61.6) | 49.9 | (66.7) |
| Adjusted EBITDA³ | 178.3 | 324.0 | 1,014.3 | 595.6 | 448.6 | 1,289.0 | 929.9 | 512.1 | 800.7 | 565.9 | 303.3 | 207.8 | 332.9 |
| Note: Amounts may not add as presented due to rounding. | |||||||||||||
| [1] Losses, net of recoveries, directly related to the data theft incident announced on the Current Report on Form 8-K we filed with the SEC on May 15, 2025 (the “Data Theft Incident”), including voluntary customer reimbursements, direct legal costs, and reward payments, if any, in connection with the threat actor’s arrest and conviction. | |||||||||||||
| [2] See Note 17. Other Condensed Consolidated Statements of Operations Details to the Condensed Consolidated Financial Statements in our Quarterly Report on Form 10-Q for the quarter ended September 30, 2026 filed with the SEC on October 29, 2026 for additional details. | |||||||||||||
| [3] We calculate Adjusted EBITDA as net loss or income, adjusted to exclude provision for or benefit from income taxes, interest expense, depreciation and amortization expense, stock-based compensation expense, net gains or losses on our crypto assets held for investment, losses, net of recoveries, directly related to the Data Theft Incident, restructuring, impairment on crypto assets still held, net (pre-adoption of ASU 2023-08), non-recurring accrued legal contingencies, settlements, and related costs, and other income or expense, net, which represents net gains or losses on investments and other financial instruments, and other non-operating income and expense activity. |
Press:
[email protected]
Investor Relations:
[email protected]
Source: Coinbase Global, Inc.


© 2026 Coinbase
Company
Learn
Individuals
Businesses
Developers
Support
October 14, 2026
Remote-First-Company/CLEVELAND--(BUSINESS WIRE)-- Coinbase Global, Inc. (the “Company” or “Coinbase”) announced today that it will publish its third quarter 2026 financial results and related materials on its Investor Relations website at investor.coinbase.com on Thursday, October 29, 2026, after market close.
The Company will hold a live question & answer session on X at 2:00 p.m. PT that same day. The event will also be live streamed on YouTube . Following the Q&A session, a replay and transcript will be available on the Investor Relations website.
Disclosure Information
In addition to filings with the Securities and Exchange Commission (SEC), Coinbase uses its Investor Relations website (investor.coinbase.com), its blog (blog.coinbase.com), press releases, public conference calls and webcasts, its X feed (@coinbase), Brian Armstrong’s X feed (@brian_armstrong), its LinkedIn page, and its YouTube channel as means of disclosing material non-public information and for complying with its disclosure obligations under Regulation FD.
About Coinbase
Coinbase (NASDAQ: COIN) is on a mission to increase economic freedom in the world. The most trusted crypto platform, Coinbase stores more digital assets than any other company and is building the everything exchange — one place to access crypto, equities, derivatives, prediction markets, and more. Coinbase serves consumers through its suite of financial apps, institutions through Coinbase Prime, and developers through the Coinbase Developer Platform. Coinbase’s full-stack platform was purpose-built to power the future of finance: secure custody, deep exchange liquidity, stablecoin infrastructure, and global settlement rails — all built on a decade-plus foundation of security and compliance.
Press:
[email protected]
Investor Relations:
[email protected]
Source: Coinbase Global, Inc.
© 2026 Coinbase
Company
Learn
Individuals
Businesses
Developers
Support


Prompts
Click prompts to add them under the company line, click again to take one out, then copy the result into your AI chat. Shared by Asian Century Stocks and Uncovered Thai Stocks. Thank you.
ETFs Holding Coinbase Global, Inc.
Exchange-traded funds whose newest published daily portfolio holds one of the company's listings, largest weight first.
| ETF | Weight in ETF | Shares | Market value | As of |
|---|---|---|---|---|
| CRPT | 11.88% | 77,140 | $ 9.244M | Nov 16, 2026 |
| CEPI | 4.58% | 34,524 | $ 5.049M | Jul 31, 2026 |
| ARKF | 4.40% | 279,580 | $ 32.157M | Nov 18, 2026 |
| ARKK | 3.63% | 3,998,780 | $ 459.94M | Nov 18, 2026 |
| LFGY | 3.49% | 16,096 | $ 1.929M | Nov 17, 2026 |
| DECO | 2.63% | 3,323 | $ 398.228K | Nov 16, 2026 |
| BLOK | 2.28% | 181,797 | $ 26.577M | Jun 30, 2026 |
| BLOX | 2.04% | 32,042 | $ 3.84M | Nov 17, 2026 |
| NODE | 1.05% | 5,199 | $ 760.042K | Jun 30, 2026 |
| FFF | 0.87% | 297 | $ 55.364K | Sep 30, 2026 |
| LCLG | 0.62% | 4,568 | $ 668.116K | Jul 31, 2026 |
| XDAT | 0.56% | 144 | $ 21.051K | Jun 30, 2026 |
| ORR short | -0.55% | -17,485 | $ -2.01M | Nov 18, 2026 |
| CLSE short | -0.32% | -15,355 | $ -2.889M | Aug 31, 2026 |
| BTAL short | -0.29% | -5,566 | $ -813.694K | Jun 30, 2026 |
| AVMC | 0.25% | 11,693 | $ 1.401M | Nov 16, 2026 |
| MKTN short | -0.24% | -1,776 | $ -259.633K | Jun 30, 2026 |
| TTEQ | 0.23% | 9,120 | $ 1.093M | Nov 17, 2026 |
| BUYZ | 0.19% | 67 | $ 9,794.73 | Jun 30, 2026 |
| BDVL short | -0.19% | -27,909 | $ -3.345M | Nov 16, 2026 |
| GEW | 0.18% | 1,362 | $ 256.219K | Aug 31, 2026 |
| AOTG | 0.15% | 831 | $ 156.328K | Aug 31, 2026 |
| ACVF | 0.10% | 1,003 | $ 146.699K | Jul 31, 2026 |
| MCDS | 0.08% | 54 | $ 6,211.08 | Nov 17, 2026 |
| MSLC | 0.08% | 16,757 | $ 3.152M | Aug 31, 2026 |
| MODL | 0.08% | 5,391 | $ 788.11K | Jun 30, 2026 |
| FTQI | 0.07% | 5,713 | $ 684.646K | Nov 16, 2026 |
| XMAG | 0.06% | 1,040 | $ 135.897K | Nov 13, 2026 |
| IETC | 0.06% | 3,044 | $ 364.793K | Nov 16, 2026 |
| GDE | 0.05% | 1,378 | $ 259.229K | Aug 31, 2026 |
| NTSD | 0.05% | 131 | $ 19.151K | Jun 30, 2026 |
| VOXP | 0.05% | 21 | $ 3,071.46 | Jul 31, 2026 |
| NTSX | 0.05% | 4,257 | $ 622.331K | Jun 30, 2026 |
| DFAU | 0.04% | 39,815 | $ 5.203M | Nov 12, 2026 |
| HCMT | 0.04% | 1,545 | $ 225.972K | Jul 31, 2026 |
| AVSU | 0.04% | 1,774 | $ 212.596K | Nov 16, 2026 |
| IALT short | -0.04% | -24,721 | $ -2.963M | Nov 16, 2026 |
| APUE | 0.04% | 4,933 | $ 927.996K | Aug 31, 2026 |
| TACU | 0.03% | 48 | $ 5,752.32 | Nov 17, 2026 |
| AVLC | 0.03% | 3,635 | $ 435.618K | Nov 16, 2026 |
| AVUQ | 0.03% | 993 | $ 119.001K | Nov 16, 2026 |
| DFUS | 0.03% | 45,567 | $ 5.954M | Nov 12, 2026 |
| DFAC | 0.02% | 165,918 | $ 21.681M | Nov 12, 2026 |
| AVUS | 0.02% | 29,980 | $ 3.593M | Nov 16, 2026 |
| INRO | 0.02% | 884 | $ 105.939K | Nov 16, 2026 |
| GSPY | 0.02% | 943 | $ 113.009K | Nov 17, 2026 |
| DCOR | 0.02% | 67,806 | $ 8.86M | Nov 12, 2026 |
| DFSU | 0.02% | 3,466 | $ 452.902K | Nov 12, 2026 |
| CSHP | 0.01% | 468 | $ 56.085K | Nov 16, 2026 |
| DFVX | 0.01% | 234 | $ 30.577K | Nov 12, 2026 |
| DFLV | 0.00% | 1,591 | $ 207.896K | Nov 12, 2026 |
| DXUV | 0.00% | 1,149 | $ 150.14K | Nov 12, 2026 |
| EBI | 0.00% | 13 | $ 2,445.56 | Aug 31, 2026 |
| BDYN short | 0.00% | -61 | $ -61.00 | Nov 16, 2026 |
| CORO | 0.00% | 141 | $ 16.84K | Nov 16, 2026 |