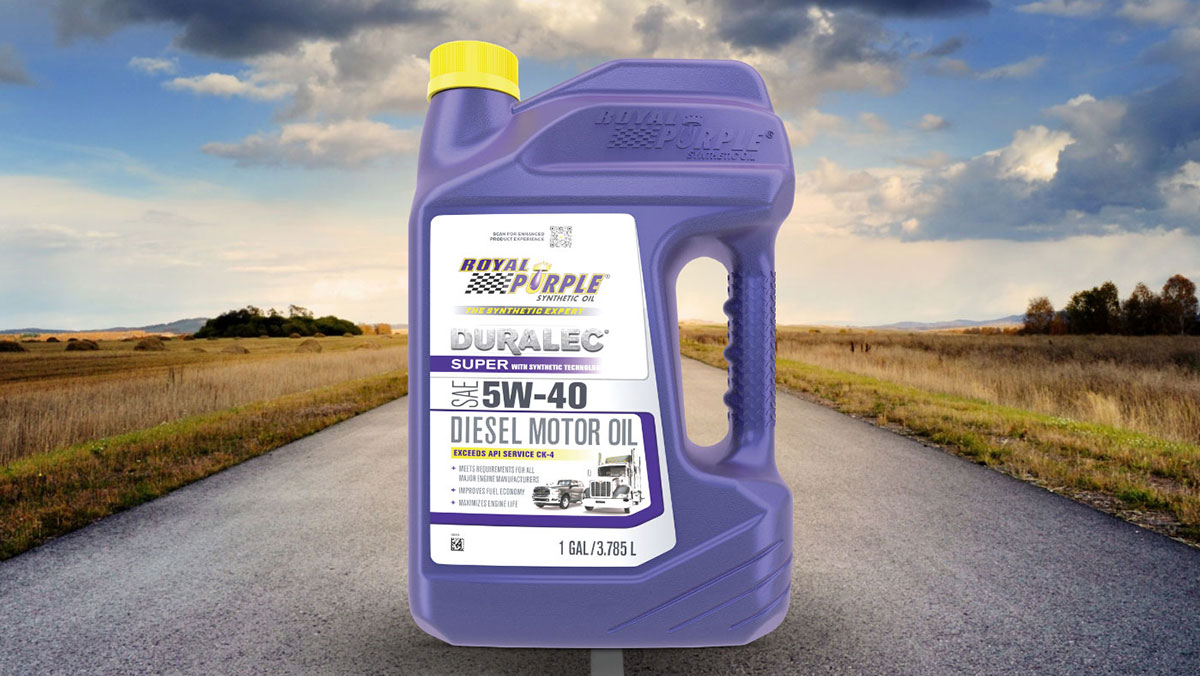
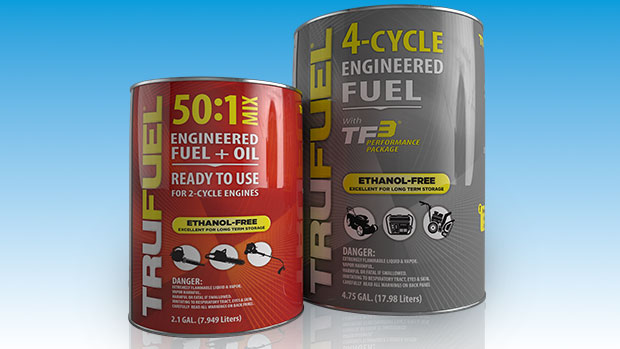
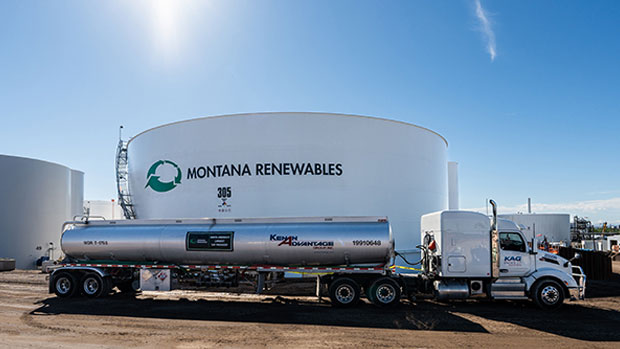
Calumet, Inc. manufactures, formulates, and markets specialty branded products and renewable fuels across consumer-facing and industrial markets. The company operates through three primary segments: Specialty Products and Solutions, which produces solvents, waxes, lubricating oils, white oils, and petrolatums; Performance Brands, which blends and markets high-performance products under the Royal Purple, Bel-Ray, and TruFuel brands; and Montana/Renewables, which processes renewable feedstocks into renewable diesel, sustainable aviation fuel, and renewable naphtha, alongside specialty asphalt production. Calumet serves domestic and international customers, distributing products across North America and globally. The company operates twelve facilities in North America and utilizes a network of storage terminals and leased railcars for logistics. Notable subsidiaries include Calumet Specialty Products Partners, L.P., Calumet Montana Refining, and Montana Renewables, LLC. The company completed a corporate conversion transaction in 2024, transitioning from a partnership structure to a wholly owned subsidiary model under Calumet, Inc.

Summarised from the company's own disclosures, fiscal year ended Feb 2026

Industry Specialty Chemicals Homepage calumet.com
Sector Basic Materials IR page —
Tags
specialty solvents, white oils, petrolatums, synthetic lubricants, renewable diesel, sustainable aviation fuel, specialty asphalt, industrial waxes, automotive fuels, renewable naphtha, Royal Purple, Bel-Ray, TruFuel, Calumet Specialty Products Partners L.P., Calumet Montana Refining, Montana Renewables LLC, Calumet Paralogics LLC, MaxSAF, Calumet Packaging, Karns City, Dickinson, Cotton Valley, Princeton, Shreveport, Montana Specialty Asphalt, Montana Renewables, Burnham terminal
Press page calumet.com/news

Metrics

Valuation  
Market cap $ 4.614B
Market cap (USD) $ 4.614B
P/E -23.28
PEG —
P/BV -5.30
P/S 0.89
P/OCF 13.53
P/FCF 17.40
Dividend yield —
Turnover / mcap —
Returns  
ROE 4.6%
ROI -2.3%
ROIC 5.4%
Profit margin -0.82%
Growth  
Revenue growing No
Profits growing No
Revenue up 3y No
Revenue up 5y No
Earnings growth 3y (net profit CAGR) —
Quality  
Profitable No
Margin expanding No
Buying back stock No
Diluting (TTM) Yes
Debt/Equity —
Podcast bulls (TTM) Sign up
Podcast bears (TTM) Sign up
Podcast sentiment (TTM) Sign up
Podcast sentiment % (TTM) Sign up
News sentiment (TTM) 14
Quality score -44.4%
Insiders  
Buys, 1w Sign up
Buys, 1m Sign up
Buys, 1y Sign up
Sells, 1w Sign up
Sells, 1m Sign up
Sells, 1y Sign up

Sign up to see this company's insider trades

Figure FY 2025 FY 2024 FY 2023 FY 2022 FY 2021 FY 2020 FY 2019 FY 2018 FY 2017 FY 2016 FY 2015 FY 2014 FY 2013 FY 2012 FY 2011 FY 2010 FY 2009 FY 2008 FY 2007 FY 2006 FY 2005 FY 2004
Revenue 4.137B 4.189B 4.181B 4.687B 3.148B 2.268B 3.453B 3.498B — — — — — — — — 1.847B 2.489B — — 1.289B 539.616M
Net profit -33.8M -222M 48.1M -165.1M -260.1M -149M -43.6M -55.1M -103.8M -328.6M -139.4M -112.2M 3.5M 205.737M 43.036M 16.701M 61.785M 44.437M — — 11.328M 8.97M
Free cash flow 56.6M -123.1M -286.7M -435.6M -126.9M 18.8M 137M 25.4M -96.5M -135.3M 37.1M -63.1M -121.7M 323.055M 14.3M 99.142M 77.333M -37.361M — — -46.964M -43.645M

Figure FY 2025 FY 2024 FY 2023 FY 2022 FY 2021 FY 2020 FY 2019 FY 2018 FY 2017 FY 2016 FY 2015 FY 2014 FY 2013 FY 2012 FY 2011 FY 2010 FY 2009 FY 2008 FY 2007 FY 2006 FY 2005 FY 2004
Share price 19.87 22.02 17.87 16.88 13.2 3.13 3.65 2.21 7.7 4 19.91 22.41 26.02 30.39 18.72 20 18.15 7.44 50.02 32.8 — —
Price performance 12m -0.1 0.23 0.06 0.28 3.22 -0.14 0.65 -0.71 0.92 -0.8 -0.11 -0.14 -0.14 0.62 -0.06 0.1 1.44 -0.85 0.53 — — —

Filed figures

Figure Dec 2016 Dec 2017 Dec 2018 Dec 2019 Dec 2020 Dec 2021 Dec 2022 Dec 2023 Dec 2024 Dec 2025
Balance sheet detail
Trade receivables (USD) 216M 265M 178M 175M 152M 253M 268M 286M 278M 233M
↳ YoY growth +10.8% +22.6% -33.0% -1.5% -12.9% +66.0% +5.9% +6.8% -2.8% -16.4%
↳ 5y CAGR +0.7% +3.9% -6.6% -11.7% -4.8% +3.2% +0.2% +10.0% +9.7% +8.8%
Borrowings, current (USD) 3.5M 354M 3.8M 1.8M 2.9M 7.4M 20M 55.7M 35.5M 156M
Borrowings, non-current (USD) 1.99B 1.64B 1.6B 1.21B 1.32B 1.42B 1.54B 1.83B 2.06B 2.08B
Lease liabilities (USD) — — 0.00 96.3M 89.9M 162M 111M 118M 244M 228M
Cash and deposits (USD) 4.2M 164M 156M 19.1M 109M 38.1M 35.2M 7.9M 38.1M 125M
Intangible assets (USD) 179M 108M 88M 71.2M 57.6M 45.8M 36.3M 28.5M 22M 8.7M
Right-of-use assets (USD) — — 0.00 93.1M 85.8M 158M 108M 114M 240M 224M
Net debt (borrowings + leases - cash) (USD) 1.99B 1.83B 1.45B 1.29B 1.3B 1.55B 1.64B 2B 2.31B 2.34B
Cash flow detail
Operating cash flow (USD) 4.1M -26.5M 75.2M 192M 62.8M -44M 101M -14.9M -46.4M 109M
Purchases of property, plant and equipment (USD) -139M -70M -49.8M -54.9M -44M -82.9M -536M -272M -76.7M -52.3M
Change in receivables (cash effect) (USD) -28.4M -159M 110M -37M 25.5M -91.4M -15M -19.2M 8M 47M
Change in inventories (cash effect) (USD) 49.6M -8.5M -300,000 16.3M 14M -27M -191M 25.1M 16.1M 14.9M
Change in payables (cash effect) (USD) 21.4M 70.6M -78.2M 71.3M -38.1M 71M 57.3M -12.4M 1.7M -52.2M
Interest paid (cash effect) (USD) -130M -164M -171M -128M -120M -143M -151M -202M -232M -172M
Income taxes paid (cash effect) (USD) -1.2M -400,000 -400,000 0.00 — — — — — -500,000
Share-based compensation (USD) 5.6M 11.6M -1.2M 5.9M 5.5M 50.7M 15.8M 14.7M 14.6M -4.5M
Operating cash flow before change in receivables (USD) 32.5M 132M -34.6M 229M 37.3M 47.4M 116M 4.3M -54.4M 61.9M
Free cash flow (OCF - PPE - intangibles) (USD) -135M -96.5M 25.4M 137M 18.8M -127M -436M -287M -123M 56.6M
Income detail
Total comprehensive income (USD) -335M -103M -56.6M -45.5M -151M -258M -170M 49.2M -222M -33.6M
Comprehensive income to owners (USD) -335M -103M -56.6M -45.5M -151M -258M -163M — — —
Provision for credit losses (USD) 400,000 6.1M 1.2M -500,000 100,000 1.2M -700,000 -100,000 -100,000 —
Credit cost ratio (credit losses / average receivables) (%) 0.2% 2.5% 0.5% 0.3% 0.1% 0.6% 0.3% 0.0% 0.0% —
Reported Mar 6, 2017 Apr 2, 2018 May 10, 2019 Mar 5, 2020 Mar 15, 2023 Mar 15, 2023 Mar 15, 2023 Feb 29, 2024 Mar 3, 2025 Feb 27, 2026

Sign up to see institutional holdings

Sign Up

Podcast Mentions

Sign up to see podcast mentions and sentiment

Sign Up

Calumet Reports Third Quarter 2026 Results Bull 5 Bear 0 Results

•Third Quarter 2026 net income of $273.3 million, or basic earnings per common share of $2.91

•Third Quarter 2026 Adjusted EBITDA with Tax Attributes of $347.2 million

•Accelerated deleveraging continues with approximately $265 million of debt retirement since July

•$248.1 million of Specialty Products & Solutions Adjusted EBITDA driven by strong market environment for integrated specialties platform, lasting industry supply chain disruptions, and commercial execution

•Montana Renewables delivers record earnings in first full quarter of operations since SET2 RVO; Adjusted EBITDA with Tax Attributes of $80.4 million ($1.86 per gallon)

INDIANAPOLIS — (PR NEWSWIRE) — November 6, 2026 — Calumet, Inc.

Home / News / Royal Purple Unveils New Three-Tier Performance Motor Oil Lineup at AAPEX 2026

High Performance, new Ultimate High Performance, and Extreme Performance Racing give drivers a clear path from daily driving to the track, with the lineup arriving at retail beginning January 2027.

LAS VEGAS, Nov. 2, 2026 — Royal Purple®, the synthetic lubricant brand recognized by its signature purple oil, tomorrow announces a reimagined passenger car motor oil lineup, which it will unveil when AAPEX 2026 opens Tuesday morning. The new three-tier Performance Line — High Performance, Ultimate High Performance, and Extreme Performance Racing — consolidates a range of legacy products with three clearly defined choices, each matched to specific vehicle demands.

“The new lineup brings our passenger car motor oils together into three focused tiers, making it easier than ever for customers to find the right fit,” said Royal Purple Jonathan Vilardo, Product Management Director. “Beyond streamlining the selection process, the new line delivers a true upgrade in performance, bringing our highest level of synthetic engineering directly to everyday drivers.”

Three Tiers, One Clear Choice

High Performance — The everyday upgrade for daily drivers, commuters, and family vehicles. Designed to prevent deposits and sludge, preserve engine performance, and protect against wear, High Performance carries forward the trusted formulation customers rely on today with a new name and look.

Ultimate High Performance— Engineered for global compatibility across new and high-mileage gasoline and light-duty diesel vehicles, Ultimate High Performance is the upgrade for drivers who want more from every mile. Formulated with the brand’s proprietary Synerlec® additive technology, a revolutionary advancement designed to meet the needs of modern engines and emissions systems, Ultimate High Performance removes engine sludge and deposits, reduces engine wear, and provides long-term engine protection.

Extreme Performance Racing — Built for the track. Extreme Performance Racing pairs the reformulated proprietary Synerlec® additive technology with elevated levels of ZDDP to protect engines in the most punishing conditions. It is the top-tier choice for competition and high-stress engine builds.

See the Line at AAPEX 2026

Attendees can see all three tiers in person at the Royal Purple booth, V3861, at the Venetian Expo and AAPEX Forum, Nov. 3-5, 2026. The Royal Purple team will walk retailers, distributors, installers, and media through the new lineup, packaging, and January retail rollout.

“AAPEX is where the aftermarket comes together, so it’s the right place to introduce the next chapter of Royal Purple® motor oil portfolio,” said Lesley Reed, Senior Sales Director Consumer Sales “Drivers today want better performance, but they also want to feel confident they’re choosing the right oil. Three clear tiers take the guesswork out of it and make it easier than ever to Choose Purple.”

Media interviews and product briefings are available at the show by appointment. To schedule, contact Ed Walsh, RP Agency | 318.465.0138 | [email protected].

Availability

The Royal Purple Performance Line will be available at retail and through distribution partners beginning January 2027.


Eleventh Amendment to Third Amended and Restated Credit Agreement On September 11, 2026, Calumet, Inc. (the “Company”) entered into the Eleventh Amendment to the Third Amended and Restated Credit Agreement (the “Eleventh Amendment”). The Eleventh Amendment amended the Third Amended and Restated Credit Agreement, dated as of February 23, 2018 (the “Credit Agreement”), by and among Calumet GP, LLC, Calumet Specialty Products Partners, L.P. (the “Partnership”), certain subsidiaries of the Company party thereto, the lenders party thereto and Bank of America, N.A., as administrative agent. Among other changes, the Eleventh Amendment modified the Credit Agreement to provide for an increase in commitments from $500.0 million to $600.0 million, subject to borrowing base limitations. The foregoing description of the Eleventh Amendment is qualified in its entirety by reference to the full text of the Eleventh Amendment, a copy of which is filed as Exhibit 10.1 to this Current Report on Form 8-K and is incorporated herein by reference.

Prompts

Calumet, Inc (ticker CLMT), listed in United States.

Company History

Date Change Detail
Mar 5, 2024 Renamed CALUMET SPECIALTY PRODUCTS PARTNERS, L.P. → CALUMET, INC. /DE
— Re-registered Now files as Calumet, Inc. /DE (CIK 2013745), succeeding Calumet Specialty Products Partners, L.P. (CIK 1340122). Filings under both are this company's.

ETFs Holding Calumet, Inc

ETF Weight in ETF Shares Market value As of
JSML 0.62% 51,174 $ 2.261M Jul 31, 2026
JSMD 0.60% 143,598 $ 6.346M Jul 31, 2026
FTKI 0.33% 2,628 $ 83.991K Nov 16, 2026
AFSM 0.22% 10,087 $ 322.381K Nov 16, 2026
VFMO 0.21% 79,311 $ 3.944M Aug 31, 2026
IALT short -0.07% -171,327 $ -5.476M Nov 16, 2026
AVIE 0.04% 187 $ 5,976.52 Nov 16, 2026
MSSM 0.02% 2,422 $ 120.446K Aug 31, 2026
DFAS 0.01% 106,358 $ 3.877M Nov 12, 2026
FESM 0.00% 36 $ 1,296.72 Jun 30, 2026
AVUQ 0.00% 457 $ 14.606K Nov 16, 2026
NTRL short 0.00% -2,067 $ 0.00 Nov 16, 2026