CLFD
Fiscal year ends September Quarters are offset from the calendar — Q1 is Oct–Dec

Clearfield, Inc. designs, manufactures, and distributes fiber protection, fiber management, and fiber delivery solutions for broadband service providers. The company serves Tier 1 and Tier 2/3 telco carriers, utilities, municipalities, Multiple System Operators, and international customers primarily in North America, Europe, and the Caribbean. Its product portfolio includes the FieldSmart fiber management system, WaveSmart optical components, CraftSmart pedestals, and FieldShield fiber pathway protection. Clearfield also offers NOVA high-density panels and cassettes for data center and edge computing environments, as well as the BILT mobile application for installation guidance. The company manufactures products at facilities in Brooklyn Park, Minnesota, and Tijuana, Mexico, and supports Build America, Buy America compliance. Founded in 2007, Clearfield focuses on reducing labor costs and accelerating fiber-to-the-home and wireless network deployments through plug-and-play, factory-terminated connector technologies.

Summarised from the company's own disclosures, fiscal year ended Nov 2025

Industry Electronic Components Homepage seeclearfield.com
Sector Technology IR page ir.seeclearfield.com
Tags
fiber optic connectivity, fiber management, fiber protection, broadband infrastructure, data center fiber, ftth solutions, optical components, network infrastructure, FieldSmart, Clearview Cassette, WaveSmart, FiberFlex, CraftSmart, FiberFirst, YOURx, TetherSmart, FieldShield, ClearPass, NOVA, BILT
Press page ir.seeclearfield.com/news-events/press-releases

Metrics

Valuation  
Market cap $ 421.559M
Market cap (USD) $ 421.559M
P/E 194.63
PEG —
P/BV 1.72
P/S 2.77
P/OCF 33.40
P/FCF 46.72
Dividend yield —
Turnover / mcap —
Returns  
ROE 0.71%
ROI 0.80%
ROIC -0.67%
Profit margin 1.2%
Growth  
Revenue growing No
Profits growing Yes
Revenue up 3y No
Revenue up 5y No
Earnings growth 3y (net profit CAGR) -62.0%
Quality  
Profitable Yes
Margin expanding No
Buying back stock Yes
Diluting (TTM) No
Debt/Equity —
Podcast bulls (TTM) Sign up
Podcast bears (TTM) Sign up
Podcast sentiment (TTM) Sign up
Podcast sentiment % (TTM) Sign up
News sentiment (TTM) 18
Quality score -17.6%
Insiders  
Buys, 1w Sign up
Buys, 1m Sign up
Buys, 1y Sign up
Sells, 1w Sign up
Sells, 1m Sign up
Sells, 1y Sign up

Sign up to see this company's insider trades

Figure FY 2026 FY 2025 FY 2024 FY 2023 FY 2022 FY 2021 FY 2020 FY 2019 FY 2018 FY 2017 FY 2016 FY 2015 FY 2014 FY 2013 FY 2012 FY 2011 FY 2010 FY 2009 FY 2008 FY 2006 FY 2005 FY 2004 FY 2003 FY 2002 FY 2001 FY 2000 FY 1999
Revenue 151.939M 150.134M 166.705M 268.72M 270.883M 140.755M 93.075M 85.034M 77.651M 73.948M 75.288M 60.324M 58.045M 53.353M 37.474M 35.193M 24.367M 24.945M 23.494M 18.56M 15.718M 13.886M 11.909M — — 885.74K 420.809K
Net profit 1.785M -8.05M -12.453M 32.533M 49.362M 20.327M 7.293M 4.566M 4.275M 3.848M 8.013M 4.682M 5.433M 4.734M 7.701M 6.167M 1.181M 3.785M 1.514M -2.147M -3.349M -3.42M -6.535M -5.009M -4.738M -2.953M -3.796M
Free cash flow 9.024M 21.81M 12.656M 12.326M -7.499M 8.857M 4.85M 12.221M 3.481M 4.346M 10.003M 2.329M 10.11M 3.321M 3.276M 4.551M 176.67K 1.91M 119.997K -1.938M -3.704M -2.447M -6.382M -5.019M -4.804M -3.359M -3.733M

Figure FY 2026 FY 2025 FY 2024 FY 2023 FY 2022 FY 2021 FY 2020 FY 2019 FY 2018 FY 2017 FY 2016 FY 2015 FY 2014 FY 2013 FY 2012 FY 2011 FY 2010 FY 2009 FY 2008 FY 2006 FY 2005 FY 2004 FY 2003 FY 2002 FY 2001 FY 2000 FY 1999
Share price 31.14 34.38 38.96 28.66 104.64 44.15 20.17 11.85 13.45 13.6 18.8 13.43 12.73 13.43 5.15 6.45 2.58 3.15 1.26 — 1.35 — — — — — —
Price performance 12m -0.09 -0.12 0.36 -0.73 1.37 1.19 0.7 -0.12 -0.01 -0.28 0.4 0.05 -0.05 1.61 -0.2 1.5 -0.18 1.51 — — — — — — — — —

Filed figures

Figure Sep 2017 Sep 2018 Sep 2019 Sep 2020 Sep 2021 Sep 2022 Sep 2023 Sep 2024 Sep 2025 Sep 2026
Balance sheet detail
Trade receivables (USD) 7.24M 12.8M 9.12M 10.5M 19.4M 53.7M 28.4M 21.3M 18M 20.4M
↳ YoY growth -9.5% +77.1% -28.9% +15.1% +85.2% +176.3% -47.1% -24.9% -15.6% +13.6%
↳ 5y CAGR +19.1% +10.3% +12.6% +11.8% +19.4% +49.3% +17.2% +18.5% +11.4% +1.0%
Borrowings, current (USD) — — — — — 0.00 2.11M 0.00 — —
Borrowings, non-current (USD) — — — — 0.00 18.7M 0.00 2.23M — —
Lease liabilities (USD) — — 0.00 2.79M 2.53M 13.8M 14.4M 16.1M 8.76M 9.6M
Cash and deposits (USD) 18.5M 8.55M 10.1M 16.4M 13.2M 16.7M 37.8M 16.2M 21.5M 29.3M
Intangible assets (USD) 284,787 5.48M 5.15M 4.83M 4.7M 6.38M 6.09M 6.34M 9.35M 7.51M
Right-of-use assets (USD) — — 0.00 2.54M 2.31M 13.3M 13.9M 15.8M 8.42M 9.28M
Net debt (borrowings + leases - cash) (USD) — — — — -10.7M 15.8M -21.3M 2.19M — —
Cash flow detail
Operating cash flow (USD) 6.3M 4.55M 14.7M 6.66M 10.9M 1M 20M 22.2M 26.6M 12.6M
Purchases of property, plant and equipment (USD) -1.95M -1.07M -2.51M -1.81M -2.05M -8.5M -7.68M -9.57M -4.74M -3.6M
Purchases of intangible assets (USD) -69,936 -123,569 — — — — — — — —
Change in receivables (cash effect) (USD) 761,569 -5.58M 3.49M -1.38M -9.15M -24.2M 26.3M 7.8M -3.55M -2.44M
Change in inventories (cash effect) (USD) -80,412 1.18M 1.04M -5.4M -13.1M -43.7M -15.1M 32M 13.6M 4.1M
Change in payables (cash effect) (USD) -3.06M 723,990 — 3.15M 9.78M 14.5M -26.3M 544,000 5.56M -2.84M
Share buybacks (cash effect) (USD) -3.65M -1.76M — -428,654 0.00 0.00 0.00 -33.4M -16.7M -15.3M
Interest paid (cash effect) (USD) — — — 0.00 0.00 -119,000 -463,000 -394,000 0.00 —
Income taxes paid (cash effect) (USD) -1.47M -719,694 -1.68M -1.44M -5.5M -13.7M -13M -159,000 -1.67M 1.46M
Share-based compensation (USD) 2.32M 2M 1.73M 773,555 1.28M 2.34M 3.58M 4.64M 4.6M 4.65M
Operating cash flow before change in receivables (USD) 5.54M 10.1M 11.2M 8.03M 20.1M 25.2M -6.27M 14.4M 30.1M 15.1M
Free cash flow (OCF - PPE - intangibles) (USD) 4.28M 3.36M 12.2M 4.85M 8.86M -7.5M 12.3M 12.7M 21.8M 9.02M
Income detail
Research and development expense (USD) 865,568 787,364 1.09M 1.27M 1.24M 895,000 3.12M 3M 2.42M 2.07M
↳ 5y CAGR +9.1% +11.1% +8.2% +0.7% +31.7% +22.5% +13.8% +10.7%
Total comprehensive income (USD) — — — 7.29M 20.3M 47.5M 33.9M -10.8M -7.4M -649,000
Comprehensive income to owners (USD) — — — 7.29M 20.3M 47.5M 33.9M -10.8M -7.4M -649,000
Provision for credit losses (USD) — — — 0.00 209,612 0.00 0.00 — — —
Credit cost ratio (credit losses / average receivables) (%) — — — 0.0% 1.4% 0.0% 0.0% — — —
Reported May 2, 2018 Nov 14, 2018 Jul 30, 2020 Nov 23, 2022 Nov 23, 2022 Aug 8, 2023 Nov 15, 2024 Nov 15, 2024 Nov 25, 2025 Nov 17, 2026

Sign up to see institutional holdings

Sign Up

Podcast Mentions

Sign up to see podcast mentions and sentiment

Sign Up

Fiscal 2026 net sales from continuing operations of $151.9 million; Gross margin of 32.0%; Net income from continuing operations per diluted share of $0.16

Sales order backlog increased 75% to $43.3 million as of the end of fiscal 2026, compared to $24.7 million as of the end of the prior fiscal year

Began shipments against the previously announced $22 million data center order, marking a significant milestone in the expansion of our data center business

Expects full year fiscal 2027 revenue of $195 million to $205 million, representing just over 30% growth from fiscal year 2026 revenue at the midpoint of guidance

MINNEAPOLIS, Nov. 10, 2026 (GLOBE NEWSWIRE) -- Clearfield, Inc. (NASDAQ: CLFD), a leader in fiber connectivity solutions for telecom, data center, and network infrastructure environments, reported results for the fiscal fourth quarter and full year 2026. Additional commentary is provided in a letter to shareholders available in the Investor Relations section of the Company’s website.

Fiscal Q4 2026 Financial Summary

(in millions, except per share data and percentages) Q4 2026 vs.

Download as PDF November 05, 2026 6:00am EST

Strong, collaborative relationship helps rural electric cooperative advance deployment as BEAD-funded projects move forward

MINNEAPOLIS--(BUSINESS WIRE)-- Clearfield, Inc. (NASDAQ: CLFD), a leader in fiber connectivity solutions for telecom, data center, and network infrastructure environments, today announces its continued collaboration with East Central Energy (ECE), a Minnesota-based electric cooperative expanding fiber broadband access across rural Minnesota and northwestern Wisconsin. Recently, ECE became the first broadband provider in Minnesota to secure an executed Broadband Equity, Access, and Deployment (BEAD) Program agreement, with a project expected to bring high-speed connectivity to approximately 3,750 locations.

“Clearfield has been a trusted part of our fiber network since we began building it in 2023,” said Dennis Rice, Broadband Manager at East Central Energy. “As we expand into more rural areas, we need equipment that’s reliable and practical to deploy. Clearfield’s team has been extremely responsive in helping us navigate the challenges of these grant-funded projects, and that level of support makes a real difference as we continue growing our network.”

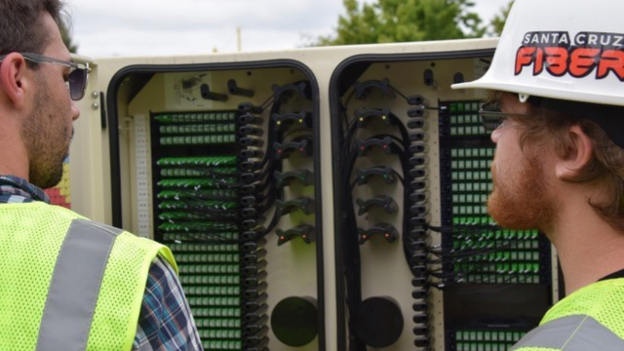
For its 2026 Wisconsin buildout, ECE selected several Clearfield solutions that comply with the Build America, Buy America (BABA) requirement, including FxMP fiber management panels, FxDS patch-only panels, and FieldSmart® Fiber Active Cabinet (FAC) enclosures. The panels feature Clearfield’s Clearview® Blue Cassettes and support high-density fiber connectivity, while the active cabinets provide integrated fiber management and power infrastructure. Together, these solutions are helping ECE establish the foundation for its growing fiber network while meeting federal funding requirements.

As ECE prepares for its next phase of construction under the federal BEAD program, Clearfield’s fiber management and active cabinet solutions are helping the cooperative build scalable networks while addressing deployment costs and federal funding requirements. The BEAD milestone builds on ECE’s ongoing fiber expansion, which has connected approximately 8,400 members since residential installations began in Fall 2023. With continued construction planned through 2030, ECE aims to serve approximately 25,000 members across its service territory.

“East Central Energy’s execution of Minnesota’s first BEAD program agreement by a broadband provider marks an important milestone in our efforts to expand reliable, high-speed internet access to unserved and underserved communities,” said Bree Maki, Executive Director at the State of Minnesota’s Office of Broadband Development, which is part of the state’s Department of Employment and Economic Development. “Reaching rural locations requires strong partnerships, detailed planning, and a commitment to delivering lasting infrastructure. As BEAD-funded projects move toward deployment, ECE’s relationship with Clearfield and build progress demonstrates the important role that local providers play in connecting more Minnesotans to the opportunities that broadband makes possible.”

Since 2023, ECE has relied on Clearfield fiber connectivity solutions to support the cooperative’s growing broadband network. As ECE fiber expands its footprint across Minnesota and Wisconsin, the relationship continues to play an important role in helping the cooperative manage deployment challenges, control infrastructure costs, and prepare for future network growth. Beyond providing equipment, Clearfield has worked closely with ECE to navigate BABA requirements, helping the cooperative prepare accurate equipment specifications and bills of materials for federally funded deployments. This support is particularly important as broadband providers transition from project planning to construction under BEAD.

“As BEAD-funded projects move toward construction, providers need solutions that help them manage costs, meet funding requirements, and build networks that will serve their communities for decades,” said Cheri Beranek, Chief Executive Officer at Clearfield. “East Central Energy is a great example of a provider taking a thoughtful approach to rural broadband expansion. We’re proud to support these efforts with reliable fiber infrastructure and the technical expertise needed to keep these projects moving forward.”

The ECE network is built on 10-gigabit-capable XGS-PON technology to support residential and business connectivity. The cooperative continues to expand its broadband operations and is developing an internal lab to support network testing, provisioning, and future technology upgrades.

Learn more at www.SeeClearfield.com .

About Clearfield, Inc.

Clearfield, Inc. (NASDAQ: CLFD) designs, manufactures, and distributes fiber optic management, protection, and delivery solutions that enable high-performance connectivity across a wide range of markets, helping to close the digital divide. Clearfield’s labor lite, craft-friendly platform is leveraged by community broadband providers, MSOs, incumbent service providers, ISPs, data centers, wireless providers, IoT networks, the military, municipalities, and cooperatives to connect homes, businesses, and critical infrastructure faster and more efficiently. Headquartered in Minneapolis, MN, Clearfield deploys more than a million fiber ports each year. For more information, visit www.SeeClearfield.com .

View source version on businesswire.com: https://www.businesswire.com/news/home/20261105882714/en/

Media Contact:
Christy Barbaran
Connect2 Communications
[email protected]

Source: Clearfield, Inc.

Released November 5, 2026

Download as PDF October 27, 2026 6:00pm EDT

MINNEAPOLIS, Oct. 27, 2026 (GLOBE NEWSWIRE) -- Clearfield, Inc. (NASDAQ: CLFD), a leader in fiber connectivity solutions for telecom, data center, and network infrastructure environments, today announced that it will release results for the fourth quarter of fiscal 2026, ended September 30, 2026, on Tuesday, November 10th, 2026, after the close of the market. The company will host a conference call at 5:00 p.m. Eastern time (4:00 p.m. Central time) to discuss its financial results with the investment community.

Financial results will be available on the Investor Relations section of the company’s website along with a shareholder letter.

Date: Tuesday, November 10, 2026
Time: 5:00 p.m. Eastern time (4:00 p.m. Central time)
U.S. dial-in: 1-844-501-2063
International dial-in: 1-412-365-5136

The conference call will be webcast live and available for replay here .

An audio replay of the call will be available after 8:00 p.m. Eastern time on the same day through November 24, 2026.

U.S. replay dial-in: 1-844-512-2921
International replay dial-in: 1-412-317-6671
Replay ID: 10212806

About Clearfield, Inc.

Clearfield, Inc. (NASDAQ: CLFD) designs, manufactures, and distributes fiber optic management, protection, and delivery solutions that enable high-performance connectivity across a wide range of markets, helping to close the digital divide. Clearfield’s labor lite, craft-friendly platform is leveraged by community broadband providers, MSOs, incumbent service providers, ISPs, data centers, wireless providers, IoT networks, the military, municipalities, and cooperatives to connect homes, businesses, and critical infrastructure faster and more efficiently. Headquartered in Minneapolis, MN, Clearfield deploys more than a million fiber ports each year. For more information, visit www.SeeClearfield.com .

Investor Relations Contact: Greg McNiff
The Blueshirt Group
773-485-7191
[email protected]

Source: Clearfield, Inc.

Primary Logo

Source: Clearfield, Inc.

Released October 27, 2026

Prompts

Clearfield, Inc. (ticker CLFD), listed in United States.

Company History

Date Change Detail
Jan 24, 2008 Renamed APA Enterprises, Inc. → CLEARFIELD, INC.
Feb 10, 2005 Renamed APA OPTICS INC /MN/ → APA Enterprises, Inc.

ETFs Holding Clearfield, Inc.

ETF Weight in ETF Shares Market value As of
WCEO 0.94% 3,112 $ 94.169K Jul 31, 2026
RUSC 0.16% 3,117 $ 124.025K Jun 30, 2026
SYZ 0.09% 1,610 $ 64.062K Jun 30, 2026
PSC 0.06% 34,595 $ 1.377M Jun 30, 2026
AVSC 0.02% 23,659 $ 677.594K Nov 16, 2026
DFSV 0.01% 117,409 $ 3.671M Nov 12, 2026
DFAS 0.01% 102,568 $ 3.207M Nov 12, 2026
DXUV 0.00% 7,351 $ 229.866K Nov 12, 2026
DFAC 0.00% 62,454 $ 1.953M Nov 12, 2026
MSSM 0.00% 368 $ 10.676K Aug 31, 2026
DFSU 0.00% 1,121 $ 35.054K Nov 12, 2026
DCOR 0.00% 16,595 $ 518.926K Nov 12, 2026
DFAU 0.00% 2,472 $ 77.299K Nov 12, 2026
DFUS 0.00% 3,012 $ 94.185K Nov 12, 2026
AVUS 0.00% 690 $ 19.762K Nov 16, 2026