CHSCN
Fiscal year ends August Quarters are offset from the calendar — Q1 is Sep–Nov

CHS Inc. is a farmer-owned agricultural cooperative that provides grain, food, agronomy, and energy resources to businesses and consumers globally. The company operates through three primary segments: Energy, Ag, and Nitrogen Production. Its Energy segment refines crude oil into gasoline, diesel, and other petroleum products at facilities in Laurel, Montana, and McPherson, Kansas, and distributes these fuels, propane, and lubricants under the Cenex brand. The Ag segment handles the origination and marketing of grain and oilseeds, wholesale agronomy sales of crop nutrients and protection products, and the production of renewable fuels and processed soy products. CHS also holds equity investments in CF Industries Nitrogen, LLC, Ventura Foods, LLC, and Ardent Mills, LLC. Owned by farmers, ranchers, and member cooperatives across the United States, the company serves customers internationally and operates retail and wholesale networks in numerous U.S. communities. CHS Inc. was formed in 1998 through the merger of Cenex, Inc. and Harvest States Cooperatives, with origins dating back to the late 1920s.

Summarised from the company's own disclosures, fiscal year ended Nov 2025

Industry Oil & Gas Refining & Marketing Homepage chsinc.com
Sector Energy IR page chsinc.com/about-us/owners-and-investors
Tags
agricultural cooperative, petroleum refining, grain marketing, agronomy, crop protection, propane distribution, renewable fuels, soybean processing, nitrogen production, food distribution, Cenex, CF Industries Nitrogen LLC, Ventura Foods LLC, Ardent Mills LLC, Front Range Pipeline LLC, Cenex Pipeline LLC, MyCHS, CHS Connect
Press page chsinc.com/news-and-stories/news-releases

Metrics

Valuation  
Market cap —
Market cap (USD) —
P/E —
PEG —
P/BV —
P/S —
P/OCF —
P/FCF —
Dividend yield —
Turnover / mcap —
Returns  
ROE 9.6%
ROI 8.0%
ROIC 4.2%
Profit margin 5.9%
Growth  
Revenue growing No
Profits growing No
Revenue up 3y No
Revenue up 5y No
Earnings growth 3y (net profit CAGR) -16.8%
Quality  
Profitable Yes
Margin expanding Yes
Buying back stock —
Diluting (TTM) —
Debt/Equity 17.2%
Podcast bulls (TTM) Sign up
Podcast bears (TTM) Sign up
Podcast sentiment (TTM) Sign up
Podcast sentiment % (TTM) Sign up
News sentiment (TTM) 31
Quality score -9.1%
Insiders  
Buys, 1w Sign up
Buys, 1m Sign up
Buys, 1y Sign up
Sells, 1w Sign up
Sells, 1m Sign up
Sells, 1y Sign up

Sign up to see this company's insider trades

Figure FY 2026 FY 2025 FY 2024 FY 2023 FY 2022 FY 2021 FY 2020 FY 2019 FY 2018 FY 2017 FY 2016 FY 2015 FY 2014 FY 2013 FY 2012 FY 2011 FY 2009 FY 2008 FY 2007 FY 2006 FY 2005 FY 2004 FY 2003 FY 2002 FY 2001 FY 2000
Revenue 18.423B 35.463B 39.261B 45.59B 47.792B 38.448B 28.406B 31.9B 32.683B 31.935B 30.347B 34.582B 42.664B 44.48B 40.599B 36.916B 25.73B 32.167B 17.216B 14.384B 11.941B 11.051B 9.399B 7.845B 7.875B —
Net profit 1.096B 597.917M 1.102B 1.9B 1.679B 553.952M 422.439M 829.88M 775.907M 127.857M 424.192M 781.045M 1.081B 992.386M 1.261B 961.355M 381.407M 803.045M 750.333M 490.297M 250.016M 221.332M 123.841M 126.138M 178.554M —
Free cash flow 1.121B -92.788M 464.117M 2.72B 1.592B 440.017M 668.87M 696.715M 716.656M 488.597M 570.718M -616.78M 483.463M 1.818B 250.025M -9.347M 1.42B 487.203M -678K 219.95M -48.282M 88.141M 40.817M -181.853M 155.219M —

Figure FY 2026 FY 2025 FY 2024 FY 2023 FY 2022 FY 2021 FY 2020 FY 2019 FY 2018 FY 2017 FY 2016 FY 2015 FY 2014 FY 2013 FY 2012 FY 2011 FY 2009 FY 2008 FY 2007 FY 2006 FY 2005 FY 2004 FY 2003 FY 2002 FY 2001 FY 2000
Share price — — — — 27.03 — — — — — — — 27.55 — — — — — — — — — — — — —

Filed figures

Figure Aug 2016 Aug 2017 Aug 2018 Aug 2019 Aug 2020 Aug 2021 Aug 2022 Aug 2023 Aug 2024 Aug 2025
Balance sheet detail
Trade receivables (USD) 2.88B 1.87B 2.46B 2.73B 2.37B 2.86B 3.55B 3.11B 3.55B 3.69B
↳ YoY growth +2.2% -35.1% +31.6% +11.0% -13.4% +20.9% +24.0% -12.5% +14.3% +3.8%
↳ 5y CAGR -0.7% -12.2% -5.5% -1.8% -3.4% -0.1% +13.7% +4.8% +5.4% +9.3%
Borrowings, current (USD) 214M 156M 168M 39.2M 189M 38.5M 291M 7.84M 337M 90.4M
Borrowings, non-current (USD) 2.09B 2.02B 1.76B 1.75B 1.6B 1.58B 1.67B 1.82B 1.82B 1.75B
Lease liabilities (USD) — — — 267M 31.5M — — — — —
Cash and deposits (USD) 279M 181M 451M 211M 141M 413M 794M 1.77B 795M 328M
Intangible assets (USD) 44.8M 33.3M 29.3M 71.2M 65M 58.4M 53.2M 47M 42.1M 94.4M
Right-of-use assets (USD) — — — 268M 258M 253M 243M 255M 219M 239M
Net debt (borrowings + leases - cash) (USD) 2.02B 2B 1.48B 1.58B 1.68B 1.21B 1.16B 62.4M 1.37B 1.51B
Cash flow detail
Operating cash flow (USD) 1.26B 933M 1.07B 1.14B 1.09B 758M 1.95B 3.28B 1.27B 636M
Purchases of property, plant and equipment (USD) -693M -444M -355M -443M -418M -318M -354M -565M -809M -729M
Change in receivables (cash effect) (USD) 46.4M 122M 211M -218M 308M -569M -548M 646M -336M 7M
Change in inventories (cash effect) (USD) 339M -294M -170M 285M 105M -549M -318M 438M 148M -53.2M
Change in payables (cash effect) (USD) -129M 197M -78.4M -38.2M -331M 1.01B 555M -127M -214M -276M
Interest paid (cash effect) (USD) -147M -160M -149M -172M -119M -102M -114M -139M -101M -148M
Income taxes paid (cash effect) (USD) -5.18M -14.6M -13.4M -19.9M -6.84M 8.84M -19.7M -184M -129M -77.1M
Operating cash flow before change in receivables (USD) 1.22B 811M 861M 1.36B 779M 1.33B 2.49B 2.64B 1.61B 629M
Free cash flow (OCF - PPE - intangibles) (USD) 571M 489M 717M 697M 669M 440M 1.59B 2.72B 464M -92.8M
Income detail
Total comprehensive income (USD) 426M 155M 783M 806M 417M 571M 1.64B 1.89B 1.07B 588M
Comprehensive income to owners (USD) 427M 156M 783M 808M 415M 571M 1.64B 1.89B 1.07B 588M
Provision for credit losses (USD) 57.2M 178M 2.09M 57.7M 3.42M 6.69M 19.9M -15.6M 5.63M 6.14M
Credit cost ratio (credit losses / average receivables) (%) 2.0% 7.5% 0.1% 2.2% 0.1% 0.3% 0.6% 0.5% 0.2% 0.2%
Reported Nov 3, 2016 Nov 9, 2017 Dec 3, 2018 Jan 8, 2020 Nov 5, 2020 Nov 4, 2021 Nov 2, 2022 Nov 8, 2023 Nov 6, 2024 Nov 5, 2025

Sign up to see institutional holdings

Sign Up

Podcast Mentions

Sign up to see podcast mentions and sentiment

Sign Up

Contact: Trish Scorpio

651-355-4593

[email protected]

CHS Reports Fiscal Year 2026 Net Income of $1.1 Billion

Energy, Grains and Agronomy Performance Driven by Evolving Market Dynamics;

Company Intends to Return $300 Million Cash to Owners in 2027

ST. PAUL, Minn. (November 4, 2026) — CHS Inc., a global agribusiness and the nation's leading cooperative, today reported net income of $1.1 billion for the fiscal year ended August 31, 2026, compared to $597.9 million for fiscal year 2025.

Key highlights for fiscal year 2026 financial results include:

•Consolidated revenues of $39.2 billion for fiscal year 2026 compared to $35.5 billion for fiscal year 2025 with the increase due largely to higher commodity prices.

•Our Energy segment recorded strong refining margins, driven by global market dynamics and high refinery production volumes, which were partially offset by record-high expenses for renewable energy credits (RINs).

•Our Grains segment benefited from strong oilseed crush and ethanol margins resulting from renewable energy policy impacts, which were partially offset by global trade headwinds and reduced retail margins.

Energy, grains and agronomy performance is driven by evolving market dynamics. CHS announces intention to return $300 million in cash to owners in 2027.

November 4, 2026

CHS Inc., a global agribusiness and the nation’s leading cooperative, today reported net income of $1.1 billion for the fiscal year ended August 31, 2026, compared to $597.9 million for fiscal year 2025.  

Key highlights for fiscal year 2026 financial results include: 

  • Consolidated revenues of $39.2 billion for fiscal year 2026 compared to $35.5 billion for fiscal year 2025 with the increase due largely to higher commodity prices. 
  • Our Energy segment recorded strong refining margins, driven by global market dynamics and high refinery production volumes, which were partially offset by record-high expenses for renewable energy credits (RINs).  
  • Our Grains segment benefited from strong oilseed crush and ethanol margins resulting from renewable energy policy impacts, which were partially offset by global trade headwinds and reduced retail margins.  
  • Continued strong performance by our CF Nitrogen investment was offset by lower agronomy volumes, driven by reduced demand related to ongoing weakness in the U.S. farm economy.  

“Our results demonstrate the strength of our diversified businesses and strategic supply chain investments,” said Jay Debertin, president and CEO. “While market and policy conditions continued to shift and create volatility throughout the year, our teams executed exceptionally well across our operations, allowing us to capture opportunities in energy and agriculture markets while continuing to serve our owners.” 

CHS also reported intended distribution of $300 million in cash patronage and equity redemptions to its owners in fiscal year 2027, an approximately 150% increase over the fiscal year 2026 distribution. The total will be distributed as $150 million in cash patronage and up to $150 million in equity redemptions. When the planned distributions are complete in 2027, CHS will have returned more than $2.7 billion to owners over the past five years. 

“These planned cash returns to our owners demonstrate the benefits of CHS ownership and the CHS Board of Directors’ commitment to sharing profits with our owners and strengthening rural communities, while investing in our businesses,” Debertin added. 

CHS recently announced several significant investments, including a proposed nearly $450 million phosphate production facility to be built in Louisiana in a joint venture with OCP North America and a new approximately $700 million soybean processing facility in Evansville, Wisconsin, which would increase CHS soy processing capacity by two-thirds. Pending project-related approvals, both facilities are expected to be operational in late 2028 or 2029. 

Fiscal Year 2026 Business Segment Results 

Energy 

This segment includes our refined fuels, propane and lubricants product lines. Pretax earnings of $554.6 million represent a $573.6 million increase versus the prior year and reflect: 

  • Significantly improved refining margins driven by global market dynamics, partially offset by unrealized hedging losses. 
  • Record-high renewable fuels compliance costs, partially offset by reduced blending obligations at our Laurel, Montana, refinery. 
  • Strong operational performance by our refineries enabled by recent capital investments. 

Grains 

The Grains segment primarily includes our feed grains, oilseeds, wheat, specialty grains and animal nutrition product lines. Pretax earnings of $127.4 million represent an $83.4 million increase versus the prior year and reflect: 

  • Strong oilseed crush margins in the second half of the fiscal year, driven by growing demand due to increasing biofuels blending obligations. 
  • Solid feed grains export volumes, along with strong ethanol margins in response to U.S. policy impacts. 
  • These results were partially offset by continued global trade volatility and weakening retail margins. 

Agronomy 

This segment includes crop nutrients, crop protection and CF Nitrogen. Pretax earnings of $354.6 million represent a $20.6 million decrease versus the prior year and reflect: 

  • Strong performance by our CF Nitrogen joint venture investment due to favorable market conditions for urea and UAN. 
  • Decreased volumes due to deferred purchasing decisions by U.S. farmers and lower margins in agronomy products as a result of strong competition and negative market dynamics.  

Corporate and Services 

This segment includes CHS Capital and CHS Hedging, as well as our Ardent Mills and Ventura Foods joint ventures. Pretax earnings of $92.1 million represent a $122.4 million decrease versus the prior year and reflect: 

  • Lower equity method earnings from our joint ventures and gain on sale of a business by Ventura Foods in 2025, which did not reoccur in 2026. 

CHS Inc. Earnings*

by Segment
(in thousands $)

Years Ended August 31,
2026 2025
Energy $554,590 (19,015)
Grains 127,378 44,003
Agronomy 354,640 375,283
Corporate and Services 92,111 214,501
Income before income taxes 1,128,719 614,772
Income tax expense 32,737 16,777
Net income 1,095,982 597,995
Net income attributable to noncontrolling interests 79 78
Net income attributable to CHS Inc. $ 1,095,903 597,917

*Earnings is defined as income (loss) before income taxes. Starting in fiscal year 2026, the company’s financial segments have changed to align with its new end-to-end product line operating model. As a result of this change, all prior period segment information has been recast to conform to current year presentation.

CHS Inc. (www.chsinc.com ) creates connections to empower agriculture. As a leading global agribusiness and the largest farmer-owned cooperative in the United States, CHS serves customers in 65 countries. We provide critical crop inputs, market access and risk management services that help farmers feed the world. Our diversified agronomy, grains, foods and energy businesses recorded revenues of approximately $39 billion in fiscal year 2026. CHS is committed to reducing our impact on the planet, finding and developing new solutions in agriculture and energy, and investing in ways to build a better future for our owners, customers, employees and communities.

This document and other CHS Inc. publicly available documents contain, and CHS officers, directors and representatives may from time to time make, “forward-looking statements” within the meaning of the safe harbor provisions of the U.S. Private Securities Litigation Reform Act of 1995. Forward-looking statements can be identified by words such as “anticipate,” “intend,” “plan,” “goal,” “seek,” “believe,” “project,” “estimate,” “expect,” “strategy,” “future,” “likely,” “may,” “should,” “will” and similar references to future periods. Forward-looking statements are neither historical facts nor assurances of future performance. Instead, they are based only on CHS current beliefs, expectations and assumptions regarding the future of its businesses, financial condition and results of operations, future plans and strategies, projections, anticipated events and trends, the economy and other future conditions. Because forward-looking statements relate to the future, they are subject to inherent uncertainties, risks and changes in circumstances that are difficult to predict and many of which are outside of CHS control. CHS actual results and financial condition may differ materially from those indicated in the forward-looking statements. Therefore, you should not place undue reliance on any of these forward-looking statements. Important factors that could cause CHS actual results and financial condition to differ materially from those indicated in the forward-looking statements are discussed or identified in CHS filings made with the U.S. Securities and Exchange Commission, including in the “Risk Factors” discussion in Item 1A of CHS Annual Report on Form 10-K for the fiscal year ended August 31, 2026. These factors may include changes in commodity prices; political, economic, legal and other risks of doing business globally; ongoing wars and global conflicts; global and regional factors impacting demand for CHS products; the impact of inflation; the impact of competitive business markets; any loss of members who choose to do business with other companies instead of CHS; the impact of market acceptance of alternatives to refined petroleum products; consolidation among CHS suppliers and customers; nonperformance or nonpayment by contractual counterparties; deterioration in credit quality of, or defaults by, third parties who owe CHS money; the effectiveness of CHS risk management strategies; actual or perceived quality, safety or health risks associated with CHS products; business interruptions, casualty losses and supply chain issues; the impact of epidemics, pandemics, outbreaks of disease and other adverse public health developments; the impact of workforce factors; technological improvements and sustainability initiatives that decrease demand for CHS products; advancement of artificial intelligence, including generative artificial intelligence, which introduces evolving technical, legal and opportunistic risks; security breaches or other disruptions in CHS information technology systems or assets; evolving expectations with respect to environmental, social and governance practices; failures or delays in achieving strategies or expectations related to climate change or other environmental matters; CHS ability to complete, integrate and benefit from acquisitions, strategic alliances, joint ventures, divestitures and other nonordinary course-of-business events; the impact of government policies, mandates, regulations, trade agreements, domestic and foreign trade policies, including relating to tariffs, and other factors beyond CHS control; changes in federal income tax laws or our tax status; the impact and costs of compliance or noncompliance with applicable laws and regulations; the costs of compliance with environmental and energy laws and regulations; our ability to comply with extensive anti-corruption, anti-bribery, anti-kickback and trade laws and regulations; the impact of environmental liabilities and litigation; the impact of seasonality; the impairment of long-lived assets; CHS funding needs and financing sources; financial institutions’ and other capital sources’ policies concerning energy-related businesses; limits on CHS ability to access equity capital due to its cooperative structure; and other factors affecting our businesses generally. Any forward-looking statements made by CHS in this document are based only on information currently available to CHS and speak only as of the date on which the statement is made. CHS undertakes no obligation to update any forwardlooking statement, whether written or oral, that may be made from time to time, whether as a result of new information, future developments or otherwise except as required by applicable law.

Download print-friendly PDF

Share Links

Share on Facebook Share on LinkedIn Copy link to clipboard


Recent headlines

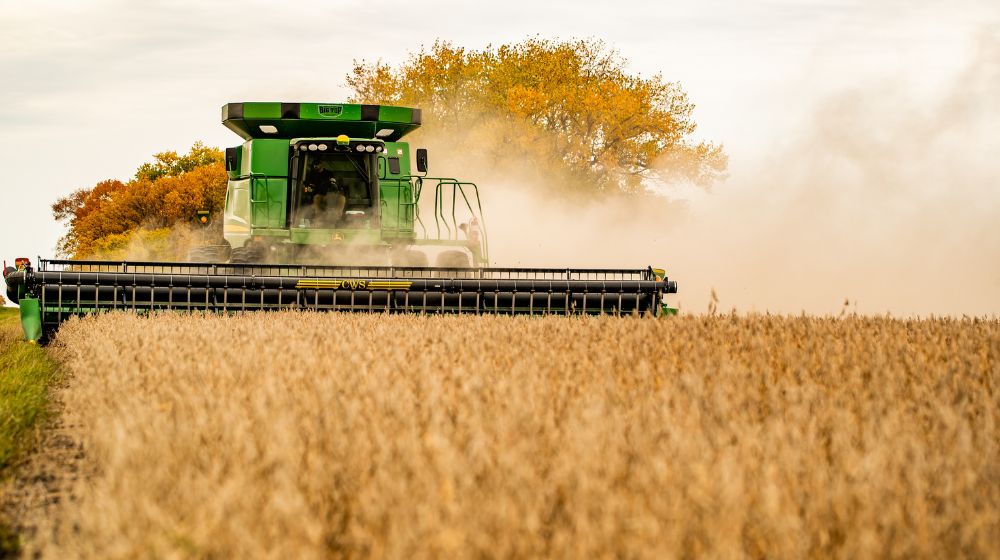
A combine harvesting a field.

Financials November 4, 2026

CHS reports fiscal year 2026 net income of $1.1 billion

Energy, grains and agronomy performance is driven by evolving market dynamics. CHS announces intention to return $300 million in cash to owners in 2027.

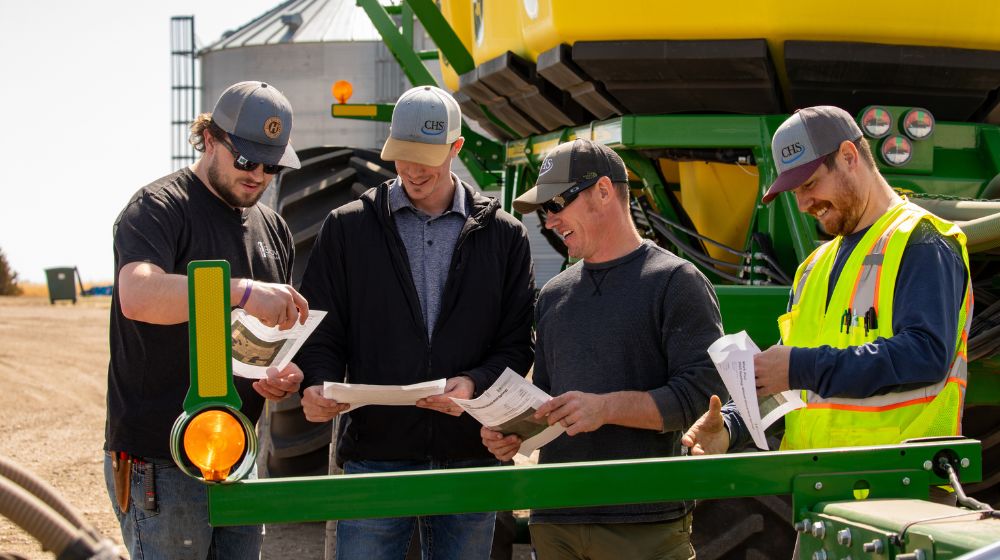
Four men standing beside farm equipment talking and smiling

Cooperative spirit October 22, 2026

Stronger together: The relationships behind the cooperative

Farmers and cooperative leaders share their perspectives on working with co-ops.

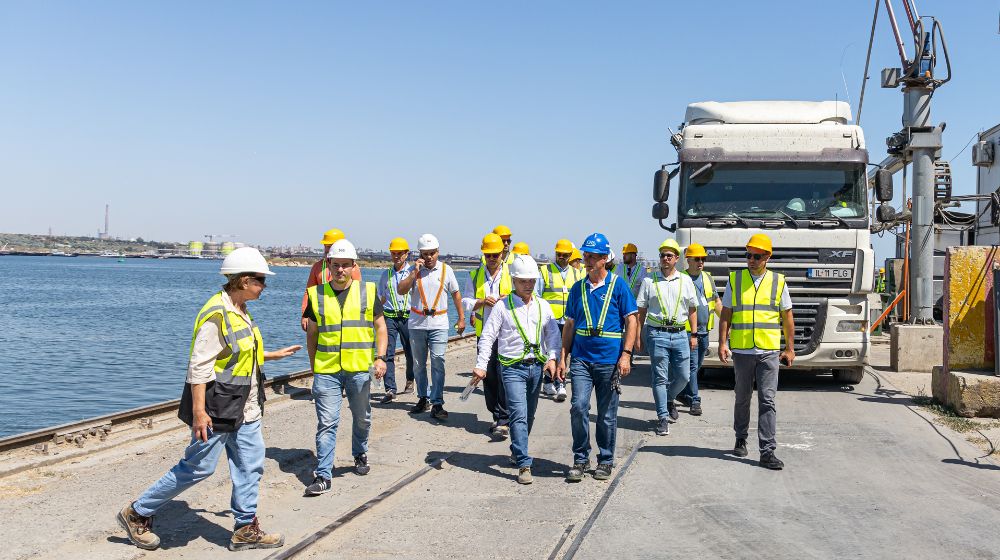
People walking on a dock by the water with a truck in the background.

Cooperative spirit October 20, 2026

Cooperative advantage: How cooperative spirit drives confidence around the world

CHS earns trust of grain suppliers through its cooperative model and expansion of its Silotrans export terminal.
Contact

5500 Cenex Drive
Inver Grove Heights
Minnesota 55077
651-355-6000

Company

Resources

Stay Connected

Footer Decoration

CHS Inc

© 2026 CHS Inc.

CHS Inc — Other Events Bull 0 Bear 0 Routine

On November 3, 2026, CHS Inc. declared regular quarterly dividends of $0.50, $0.492188, $0.443750, $0.421875 and $0.468750 on our 8% Cumulative Redeemable Preferred Stock, Class B Cumulative Redeemable Preferred Stock Series 1, Class B Reset Rate Cumulative Redeemable Preferred Stock Series 2, Class B Reset Rate Cumulative Redeemable Preferred Stock Series 3 and Class B Cumulative Redeemable Preferred Stock Series 4, respectively, $25.00 per share, payable on December 31, 2026, to Shareholders of record on December 16, 2026. This Current Report on Form 8-K is being filed in accordance with Nasdaq Listing Rule 5250(e)(6)(ii) and Rule 10b–17 of the Securities Exchange Act of 1934, as amended.

Prompts

CHS Inc (ticker CHSCN), listed in United States.

Company History

Date Change Detail
Aug 5, 2003 Renamed CENEX HARVEST STATES COOPERATIVES → CHS INC

ETFs Holding CHS Inc

ETF Weight in ETF Shares Market value As of
FPE 0.17% 440,990 $ 9.483M Nov 16, 2026

Securities

Ticker Type Class Market Exchange Last price Price date
CHSCP Preferred — US nasdaq — —
CHSCL Preferred — US nasdaq — —
CHSCM Preferred — US nasdaq — —
CHSCN canonical Common share — US nasdaq — —
CHSCO Preferred — US nasdaq — —