April 29, 2026 7:30am EDT Download as PDF Related Documents Earnings Webcast Audio Presentation PDF 10-Q Filing HTML PDF XBRL ZIP Company reaffirms full-year 2026 financial outlook and declares $0.12 quarterly dividend ATCHISON, Kan.--(BUSINESS…
April 29, 2026 7:30am EDT Download as PDF
Related Documents
Earnings Webcast
Audio
Presentation
PDF
10-Q Filing
HTML
PDF
XBRL
ZIP
Company reaffirms full-year 2026 financial outlook and declares $0.12 quarterly dividend
ATCHISON, Kan.--(BUSINESS WIRE)-- MGP Ingredients**, Inc. (Nasdaq: MGPI),** a leading provider of branded and distilled spirits and food ingredient solutions, today reported results for the first quarter ended March 31, 2026.
“I’m pleased with our first quarter results, as sales were in-line with expectations, while adjusted EBITDA and adjusted basic EPS came in ahead of our plans. During the quarter, we remained focused on disciplined execution and long-term value creation, as we continued to navigate a challenging industry backdrop,” said Julie Francis, president and CEO. “We also maintained momentum in our premium plus portfolio, led by Penelope Bourbon and continued demand for our specialty offerings, and delivered growth in Ingredient Solutions, reflecting improvements in operational reliability. As we move through 2026, we will continue to follow our strategic roadmap and drive our key growth initiatives, while prioritizing our best opportunities for growth, taking decisive actions, and executing with discipline.”
First Quarter 2026 Financial Highlights Compared to First Quarter 2025:
- Consolidated sales decreased 13% to $106.4 million.
- Consolidated gross profit decreased 22% to $33.6 million. Gross margin decreased by 400 basis points to 31.6%.
- Net income decreased to a loss of $134.8 million, primarily due to discrete, non-cash adjustments of $179.5 million to reduce the carrying amount of goodwill and other long-lived assets in the Branded Spirits segment. Adjusted net income decreased 57% to $3.3 million.
- Basic earnings per common share decreased to $(6.30) per share from $(0.14) per share, primarily due to the adjustments described above. Adjusted basic EPS decreased 58% to $0.15 per share.
- Adjusted EBITDA decreased 31% to $15.0 million.
- Capital expenditures declined 75% to $2.0 million as the company continued to optimize its capital spend in light of the current industry environment.
- Net debt leverage ratio was approximately 2.1x as of March 31, 2026.
Consolidated Results
First quarter 2026 sales decreased by 13% versus the prior year, primarily due to expected declines in brown goods sales in the Distilling Solutions segment. The lower brown goods sales volume also pressured profitability, resulting in declines in gross profit and gross margin. Operating income decreased to a loss of $173.2 million, primarily due to discrete, non-cash adjustments to goodwill and other long-lived assets. On an adjusted basis, operating income decreased by 49% to $7.9 million. For the quarter, adjusted EBITDA decreased 31% to $15.0 million.
First quarter advertising and promotion expenses decreased 24% to $6.2 million, as the company continued to realign spend behind its most attractive growth opportunities, with Branded Spirits advertising and promotion spend of $6.0 million or approximately 13.6% of Branded Spirits segment sales. First quarter selling, general and administrative expense declined 1%, while adjusted SG&A decreased 2% and represented 18% of consolidated sales.
During the first quarter of 2026, the company recorded a $115.7 million non-cash adjustment to the carrying value of goodwill and a $37.0 million non-cash adjustment to the carrying value of indefinite-lived intangible assets in the Branded Spirits segment, primarily due to certain unfavorable macroeconomic factors such as a higher discount rate and lower peer valuation multiples. Additionally, during the first quarter, the company recorded a $26.9 million long-lived fixed asset impairment related to equipment at its Lux Row distillery in Bardstown, KY, which, as previously announced, is being temporarily idled beginning in May 2026. These charges resulted in a net loss of $134.8 million and basic EPS loss of $(6.30) for the first quarter. On an adjusted basis, first quarter net income and basic EPS were $3.3 million and $0.15 per share, respectively.
Branded Spirits
Branded Spirits segment sales of $44.2 million decreased 8% versus the prior year quarter. Premium plus sales increased by 1.5%, as the company’s targeted focus on growth opportunities continued to gain traction. Within this portfolio, Penelope Bourbon maintained its strong growth trajectory and was up 10% versus the prior year. As expected, sales of private label bottled products within the other category declined year-over-year. Combined sales of mid- and value-priced portfolios declined by 3%, as the company continued to successfully prioritize its best performing offerings in these price tiers. Branded Spirits gross margin increased by 180 basis points to 47.8%, while gross profit moderated slightly to $21.1 million.
Distilling Solutions
Distilling Solutions segment sales of $28.0 million decreased by 40% versus the prior year, while gross profit declined 54% to $8.6 million, or 30.8% of segment sales. As expected, lower demand for aged and new distillate whiskey continued to pressure segment results and drove a 56% decline in brown goods sales for the first quarter.
Ingredient Solutions
Ingredient Solutions segment sales of $34.2 million increased by 29% versus the prior year, primarily driven by higher sales volume and price/mix of specialty wheat proteins and starches. Segment gross profit increased to $3.8 million, or 11.2% of segment sales, as higher sales of specialty protein and starch products partially offset higher waste starch stream disposal costs.
2026 Financial Outlook
MGP reaffirmed its consolidated guidance for fiscal 2026:
- Sales projected to be in the range of $480 million to $500 million.
- Adjusted EBITDA expected to be between $90 million to $98 million.
- Adjusted basic EPS expected to be in the $1.50 to $1.80 range, with weighted average basic shares outstanding of approximately 21.4 million.
- An effective tax rate of approximately 27%.
- Full-year capital expenditures expected to be approximately $20 million.
Dividend Distribution
The company’s Board of Directors declared a dividend of $0.12 per share of common stock. The dividend is payable on May 29, 2026, to stockholders of record as of May 15, 2026.
Conference Call and Webcast Information
MGP Ingredients will host a conference call today at 10 a.m. ET, April 29, 2026, to discuss the results, provide a general business update, and answer questions. Please visit the News and Events section of the company’s Investor Relations website to access the webcast. Investors can also dial (844) 308-6398 or (412) 717-9605 (international) to listen to the call. A replay will be available on the company’s website approximately 24 hours after the call concludes.
About MGP Ingredients, Inc.
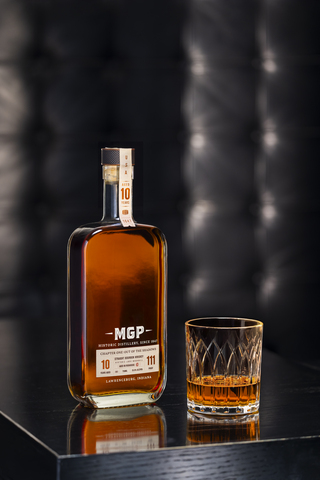
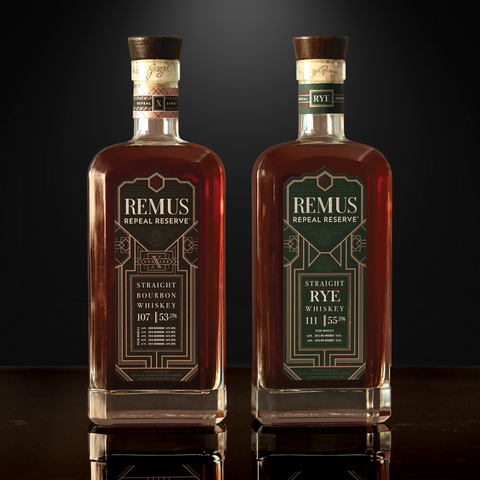
MGP Ingredients Inc. (Nasdaq: MGPI) has been formulating excellence since 1941 by bringing product ideas to life across the alcoholic beverage and specialty ingredient industries through three segments: Branded Spirits, Distilling Solutions, and Ingredient Solutions. MGPI is one of the leading spirits distillers with an award-winning portfolio of premium brands including Penelope, Rebel, Remus, and Yellowstone bourbons and El Mayor tequila, under the Luxco umbrella. With distilleries in Indiana and Kentucky; a tequila distillery in Arandas, Mexico; and bottling operations in Missouri, Ohio, and Northern Ireland, the company creates distilled spirits for customers including many world-renowned spirits brands. In addition, the company’s high-quality specialty fiber, protein, and starch ingredients provide functional, nutritional, and sensory solutions for a wide range of food products. To learn more visit MGPIngredients.com
.
Cautionary Note Regarding Forward-Looking Statements
This press release may contain forward-looking statements within the meaning of the Private Securities Litigation Reform Act of 1995, including without limitation statements about the ability of MGP Ingredients, Inc. (the “Company” or “MGP”) to drive growth initiatives, prioritize growth opportunities, take decisive actions, and execute with discipline; and the Company’s 2026 outlook, including its expectations for sales, adjusted EBITDA, adjusted basic earnings per share (“EPS”), shares outstanding, tax rate, and capital expenditures. Forward looking statements are usually identified by or are associated with words such as “intend,” “plan,” “believe,” “estimate,” “expect,” “anticipate,” “project,” “forecast,” “hopeful,” “should,” “may,” “will,” “could,” “encouraged,” “opportunities,” “potential,” and similar terminology. These forward-looking statements reflect management’s current beliefs and estimates of future economic circumstances, industry conditions, Company performance, Company financial results, and Company financial condition and are not guarantees of future performance.
All forward-looking statements are subject to risks and uncertainties that could cause actual results to differ materially. Factors that could cause actual results to differ materially from our expectations include without limitation any effects of changes in consumer preferences and purchases and our ability to anticipate or react to those changes; our ability to compete effectively and any effects of industry dynamics and market conditions; unfavorable economic conditions; damage to our reputation or that of any of our key customers or their brands; failure to introduce successful new brands and products or have effective marketing or advertising; changes in public opinion about alcohol or our products; our reliance on our distributors to distribute our branded spirits; our reliance on fewer, more profitable customer relationships; interruptions in our operations or a catastrophic event at our facilities; decisions concerning the quantity of maturing stock of our aged distillate; any inability to successfully complete our capital projects or fund capital expenditures or any warehouse expansion issues; our reliance on a limited number of suppliers; work disruptions or stoppages; climate change and measures to address climate change; regulation and taxation and compliance with existing or future laws and regulations; tariffs, trade relations, and trade policies; excise taxes, incentives and customs duties; our ability to protect our intellectual property rights and defend against alleged intellectual property rights infringement claims; failure to secure and maintain listings in control states; labeling or warning requirements or limitations on the availability of our products; product recalls or other product liability claims; anti-corruption laws, trade sanctions, and restrictions; litigation or legal proceedings; limited rights of common stockholders and anti-takeover provisions in our governing documents; the impact of issuing shares of our common stock; higher costs or the unavailability and cost of raw materials, product ingredients, energy resources, or labor; failure of our information technology systems, networks, processes, associated sites, or service providers; inability to successfully implement our strategies; interest rate increases; reliance on key personnel; impairment charges; commercial, political, and financial risks; covenants and other provisions in our credit arrangements; pandemics or other health crises; ability to pay any dividends and make any share repurchases. For further information on these risks and uncertainties and other factors that could affect the Company’s business, see the “Risk Factors” and “Management’s Discussion and Analysis of Financial Condition and Results of Operations” sections of the Company’s Annual Report on Form 10-K for the year ended December 31, 2025, and its Quarterly Report on Form 10-Q for the quarter ended March 31, 2026, as well as the Company’s other SEC filings. The Company undertakes no obligation to update any forward-looking statements or information in this press release, except as required by law.
Non-GAAP Financial Measures
In addition to reporting financial information in accordance with U.S. GAAP, the Company provides certain non-GAAP financial measures that are not in accordance with, or alternatives for, GAAP. In addition to the comparable GAAP measures, the Company has disclosed adjusted selling, general, and administrative expenses (“SG&A”), adjusted operating income, adjusted income before income taxes, adjusted net income, adjusted MGP earnings, adjusted EBITDA, net debt, net debt leverage ratio, and adjusted basic and diluted EPS, as well as guidance for adjusted EBITDA and adjusted basic EPS. The presentation of these non-GAAP financial measures should be reviewed in conjunction with SG&A, operating income, income before income taxes, net income, net income used in earnings per common share calculation, debt, and basic and diluted EPS computed in accordance with U.S. GAAP and should not be considered a substitute for the GAAP measure. We believe that the non-GAAP measures provide useful information to investors regarding the Company's performance and overall results of operations. In addition, management uses these non-GAAP measures in conjunction with GAAP measures when evaluating the Company’s operating results compared to prior periods on a consistent basis, assessing financial trends, and for forecasting purposes. Non-GAAP financial measures may not provide information that is directly comparable to other companies, even if similar terms are used to identify such measures. The attached schedules provide a full reconciliation of historical non-GAAP financial measures to the most directly comparable U.S. GAAP financial measure. Full year 2026 guidance measures of adjusted EBITDA and adjusted basic EPS are provided on a non-GAAP basis without a reconciliation to the most directly comparable GAAP measures because the Company is unable to predict with a reasonable degree of certainty certain items contained in the GAAP measures without unreasonable efforts. Such items include without limitation, acquisition related expenses, restructuring and related expenses, and other items not reflective of the Company's ongoing operations.
|
|
|
|
|
|
|
|
|
| MGP INGREDIENTS, INC. CONDENSED CONSOLIDATED STATEMENTS OF INCOME (LOSS) (UNAUDITED) (Dollars in thousands, except share and per share amounts) |
|
|
|
|
|
|
|
|
|
|
|
|
|
|
|
|
|
|
|
Quarter Ended March 31, |
|
|
|
|
|
|
|
|
2026 |
|
|
|
2025 |
|
|
| Sales |
|
$ |
106,427 |
|
|
$ |
121,653 |
|
| Cost of sales |
|
|
72,845 |
|
|
|
78,323 |
|
| Gross profit |
|
|
33,582 |
|
|
|
43,330 |
|
|
|
|
|
|
|
|
|
|
| Advertising and promotion expenses |
|
|
6,191 |
|
|
|
8,172 |
|
| Selling, general, and administrative expenses |
|
|
21,066 |
|
|
|
21,205 |
|
| Goodwill and other long-lived assets impairment |
|
|
179,526 |
|
|
|
— |
|
| Change in fair value of contingent consideration |
|
|
— |
|
|
|
14,700 |
|
| Operating loss |
|
|
(173,201 |
) |
|
|
(747 |
) |
|
|
|
|
|
|
|
|
|
| Interest expense, net |
|
|
(1,421 |
) |
|
|
(1,854 |
) |
| Other income (expense), net |
|
|
(50 |
) |
|
|
215 |
|
| Loss before income taxes |
|
|
(174,672 |
) |
|
|
(2,386 |
) |
|
|
|
|
|
|
|
|
|
| Income tax expense (benefit) |
|
|
(39,865 |
) |
|
|
671 |
|
| Net loss |
|
|
(134,807 |
) |
|
|
(3,057 |
) |
|
|
|
|
|
|
|
|
|
| Attributable to noncontrolling interest |
|
|
3 |
|
|
|
33 |
|
| Net loss attributable to MGP Ingredients, Inc. |
|
|
(134,804 |
) |
|
|
(3,024 |
) |
|
|
|
|
|
|
|
|
|
| Attributable to participating securities |
|
|
(35 |
) |
|
|
30 |
|
| Net loss used in earnings per common share calculation |
|
$ |
(134,839 |
) |
|
$ |
(2,994 |
) |
|
|
|
|
|
|
|
|
|
| Weighted average common shares |
|
|
|
|
|
|
|
|
| Basic |
|
|
21,389,441 |
|
|
|
21,342,531 |
|
| Diluted |
|
|
21,389,441 |
|
|
|
21,342,531 |
|
|
|
|
|
|
|
|
|
|
| Earnings per common share |
|
|
|
|
|
|
|
|
| Basic |
|
$ |
(6.30 |
) |
|
$ |
(0.14 |
) |
| Diluted |
|
$ |
(6.30 |
) |
|
$ |
(0.14 |
) |
|
|
|
|
|
|
|
|
| MGP INGREDIENTS, INC. CONDENSED CONSOLIDATED BALANCE SHEETS (UNAUDITED) (Dollars in thousands) |
|
|
|
|
|
|
|
|
|
|
|
|
|
|
|
|
March 31, 2026 |
|
|
|
December 31, 2025 |
|
|
| ASSETS |
|
|
|
|
|
|
|
| Current Assets: |
|
|
|
|
|
|
|
| Cash and cash equivalents |
$ |
10,357 |
|
|
$ |
18,460 |
|
| Receivables, net |
|
86,637 |
|
|
|
116,160 |
|
| Inventory |
|
403,107 |
|
|
|
382,741 |
|
| Prepaid expenses |
|
5,814 |
|
|
|
2,139 |
|
| Refundable income taxes |
|
134 |
|
|
|
3,209 |
|
| Total current assets |
|
506,049 |
|
|
|
522,709 |
|
|
|
|
|
|
|
|
|
| Property, plant, and equipment |
|
569,739 |
|
|
|
594,898 |
|
| Less accumulated depreciation and amortization |
|
(272,199 |
) |
|
|
(266,911 |
) |
| Property, plant, and equipment, net |
|
297,540 |
|
|
|
327,987 |
|
| Operating lease right-of-use assets, net |
|
11,885 |
|
|
|
13,847 |
|
| Investment in joint venture |
|
6,692 |
|
|
|
8,211 |
|
| Intangible assets, net |
|
206,893 |
|
|
|
244,696 |
|
| Goodwill |
|
— |
|
|
|
115,667 |
|
| Other assets |
|
2,240 |
|
|
|
2,747 |
|
| TOTAL ASSETS |
$ |
1,031,299 |
|
|
$ |
1,235,864 |
|
|
|
|
|
|
|
|
|
| LIABILITIES AND STOCKHOLDERS’ EQUITY |
|
|
|
|
|
|
|
| Current Liabilities: |
|
|
|
|
|
|
|
| Current maturities of long-term debt |
$ |
6,400 |
|
|
$ |
6,400 |
|
| Accounts payable |
|
49,750 |
|
|
|
54,589 |
|
| Contingent consideration |
|
110,800 |
|
|
|
110,800 |
|
| Federal and state excise taxes payable |
|
3,654 |
|
|
|
5,755 |
|
| Accrued expenses and other |
|
14,387 |
|
|
|
22,507 |
|
| Total current liabilities |
|
184,991 |
|
|
|
200,051 |
|
|
|
|
|
|
|
|
|
| Long-term debt, less current maturities |
|
42,295 |
|
|
|
49,735 |
|
| Convertible senior notes |
|
196,263 |
|
|
|
196,183 |
|
| Long-term operating lease liabilities |
|
9,007 |
|
|
|
10,561 |
|
| Other noncurrent liabilities |
|
2,246 |
|
|
|
2,534 |
|
| Deferred income taxes |
|
16,856 |
|
|
|
60,010 |
|
| Total liabilities |
|
451,658 |
|
|
|
519,074 |
|
| Total equity |
|
579,641 |
|
|
|
716,790 |
|
| TOTAL LIABILITIES AND TOTAL EQUITY |
$ |
1,031,299 |
|
|
$ |
1,235,864 |
|
|
|
|
|
|
|
|
|
|
| MGP INGREDIENTS, INC. CONDENSED CONSOLIDATED STATEMENTS OF CASH FLOWS (UNAUDITED) (Dollars in thousands) |
|
|
|
|
|
|
|
|
|
|
|
|
|
|
|
|
|
|
|
Quarter to Date Ended March 31, |
|
|
|
|
|
|
|
|
2026 |
|
|
|
2025 |
|
|
| Cash Flows from Operating Activities |
|
|
|
|
|
|
|
|
| Net loss |
|
$ |
(134,807 |
) |
|
$ |
(3,057 |
) |
| Adjustments to reconcile net loss to net cash provided by operating activities: |
|
|
|
|
|
|
|
|
| Depreciation and amortization |
|
|
6,265 |
|
|
|
5,808 |
|
| Goodwill and other long-lived assets impairment |
|
|
179,526 |
|
|
|
— |
|
| Share-based compensation |
|
|
673 |
|
|
|
742 |
|
| Equity method investment loss (gain) |
|
|
19 |
|
|
|
(257 |
) |
| Deferred income taxes, including change in valuation allowance |
|
|
(43,154 |
) |
|
|
64 |
|
| Change in fair value of contingent consideration |
|
|
— |
|
|
|
14,700 |
|
| Other, net |
|
|
290 |
|
|
|
73 |
|
| Changes in operating assets and liabilities: |
|
|
|
|
|
|
|
|
| Receivables, net |
|
|
29,441 |
|
|
|
40,594 |
|
| Inventory |
|
|
(20,299 |
) |
|
|
(13,439 |
) |
| Prepaid expenses |
|
|
(3,668 |
) |
|
|
(1,025 |
) |
| Income taxes payable (refundable) |
|
|
3,075 |
|
|
|
(2,094 |
) |
| Accounts payable |
|
|
(1,285 |
) |
|
|
(146 |
) |
| Accrued expenses and other |
|
|
(6,792 |
) |
|
|
2,857 |
|
| Federal and state excise taxes payable |
|
|
(2,102 |
) |
|
|
(98 |
) |
| Other, net |
|
|
(227 |
) |
|
|
(38 |
) |
| Net cash provided by operating activities |
|
|
6,955 |
|
|
|
44,684 |
|
|
|
|
|
|
|
|
|
|
| Cash Flows from Investing Activities |
|
|
|
|
|
|
|
|
| Additions to property, plant, and equipment |
|
|
(5,722 |
) |
|
|
(19,926 |
) |
| Distributions from equity method investment |
|
|
1,500 |
|
|
|
— |
|
| Other, net |
|
|
449 |
|
|
|
— |
|
| Net cash used in investing activities |
|
|
(3,773 |
) |
|
|
(19,926 |
) |
|
|
|
|
|
|
|
|
|
| Cash Flows from Financing Activities |
|
|
|
|
|
|
|
|
| Payment of dividends and dividend equivalents |
|
|
(2,598 |
) |
|
|
(2,578 |
) |
| Repurchase of Common Stock |
|
|
(886 |
) |
|
|
(1,035 |
) |
| Proceeds from long-term debt |
|
|
10,000 |
|
|
|
— |
|
| Principal payments on long-term debt |
|
|
(17,600 |
) |
|
|
(26,600 |
) |
| Net cash used in financing activities |
|
|
(11,084 |
) |
|
|
(30,213 |
) |
|
|
|
|
|
|
|
|
|
| Effect of exchange rate changes on cash and cash equivalents |
|
|
(201 |
) |
|
|
294 |
|
| Decrease in cash and cash equivalents |
|
|
(8,103 |
) |
|
|
(5,161 |
) |
| Cash and cash equivalents, beginning of period |
|
|
18,460 |
|
|
|
25,273 |
|
| Cash and cash equivalents, end of period |
|
$ |
10,357 |
|
|
$ |
20,112 |
|
|
|
|
|
|
|
|
|
|
|
|
|
|
|
|
|
|
|
|
|
|
|
|
|
| MGP INGREDIENTS, INC. RECONCILIATION OF SELECTED GAAP MEASURES TO ADJUSTED NON-GAAP MEASURES (UNAUDITED) (in thousands, except per share amounts) |
|
|
|
|
|
|
|
|
|
|
|
|
|
|
|
|
|
|
|
|
|
|
|
|
|
|
|
|
|
|
|
|
|
|
|
|
|
|
|
|
|
|
|
|
|
|
|
|
Quarter Ended March 31, 2026 |
|
|
|
|
|
|
|
|
|
|
|
|
|
|
|
|
|
|
|
|
|
|
|
SG&A |
|
|
|
Operating Income (loss) |
|
|
|
Income (loss) before Income Taxes |
|
|
|
Net Income (loss) |
|
|
|
MGP Earnings(a) |
|
|
|
Basic and Diluted EPS |
|
|
| Reported GAAP Results |
$ |
21,066 |
|
|
$ |
(173,201 |
) |
|
$ |
(174,672 |
) |
|
$ |
(134,807 |
) |
|
$ |
(134,839 |
) |
|
$ |
(6.30 |
) |
| Adjusted to remove: |
|
|
|
|
|
|
|
|
|
|
|
|
|
|
|
|
|
|
|
|
|
|
|
| Goodwill and other long-lived asset impairment(b) |
|
— |
|
|
|
179,526 |
|
|
|
179,526 |
|
|
|
137,329 |
|
|
|
137,320 |
|
|
|
6.41 |
|
| Executive transition costs (c) |
|
(333 |
) |
|
|
333 |
|
|
|
333 |
|
|
|
173 |
|
|
|
173 |
|
|
|
0.01 |
|
| Restructuring and other costs (d) |
|
(1,197 |
) |
|
|
1,197 |
|
|
|
1,197 |
|
|
|
621 |
|
|
|
621 |
|
|
|
0.03 |
|
| Adjusted Non-GAAP results |
$ |
19,536 |
|
|
$ |
7,855 |
|
|
$ |
6,384 |
|
|
$ |
3,316 |
|
|
$ |
3,275 |
|
|
$ |
0.15 |
|
|
|
|
|
|
|
|
|
|
|
|
|
|
|
|
|
|
|
|
|
|
|
|
|
|
Quarter Ended March 31, 2025 |
|
|
|
|
|
|
|
|
|
|
|
|
|
|
|
|
|
|
|
|
|
|
|
SG&A |
|
|
|
Operating Income (loss) |
|
|
|
Income (loss) before Income Taxes |
|
|
|
Net Income (loss) |
|
|
|
MGPEarnings(a) |
|
|
|
Basic and Diluted EPS |
|
|
| Reported GAAP Results |
$ |
21,205 |
|
|
$ |
(747 |
) |
|
$ |
(2,386 |
) |
|
$ |
(3,057 |
) |
|
$ |
(2,994 |
) |
|
$ |
(0.14 |
) |
| Adjusted to remove: |
|
|
|
|
|
|
|
|
|
|
|
|
|
|
|
|
|
|
|
|
|
|
|
| Executive transition costs (c) |
|
(306 |
) |
|
|
306 |
|
|
|
306 |
|
|
|
207 |
|
|
|
205 |
|
|
|
0.01 |
|
| Restructuring and other costs (d) |
|
(613 |
) |
|
|
613 |
|
|
|
613 |
|
|
|
414 |
|
|
|
410 |
|
|
|
0.02 |
|
| Fair value of contingent consideration(e) |
|
— |
|
|
|
14,700 |
|
|
|
14,700 |
|
|
|
9,937 |
|
|
|
9,839 |
|
|
|
0.46 |
|
| Professional service fees (f) |
|
(382 |
) |
|
|
382 |
|
|
|
382 |
|
|
|
258 |
|
|
|
256 |
|
|
|
0.01 |
|
| Adjusted Non-GAAP results |
$ |
19,904 |
|
|
$ |
15,254 |
|
|
$ |
13,615 |
|
|
$ |
7,759 |
|
|
$ |
7,716 |
|
|
$ |
0.36 |
|
|
|
|
| (a) |
|
MGP Earnings is defined as "Net income used in Earnings Per Common Share calculation," which accounts for the impacts of the earnings attributable to noncontrolling interest and earnings attributable to participating securities. |
| (b) |
|
Goodwill and other long-lived asset impairment relates to the write down of goodwill, indefinite-lived intangible assets and other long-lived fixed assets during the quarter ended March 31, 2026. It is included in the Consolidated Statement of Income (Loss) as a component of operating income and relates to the Branded Spirits segment. |
| (c) |
|
The executive transition costs are included in the Condensed Consolidated Statement of Income (Loss) within the selling, general, and administrative line item. The adjustment includes costs related to the transition of certain executive and board of director positions. |
| (d) |
|
The restructuring and other costs are included in the Condensed Consolidated Statement of Income (Loss) within the selling, general, and administrative line item. The adjustment includes special one-time severance costs related to the reduction in force that occurred during the period. |
| (e) |
|
Fair value of contingent consideration relates to the quarterly adjustment of the contingent consideration liability related to the acquisition of Penelope Bourbon LLC. It is included in the Condensed Consolidated Statement of Income (Loss) as a component of operating income and relates to the Branded Spirits segment. |
| (f) |
|
The professional services fees are included in the Condensed Consolidated Statement of Income (Loss) within the selling, general, and administrative line item. The adjustment includes costs related to professional services in conjunction with the goodwill impairment valuation. |
|
|
|
|
|
|
|
|
| MGP INGREDIENTS, INC. RECONCILIATION OF NET INCOME (LOSS) TO ADJUSTED EBITDA (UNAUDITED) (in thousands) |
|
|
|
|
|
|
|
|
|
|
|
|
|
|
|
|
Quarter Ended March 31, |
|
|
|
|
|
|
|
2026 |
|
|
|
2025 |
|
|
| Net loss |
$ |
(134,807 |
) |
|
$ |
(3,057 |
) |
| Interest expense |
|
1,421 |
|
|
|
1,854 |
|
| Income tax expense (benefit) |
|
(39,865 |
) |
|
|
671 |
|
| Depreciation and amortization |
|
6,265 |
|
|
|
5,808 |
|
| Share based compensation (a) |
|
923 |
|
|
|
742 |
|
| Equity method investment loss (gain) |
|
19 |
|
|
|
(257 |
) |
| Executive transition costs |
|
333 |
|
|
|
306 |
|
| Restructuring and other costs |
|
1,197 |
|
|
|
613 |
|
| Goodwill and other long-lived assets impairment |
|
179,526 |
|
|
|
— |
|
| Fair value of contingent consideration |
|
— |
|
|
|
14,700 |
|
| Professional service fees |
|
— |
|
|
|
382 |
|
| Adjusted EBITDA |
$ |
15,012 |
|
|
$ |
21,762 |
|
|
|
|
| (a) |
|
This amount excludes share based compensation related to executive transition costs and one-time severance costs (benefits). |
The non-GAAP adjusted EBITDA measure is defined as earnings before interest expense, income tax expense (benefit), depreciation and amortization, share based compensation, equity method investment loss (gain), executive transition costs, restructuring and other costs, goodwill and other long-lived assets impairment, fair value of contingent consideration, and professional service fees.
See "Reconciliation of selected GAAP measure to adjusted non-GAAP measures" for further details on selected non-GAAP items.
|
|
|
|
|
|
|
|
|
|
|
|
|
|
|
|
|
|
|
|
| MGP INGREDIENTS, INC. NET DEBT LEVERAGE RATIO (UNAUDITED) (in thousands) |
|
|
|
|
|
|
|
|
|
|
|
|
|
|
|
|
|
|
|
|
|
|
|
|
|
|
|
|
|
|
|
|
|
|
|
|
|
|
|
|
**Quarter Ended ****June 30, **2025 |
|
|
|
**Quarter Ended ****September 30, **2025 |
|
|
|
**Quarter Ended ****December 31, **2025 |
|
|
|
**Quarter Ended ****March 31, **2026 |
|
|
|
**TTM(a) **March 31, 2026 |
|
|
| Net income (loss) |
$ |
14,427 |
|
|
$ |
15,429 |
|
|
$ |
(134,631 |
) |
|
$ |
(134,807 |
) |
|
$ |
(239,582 |
) |
| Interest expense |
|
1,897 |
|
|
|
1,739 |
|
|
|
1,554 |
|
|
|
1,421 |
|
|
|
6,611 |
|
| Income tax expense (benefit) |
|
4,308 |
|
|
|
4,276 |
|
|
|
(1,773 |
) |
|
|
(39,865 |
) |
|
|
(33,054 |
) |
| Depreciation and amortization |
|
5,830 |
|
|
|
6,186 |
|
|
|
6,262 |
|
|
|
6,265 |
|
|
|
24,543 |
|
| Share based compensation(c) |
|
1,288 |
|
|
|
1,057 |
|
|
|
1,129 |
|
|
|
923 |
|
|
|
4,397 |
|
| Equity method investment gain |
|
(237 |
) |
|
|
(375 |
) |
|
|
(318 |
) |
|
|
19 |
|
|
|
(911 |
) |
| Goodwill and other long-lived assets impairment |
|
— |
|
|
|
— |
|
|
|
152,622 |
|
|
|
179,526 |
|
|
|
332,148 |
|
| Fair value of contingent consideration |
|
8,000 |
|
|
|
2,800 |
|
|
|
— |
|
|
|
— |
|
|
|
10,800 |
|
| Professional service fees |
|
— |
|
|
|
— |
|
|
|
113 |
|
|
|
— |
|
|
|
113 |
|
| Executive transition costs |
|
376 |
|
|
|
1,143 |
|
|
|
953 |
|
|
|
333 |
|
|
|
2,805 |
|
| Restructuring and other costs |
|
— |
|
|
|
— |
|
|
|
190 |
|
|
|
1,197 |
|
|
|
1,387 |
|
| Adjusted EBITDA |
$ |
35,889 |
|
|
$ |
32,255 |
|
|
$ |
26,101 |
|
|
$ |
15,012 |
|
|
$ |
109,257 |
|
|
|
|
|
|
|
|
|
|
|
|
|
|
|
|
|
|
|
|
|
| Total debt |
|
|
|
|
|
|
|
|
|
|
|
|
|
|
|
|
$ |
244,958 |
|
| Cash and cash equivalents |
|
|
|
|
|
|
|
|
|
|
|
|
|
|
|
|
|
10,357 |
|
| Net debt |
|
|
|
|
|
|
|
|
|
|
|
|
|
|
|
|
$ |
234,601 |
|
|
|
|
|
|
|
|
|
|
|
|
|
|
|
|
|
|
|
|
|
| Net debt leverage ratio(b) |
|
|
|
|
|
|
|
|
|
|
|
|
|
|
|
|
|
2.1 |
|
|
|
|
| (a) |
|
TTM is defined as trailing twelve months. |
| (b) |
|
Net debt leverage ratio is defined as net debt divided by adjusted EBITDA. |
| (c) |
|
This amount excludes share based compensation related to executive transition costs. |
See "Reconciliation of selected GAAP measure to adjusted non-GAAP measures" for further details on selected non-GAAP items.
|
|
|
|
|
|
|
|
|
|
|
|
|
|
|
|
| MGP INGREDIENTS, INC. OPERATING SEGMENT RESULTS (UNAUDITED) |
|
|
|
|
|
|
|
|
|
|
|
|
|
|
|
|
|
|
|
|
|
|
|
|
|
|
|
|
|
|
|
| (Dollars in thousands) |
BRANDED SPIRITS |
|
|
|
|
|
|
|
|
|
|
|
|
|
|
|
Quarter Ended March 31, |
|
|
|
|
|
|
|
Quarter versus Quarter Change Increase/(Decrease) |
|
|
|
|
|
|
|
2026 |
|
|
|
2025 |
|
|
|
$ Change |
|
|
|
% Change |
|
|
| Premium plus |
$ |
22,651 |
|
|
$ |
22,318 |
|
|
$ |
333 |
|
|
1 |
% |
|
| Mid |
|
13,243 |
|
|
|
13,027 |
|
|
|
216 |
|
|
2 |
|
|
| Value |
|
6,503 |
|
|
|
7,341 |
|
|
|
(838 |
) |
|
(11 |
) |
|
| Other |
|
1,840 |
|
|
|
5,541 |
|
|
|
(3,701 |
) |
|
(67 |
) |
|
| Total Branded Spirits Sales |
$ |
44,237 |
|
|
$ |
48,227 |
|
|
$ |
(3,990 |
) |
|
(8 |
)% |
|
|
|
|
|
|
|
|
|
|
|
|
|
|
|
|
|
| Gross profit |
$ |
21,136 |
|
|
$ |
22,198 |
|
|
$ |
(1,062 |
) |
|
(5 |
)% |
|
| Gross margin % |
|
47.8 |
% |
|
|
46.0 |
% |
|
|
|
|
|
1.8 |
|
pp(a) |
|
|
|
|
|
|
|
|
|
|
|
|
|
|
|
|
| Operating income |
$ |
(172,372 |
) |
|
$ |
(9,146 |
) |
|
$ |
(163,226 |
) |
|
(1,785 |
)% |
|
| Depreciation and amortization |
$ |
2,159 |
|
|
$ |
2,140 |
|
|
$ |
19 |
|
|
1 |
% |
|
|
|
|
|
|
|
|
|
|
|
|
|
|
|
|
|
|
DISTILLING SOLUTIONS |
|
|
|
|
|
|
|
|
|
|
|
|
|
|
|
Quarter Ended March 31, |
|
|
|
|
|
|
|
Quarter versus Quarter Change Increase/(Decrease) |
|
|
|
|
|
|
|
2026 |
|
|
|
2025 |
|
|
|
$ Change |
|
|
|
% Change |
|
|
| Brown goods |
$ |
14,909 |
|
|
$ |
33,656 |
|
|
$ |
(18,747 |
) |
|
(56 |
)% |
|
| Warehouse services |
|
8,292 |
|
|
|
8,077 |
|
|
|
215 |
|
|
3 |
|
|
| White goods and other co-products |
|
4,799 |
|
|
|
5,210 |
|
|
|
(411 |
) |
|
(8 |
) |
|
| Total Distilling Solutions Sales |
$ |
28,000 |
|
|
$ |
46,943 |
|
|
$ |
(18,943 |
) |
|
(40 |
)% |
|
|
|
|
|
|
|
|
|
|
|
|
|
|
|
|
|
| Gross profit |
$ |
8,625 |
|
|
$ |
18,680 |
|
|
$ |
(10,055 |
) |
|
(54 |
)% |
|
| Gross margin % |
|
30.8 |
% |
|
|
39.8 |
% |
|
|
|
|
|
(9.0 |
) |
pp(a) |
|
|
|
|
|
|
|
|
|
|
|
|
|
|
|
|
| Operating income |
$ |
7,835 |
|
|
$ |
17,882 |
|
|
$ |
(10,047 |
) |
|
(56 |
)% |
|
| Depreciation and amortization |
$ |
1,798 |
|
|
$ |
2,055 |
|
|
$ |
(257 |
) |
|
(13 |
)% |
|
|
|
|
|
|
|
|
|
|
|
|
|
|
|
|
|
|
INGREDIENT SOLUTIONS SALES |
|
|
|
|
|
|
|
|
|
|
|
|
|
|
|
Quarter Ended March 31, |
|
|
|
|
|
|
|
Quarter versus Quarter Change Increase / (Decrease) |
|
|
|
|
|
|
|
2026 |
|
|
|
2025 |
|
|
|
$ Change |
|
|
|
% Change |
|
|
| Specialty wheat starches |
$ |
18,416 |
|
|
$ |
15,853 |
|
|
$ |
2,563 |
|
|
16 |
% |
|
| Specialty wheat proteins |
|
12,708 |
|
|
|
7,348 |
|
|
|
5,360 |
|
|
73 |
|
|
| Commodity wheat starches |
|
2,617 |
|
|
|
2,719 |
|
|
|
(102 |
) |
|
(4 |
) |
|
| Commodity wheat proteins |
|
383 |
|
|
|
563 |
|
|
|
(180 |
) |
|
(32 |
) |
|
| Biofuel and other |
|
66 |
|
|
|
— |
|
|
|
66 |
|
|
n/a |
|
|
| Total Ingredient Solutions |
$ |
34,190 |
|
|
$ |
26,483 |
|
|
$ |
7,707 |
|
|
29 |
% |
|
|
|
|
|
|
|
|
|
|
|
|
|
|
|
|
|
| Gross profit |
$ |
3,821 |
|
|
$ |
2,452 |
|
|
$ |
1,369 |
|
|
56 |
% |
|
| Gross margin % |
|
11.2 |
% |
|
|
9.3 |
% |
|
|
|
|
|
1.9 |
|
pp(a) |
|
|
|
|
|
|
|
|
|
|
|
|
|
|
|
|
| Operating income |
$ |
2,941 |
|
|
$ |
1,008 |
|
|
$ |
1,933 |
|
|
192 |
% |
|
| Depreciation and amortization |
$ |
1,958 |
|
|
$ |
1,271 |
|
|
$ |
687 |
|
|
54 |
% |
|
|
|
|
| (a) |
|
Percentage points (“pp”). |
|
|
|
|
|
|
|
|
| MGP INGREDIENTS, INC. DILUTIVE SHARES OUTSTANDING CALCULATION (UNAUDITED) |
|
|
|
|
|
|
|
|
|
|
|
|
|
|
|
|
Quarter Ended March 31, |
|
|
|
|
|
|
|
2026 |
|
|
|
2025 |
|
|
| Principal amount of the bonds |
$ |
201,250,000 |
|
|
$ |
201,250,000 |
|
| Par value |
$ |
1,000 |
|
|
$ |
1,000 |
|
| Number of bonds outstanding (a) |
|
201,250 |
|
|
|
201,250 |
|
|
|
|
|
|
|
|
|
| Initial conversion rate |
|
10.3911 |
|
|
|
10.3911 |
|
| Conversion price |
$ |
96.23620 |
|
|
$ |
96.23620 |
|
|
|
|
|
|
|
|
|
| Average share price (b) |
$ |
22.32656 |
|
|
$ |
33.45192 |
|
| Impact of conversion (c) |
$ |
— |
|
|
$ |
— |
|
|
|
|
|
|
|
|
|
| Cash paid for principal |
|
(201,250,000 |
) |
|
|
(201,250,000 |
) |
| Conversion premium |
$ |
— |
|
|
$ |
— |
|
|
|
|
|
|
|
|
|
| Average share price |
$ |
22.32656 |
|
|
$ |
33.45192 |
|
| Conversion premium in shares (d) (e) |
|
— |
|
|
|
— |
|
|
|
|
| (a) |
|
Number of bonds outstanding is calculated by taking the principal amount of the bonds divided by the par value. |
| (b) |
|
Average share price is calculated by taking the average of the daily closing share price for the period. If the average share price is less than the conversion price of $96.23620 per share, the impact to EPS is anti-dilutive and therefore the shares were excluded from the diluted EPS calculation. |
| (c) |
|
Impact of conversion is calculated by taking the number of bonds outstanding multiplied by the initial conversion rate multiplied by the average share price. If the average share price is less than the conversion price then the impact of conversion is zero. |
| (d) |
|
The impacts of the Convertible Senior Notes are included in the diluted weighted average common shares outstanding if the impact is dilutive. The Convertible Senior Notes would only have a dilutive impact if the average market price per share during the quarter exceed the conversion price of $96.23620 per share. |
| (e) |
|
Conversion premium in shares is calculated by taking the conversion premium divided by the average share price. If the average share price is less than the conversion price, then the conversion premium in shares is zero. |
View source version on businesswire.com: https://www.businesswire.com/news/home/20260429936677/en/
For Investor Relations:
[email protected]
For Media Inquiries:
The Brand Guild
[email protected]
Source: MGP Ingredients, Inc.
Released April 29, 2026
© 2026 MGP Ingredients, Inc.
All Rights Reserved.
Privacy Policy
Disclaimer
Sitemap