November 5, 2026
Q3'26 revenue grew 12% YoY to $258 million, at the high end of our guidance range
Q3'26 GAAP net income from continuing operations of $52.8 million, up 2% YoY; non-GAAP Adjusted EBITDA from continuing operations of $89.7 million, near the high end of our guidance range
Q3'26 GAAP net cash, cash equivalents, and restricted cash provided by operating activities of $80.8 million; non-GAAP free cash flow of $73.9 million
CarGurus’ Board of Directors authorized $250.0 million share repurchase program
BOSTON, Nov. 05, 2026 (GLOBE NEWSWIRE) -- CarGurus, Inc. (Nasdaq: CARG), the No. 1 visited automotive shopping site in the U.S.1, today announced financial results for the third quarter ended September 30, 2026.
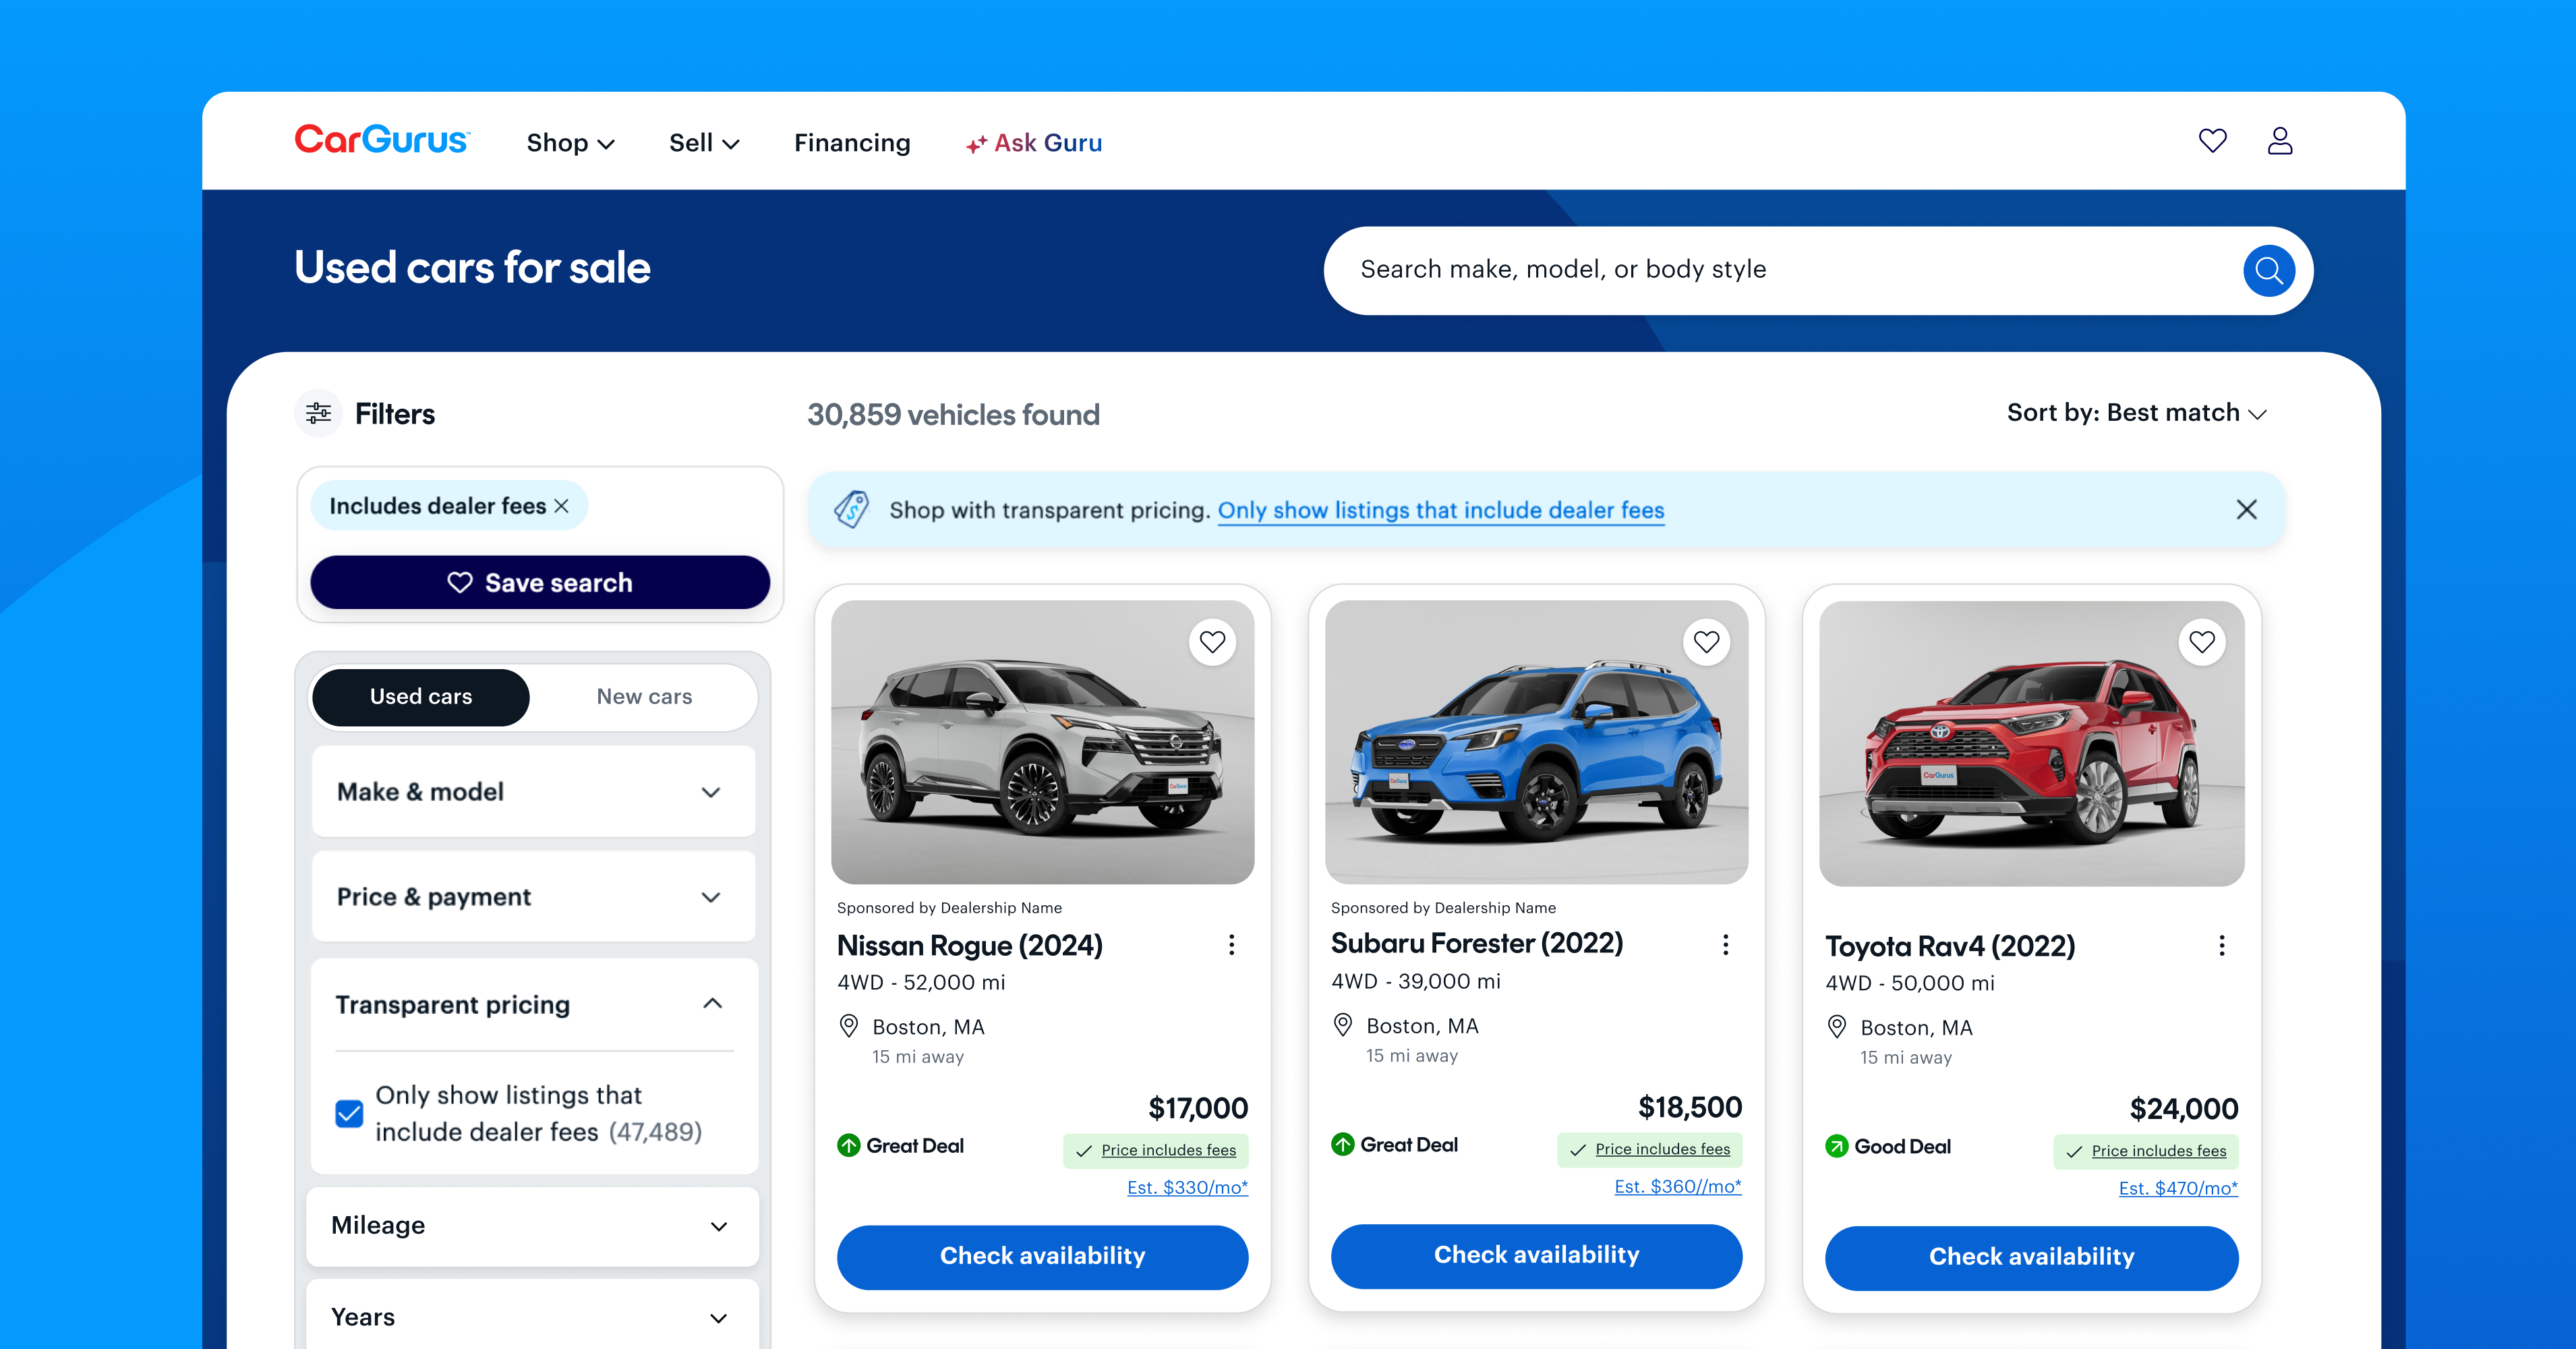
“We delivered strong third-quarter results, with revenue up 12% year-over-year at the high end of guidance and Adjusted EBITDA near the high end,” said Jason Trevisan, Chief Executive Officer of CarGurus. “We are bringing products to market faster and building from our marketplace foundation into a broader set of AI enabled solutions across the dealer workflow including building out our inventory pillar with the launch of StockVantage. For consumers, we are meeting shoppers in the AI tools they already use as we work toward becoming the expert guide for car shopping in an AI-led world. We believe disciplined execution and robust free cash flow position us to create long-term value for stockholders.”
Third Quarter Financial Highlights
Below are our financial highlights from continuing operations(1) for the three and nine months ended September 30, 2026.
| | | Three Months Ended | | | Nine Months Ended | |
| | | September 30, 2026 | | | September 30, 2026 | |
| | | Results (in millions) | | | Variance from Prior Year | | | Results (in millions) | | | Variance from Prior Year | |
| Revenue | | $ | 258.4 | | | | 12 | % | | $ | 752.9 | | | | 13 | % |
| | | | | | | | | | | | | |
| Gross Profit**(2)** | | $ | 237.1 | | | | 10 | % | | $ | 692.8 | | | | 12 | % |
| % Margin | | | 92 | % | | (92) bps | | | | 92 | % | | (93) bps | |
| | | | | | | | | | | | | |
| Operating Expenses**(2)** | | $ | 169.1 | | | | 12 | % | | $ | 521.8 | | | | 18 | % |
| | | | | | | | | | | | | |
| GAAP Net Income from continuing operations**(2)** | | $ | 52.8 | | | | 2 | % | | $ | 134.2 | | | | (6 | )% |
| % Margin | | | 20 | % | | (199) bps | | | | 18 | % | | (365) bps | |
| | | | | | | | | | | | | |
| Non-GAAP Adjusted EBITDA from continuing operations**(3)** | | $ | 89.7 | | | | 9 | % | | $ | 254.6 | | | | 10 | % |
| % Margin(3) | | | 35 | % | | (89) bps | | | | 34 | % | | (80) bps | |
| | | | | | | | | | | | | |
| Cash and Cash Equivalents at period end**(4)** | | $ | 164.9 | | | | (13 | )% | | $ | 164.9 | | | | (13 | )% |
| (1) | In August 2025 the Board of Directors of CarGurus approved the wind-down of CarOffer, LLC (“CarOffer”), which was completed as of December 31, 2025. We have presented the financial results of CarOffer as discontinued operations in the Unaudited Condensed Consolidated Financial Statements. No assets or liabilities were classified as discontinued operations as of September 30, 2026 or December 31, 2025. No results of operations were classified as discontinued operations for the three and nine months ended September 30, 2026. The Unaudited Condensed Consolidated Income Statement for the three and nine months ended September 30, 2025, was derived from the Unaudited Condensed Consolidated Income Statement of CarGurus, Inc. as of that date, adjusted for the reclassification of discontinued operations. The Unaudited Condensed Consolidated Statement of Cash Flows as of September 30, 2025, related to discontinued operations has not been separately reclassified and are included within the period referenced. |
| (2) | During the three months ended September 30, 2026 and 2025, there was no impairment in operating expenses. During the nine months ended September 30, 2026, we recognized $20.2 million of impairments, inclusive of $0.5 million in cost of revenue and $19.7 million in operating expenses. During the nine months ended September 30, 2025, we recognized $0.5 million of impairment in operating expenses. |
| (3) | For more information regarding our use of non-GAAP Adjusted EBITDA from continuing operations and other non-GAAP financial measures, please see the reconciliations of GAAP financial measures to non-GAAP financial measures and the section titled “Non-GAAP Financial Measures and Other Business Metrics” below. |
| (4) | Variance represents the change from December 31, 2025. |
| | |
| | | Three Months Ended | |
| | | September 30, 2026 | |
| | | Results | | | Variance from Prior Year | |
| Key Performance Indicators**(1)** | | | | | | |
| U.S. Paying Dealers | | | 26,402 | | | | 3 | % |
| International Paying Dealers | | | 8,299 | | | | 5 | % |
| Total Paying Dealers | | | 34,701 | | | | 3 | % |
| | | | | | | |
| U.S. QARSD | | $ | 8,308 | | | | 7 | % |
| International QARSD | | $ | 2,715 | | | | 14 | % |
| Consolidated QARSD | | $ | 6,955 | | | | 7 | % |
| (1) For more information regarding our use of Key Performance Indicators, please see the section titled “Non-GAAP Financial Measures and Other Business Metrics” below. |
| |
Fourth Quarter and Full-Year 2026 Guidance
The table below provides CarGurus’ guidance, which is based on recent market trends, industry conditions, and management’s expectations and assumptions as of today.
| Fourth Quarter 2026 Guidance Metrics (in millions) | Low | | | High | |
| Total revenue | $ | 258.5 | | | $ | 263.5 | |
| Non-GAAP Adjusted EBITDA from continuing operations | $ | 93.0 | | | $ | 101.0 | |
| Non-GAAP Earnings per Share from continuing operations | $ | 0.73 | | | $ | 0.79 | |
| Full-Year 2026 Guidance Metrics (in millions, except percentages) | Low | | | High | |
| Total revenue | $ | 1,011.5 | | | $ | 1,016.5 | |
| Revenue change YoY | | 11.5 | % | | | 12.1 | % |
| Non-GAAP Adjusted EBITDA from continuing operations | $ | 347.5 | | | $ | 355.5 | |
| Non-GAAP Adjusted EBITDA from continuing operations margin change YoY | | (0.8 | )% | | | (0.2 | )% |
| Non-GAAP Earnings per Share from continuing operations | $ | 2.66 | | | $ | 2.72 | |
| | | | | | | | |
Guidance for the fourth quarter and full-year 2026 non-GAAP earnings per share from continuing operations calculations assumes 90.0 million and 92.0 million, respectively, diluted weighted-average common shares outstanding.
The assumptions that are built into guidance for the fourth quarter and full-year 2026 regarding our pace of paid dealer acquisition, churn, and expansion activity for the relevant period are based on recent market trends and industry conditions. Guidance for the fourth quarter and full-year 2026 excludes macro-level industry issues that result in dealers and consumers materially changing their recent market trends or that cause us to enact measures to assist dealers. Guidance also excludes any potential impact of future foreign currency exchange gains or losses. CarGurus may incur charges, realize gains or losses, or experience other events or circumstances in 2026 that could cause any of these assumptions to change and/or actual results to vary from this guidance.
CarGurus has not reconciled its guidance of non-GAAP Adjusted EBITDA from continuing operations to GAAP net income from continuing operations, Non-GAAP adjusted EBITDA margin from continuing operations to GAAP net income margin from continuing operations, or non-GAAP earnings per share from continuing operations to GAAP earnings per share from continuing operations because we are unable to accurately predict without unreasonable effort the exact amount or timing of certain reconciling items between such GAAP and non-GAAP financial measures, including, as applicable, depreciation expenses, amortization of intangible assets, non-intangible amortization, stock-based compensation, impairments, other income, net, and income tax effects. The variability of these reconciling items could have a significant impact on our future GAAP reported results.
Conference Call and Webcast Information
CarGurus will host a conference call and live webcast to discuss its third quarter 2026 financial results and business outlook at 5:00 p.m. Eastern Time today, November 5, 2026. To access the conference call, dial (877) 451-6152 for callers in the U.S. or Canada, or (201) 389-0879 for international callers. The webcast will be available live on the Investors section of CarGurus’ website at investors.cargurus.com.
An audio replay of the call will also be available to investors beginning at approximately 8:00 p.m. Eastern Time today, November 5, 2026, until 11:59 p.m. Eastern Time on November 19, 2026, by dialing (844) 512-2921 for callers in the U.S. or Canada, or (412) 317-6671 for international callers, and entering passcode 13759728. In addition, an archived webcast will be available on the Investors section of CarGurus’ website at investors.cargurus.com.
About CarGurus
CarGurus (Nasdaq: CARG) is the leading multinational automotive platform helping consumers and dealers confidently buy and sell vehicles. Founded in 2006 with a mission to bring more trust and transparency to car shopping, CarGurus is the No. 1 visited automotive shopping site in the U.S.1 with the largest selection of inventory and network of dealers.2 CarGurus’ unmatched selection, trusted automotive insights, and data-driven products and solutions support each shopper’s journey — from online research and shopping to in-dealership decisions — to empower them at every step. And, by translating data from billions of monthly site interactions, CarGurus provides dealers a personalized, predictive intelligence platform with software solutions that helps them run their businesses more efficiently and profitably at all stages of inventory acquisition and pricing, marketing, and conversion to sale.
CarGurus operates online marketplaces in the U.S., U.K., and Canada. The company’s network of brands includes PistonHeads, the largest online motoring community in the U.K.3, and Autolist, a U.S.- based online marketplace.
To learn more about CarGurus, visit www.cargurus.com.
1 Similarweb: Traffic and Engagement Report (Cars.com, Autotrader.com, TrueCar.com, CARFAX.com Listings (defined as CARFAX.com Total Visits minus Vehicle History Reports)), Q3 2026, U.S. 2Compared to Autotrader.com, Cars.com, TrueCar.com, and CARFAX (Joreca as of September 30, 2026) 3Similarweb: Traffic and Engagement Report, Q3 2026, U.K.
CarGurus® and Autolist® are each a registered trademark of CarGurus, Inc., and PistonHeads® is a registered trademark of CarGurus Ireland Limited in the U.K. and the European Union. All other product names, trademarks, and registered trademarks are property of their respective owners.
© 2026 CarGurus, Inc., All Rights Reserved.
Cautionary Language Concerning Forward-Looking Statements
This press release includes forward-looking statements. Other than statements of historical facts, all statements contained in this press release, including statements regarding our future financial and operating results; our fourth quarter and full-year 2026 financial and business performance, including guidance; our plans to focus on technology and analytics that will enable smarter sourcing and pricing decisions; our business and growth strategy and our plans to execute on our growth strategy; our ability to grow our business profitably and efficiently; our capital allocation and investment strategy; our plans relating to share repurchases; the attractiveness and value proposition of our current offerings and other product opportunities; the potential of, and expectations for, our current offerings and other product opportunities; our ability to maintain existing and acquire new customers; addressable opportunities; our expectation that we will continue to invest in growth initiatives; our ability to quickly make transformations necessary for our business to achieve long-term goals; and our ability to overcome challenges facing the automotive industry ecosystem, including inventory supply problems, global supply chain challenges, including disruptions to pre-existing supply chains and vendor relations, changes to trade policies or tariff regulations, financial market volatility and disruption, increased interest rates, inflationary concerns, the impact of new or modified laws and regulations that currently apply or become applicable to our business, and other macroeconomic issues, including uncertain or volatile economic conditions in the U.S. and abroad, are forward-looking statements. The words “aim,” “anticipate,” “believe,” “could,” “estimate,” “expect,” “goal,” “guide,” “guidance,” “intend,” “may,” “might,” “plan,” “potential,” “predicts,” “projects,” “seeks,” “should,” “target,” “will,” “would,” and similar expressions and their negatives are intended to identify forward-looking statements. We have based these forward-looking statements on our current expectations and projections about future events and financial trends that we reasonably believe may affect our business, financial condition, results of operations, business strategy, short-term and long-term business operations and objectives, financial needs, and growth prospects. You should not rely upon forward-looking statements as predictions of future events.
These forward-looking statements are subject to a number of risks and uncertainties that could cause actual results to differ materially from those reflected in such statements, including risks related to our growth and our ability to grow our revenue; our relationships with dealers; competition in the markets in which we operate; market growth; our ability to innovate; increased inflation and interest rates, global supply chain challenges, changes in international trade policies, including tariffs, volatile economic conditions, and other macroeconomic issues; the impact of changes in tax law and related guidance and regulations that may be implemented, including on tax rates, our business, and our financial results; the impact of new or improved technologies, including artificial intelligence, on our business, operations, and strategy; changes in our key personnel; natural disasters, epidemics, or pandemics; and our ability to operate in compliance with applicable laws as well as other risks and uncertainties as may be detailed from time to time in our Annual Reports on Form 10-K and Quarterly Reports on Form 10-Q and other reports we file with the U.S. Securities and Exchange Commission. We operate in a very competitive and rapidly changing environments. New risks and uncertainties emerge from time to time. It is not possible for us to predict all risks and uncertainties that could have an impact on any forward-looking statements we may make. We are under no duty to update any of these forward-looking statements after the date of this press release to conform these statements to actual results or revised expectations, except as required by law. You should, therefore, not rely on these forward-looking statements as representing our views as of any date subsequent to the date of this press release.
Investor Contact: Kirndeep Singh Vice President, Head of Investor Relations [email protected]
Media Contact: Maggie Meluzio Director, Public Relations and External Communications [email protected]
Unaudited Condensed Consolidated Balance Sheets (in thousands, except share and per share data)
| | | As of September 30, 2026 | | | As of December 31, 2025 | |
| Assets | | | | | | |
| Current assets | | | | | | |
| Cash and cash equivalents | | $ | 164,910 | | | $ | 190,518 | |
| Accounts receivable, net of allowance for doubtful accounts of $803 and $600, respectively | | | 47,049 | | | | 41,936 | |
| Prepaid expenses, prepaid income taxes, and other current assets | | | 19,573 | | | | 35,259 | |
| Deferred contract costs | | | 14,845 | | | | 15,235 | |
| Total current assets | | | 246,377 | | | | 282,948 | |
| Property and equipment, net | | | 129,254 | | | | 132,952 | |
| Intangible assets, net | | | 2,500 | | | | 3,253 | |
| Goodwill | | | 27,881 | | | | 28,397 | |
| Operating lease right-of-use assets | | | 96,660 | | | | 115,481 | |
| Deferred tax assets | | | 68,199 | | | | 81,201 | |
| Deferred contract costs, net of current portion | | | 12,831 | | | | 13,563 | |
| Other non-current assets | | | 5,351 | | | | 4,102 | |
| Total assets | | $ | 589,053 | | | $ | 661,897 | |
| Liabilities and stockholders’ equity | | | | | | |
| Current liabilities | | | | | | |
| Accounts payable | | $ | 31,353 | | | $ | 29,115 | |
| Accrued expenses, accrued income taxes, and other current liabilities | | | 40,487 | | | | 38,393 | |
| Deferred revenue | | | 25,639 | | | | 23,562 | |
| Operating lease liabilities | | | 10,089 | | | | 9,469 | |
| Total current liabilities | | | 107,568 | | | | 100,539 | |
| Operating lease liabilities | | | 172,176 | | | | 181,364 | |
| Deferred tax liabilities | | | — | | | | 442 | |
| Other non–current liabilities | | | 6,073 | | | | 5,354 | |
| Total liabilities | | | 285,817 | | | | 287,699 | |
| Stockholders’ equity | | | | | | |
| Preferred stock, $0.001 par value per share; 10,000,000 shares authorized; no shares issued and outstanding | | | — | | | | — | |
| Class A common stock, $0.001 par value per share; 500,000,000 shares authorized; 75,339,849 and 80,667,475 shares issued and outstanding at September 30, 2026 and December 31, 2025, respectively | | | 75 | | | | 81 | |
| Class B common stock, $0.001 par value per share; 100,000,000 shares authorized; 13,763,613 and 14,216,250 shares issued and outstanding at September 30, 2026 and December 31, 2025, respectively | | | 14 | | | | 14 | |
| Additional paid-in capital | | | 13,720 | | | | 10,297 | |
| Retained earnings | | | 289,403 | | | | 362,380 | |
| Accumulated other comprehensive income | | | 24 | | | | 1,426 | |
| Total stockholders’ equity | | | 303,236 | | | | 374,198 | |
| Total liabilities and stockholders’ equity | | $ | 589,053 | | | $ | 661,897 | |
| | | | | | | | | |
Unaudited Condensed Consolidated Income Statements (in thousands, except share and per share data)
| | | Three Months Ended | | | Nine Months Ended | |
| | | September 30, | | | September 30, | |
| | | 2026 | | | 2025 | | | 2026 | | | 2025 | |
| Revenue | | $ | 258,366 | | | $ | 231,653 | | | $ | 752,892 | | | $ | 665,886 | |
| Cost of revenue(1)(2) | | | 21,288 | | | | 16,946 | | | | 60,095 | | | | 46,966 | |
| Gross profit | | | 237,078 | | | | 214,707 | | | | 692,797 | | | | 618,920 | |
| Operating expenses | | | | | | | | | | | | |
| Sales and marketing | | | 99,242 | | | | 87,039 | | | | 294,361 | | | | 253,295 | |
| Product, technology, and development | | | 38,493 | | | | 34,139 | | | | 114,301 | | | | 102,892 | |
| General and administrative | | | 27,522 | | | | 25,546 | | | | 82,212 | | | | 75,597 | |
| Impairments | | | — | | | | — | | | | 19,651 | | | | 499 | |
| Depreciation and amortization | | | 3,889 | | | | 3,868 | | | | 11,279 | | | | 11,319 | |
| Total operating expenses | | | 169,146 | | | | 150,592 | | | | 521,804 | | | | 443,602 | |
| Income from continuing operations | | | 67,932 | | | | 64,115 | | | | 170,993 | | | | 175,318 | |
| Other income, net | | | | | | | | | | | | |
| Interest income | | | 1,182 | | | | 2,292 | | | | 3,809 | | | | 7,524 | |
| Other expense, net | | | (499 | ) | | | (409 | ) | | | (1,553 | ) | | | (281 | ) |
| Total other income, net | | | 683 | | | | 1,883 | | | | 2,256 | | | | 7,243 | |
| Income from continuing operations before income taxes | | | 68,615 | | | | 65,998 | | | | 173,249 | | | | 182,561 | |
| Provision for income taxes | | | 15,826 | | | | 14,057 | | | | 39,039 | | | | 39,557 | |
| Net income from continuing operations | | | 52,789 | | | | 51,941 | | | | 134,210 | | | | 143,004 | |
| Net loss from discontinued operations, net of tax benefits | | | — | | | | (7,224 | ) | | | — | | | | (36,899 | ) |
| Consolidated net income | | $ | 52,789 | | | $ | 44,717 | | | $ | 134,210 | | | $ | 106,105 | |
| Net income per share attributable to common stockholders | | | | | | | | | | | | |
| Basic | | | | | | | | | | | | |
| Continuing operations | | $ | 0.59 | | | $ | 0.53 | | | $ | 1.47 | | | $ | 1.43 | |
| Consolidated | | $ | 0.59 | | | $ | 0.46 | | | $ | 1.47 | | | $ | 1.06 | |
| Diluted | | | | | | | | | | | | |
| Continuing operations | | $ | 0.59 | | | $ | 0.52 | | | $ | 1.46 | | | $ | 1.41 | |
| Consolidated | | $ | 0.59 | | | $ | 0.45 | | | $ | 1.46 | | | $ | 1.04 | |
| Weighted-average number of shares of common stock used in computing net income per share attributable to common stockholders | | | | | | | | | | | | |
| Basic | | | 89,104,650 | | | | 98,170,081 | | | | 91,078,917 | | | | 100,033,516 | |
| Diluted | | | 90,120,994 | | | | 99,722,575 | | | | 92,079,729 | | | | 101,640,190 | |
| (1) For the three months ended September 30, 2026 and 2025, and for the nine months ended September 30, 2026 and 2025, cost of revenue includes $4.8 million, $2.5 million, $12.5 million, and $6.5 million, respectively, of depreciation and amortization expense. |
| (2) For the three months ended September 30, 2026 and 2025, and for the nine months ended September 30, 2025, there was no impairment recorded in cost of revenue. For the nine months ended September 30, 2026, cost of revenue includes impairment of $0.5 million. |
| |
Unaudited Geographical Revenue**(in thousands)**
| | | Three Months Ended | | | Nine Months Ended | |
| | | September 30, | | | September 30, | |
| | | 2026 | | | 2025 | | | 2026 | | | 2025 | |
| Revenue by Geographic Region | | | | | | | | | | | | |
| U.S. | | $ | 232,490 | | | $ | 210,441 | | | $ | 678,751 | | | $ | 608,321 | |
| International | | | 25,876 | | | | 21,212 | | | | 74,141 | | | | 57,565 | |
| Total | | $ | 258,366 | | | $ | 231,653 | | | $ | 752,892 | | | $ | 665,886 | |
| | | | | | | | | | | | | | | | | |
Unaudited Condensed Consolidated Statements of Cash Flows (in thousands)
| | | Three Months Ended | | | Nine Months Ended | |
| | | September 30, | | | September 30, | |
| | | 2026 | | | 2025 | | | 2026 | | | 2025 | |
| Operating Activities | | | | | | | | | | | | |
| Consolidated net income | | $ | 52,789 | | | $ | 44,717 | | | $ | 134,210 | | | $ | 106,105 | |
| Adjustments to reconcile consolidated net income to net cash provided by operating activities | | | | | | | | | | | | |
| Depreciation and amortization | | | 8,722 | | | | 7,356 | | | | 23,821 | | | | 20,592 | |
| Currency loss (gain) on foreign denominated transactions | | | 32 | | | | 11 | | | | 197 | | | | (446 | ) |
| Other non-cash income, net | | | — | | | | (101 | ) | | | — | | | | (101 | ) |
| Deferred taxes | | | 7,882 | | | | 27,296 | | | | 12,575 | | | | 13,966 | |
| Provision for doubtful accounts | | | 657 | | | | 924 | | | | 2,143 | | | | 2,047 | |
| Stock-based compensation expense | | | 13,003 | | | | 12,627 | | | | 39,633 | | | | 38,552 | |
| Amortization of deferred financing costs | | | 216 | | | | 129 | | | | 474 | | | | 387 | |
| Amortization of deferred contract costs | | | 4,761 | | | | 4,172 | | | | 14,510 | | | | 11,986 | |
| Impairments | | | — | | | | — | | | | 20,161 | | | | 32,552 | |
| Changes in operating assets and liabilities | | | | | | | | | | | | |
| Accounts receivable | | | (3,973 | ) | | | 1,181 | | | | (7,383 | ) | | | 3,404 | |
| Inventory | | | — | | | | 711 | | | | — | | | | 338 | |
| Prepaid expenses, prepaid income taxes, and other assets | | | 1,793 | | | | (17,346 | ) | | | 14,790 | | | | (8,452 | ) |
| Deferred contract costs | | | (3,773 | ) | | | (4,278 | ) | | | (13,489 | ) | | | (13,707 | ) |
| Accounts payable | | | (4,577 | ) | | | (2,465 | ) | | | 1,948 | | | | 4,227 | |
| Accrued expenses, accrued income taxes, and other liabilities | | | 4,176 | | | | (2,854 | ) | | | 3,994 | | | | (6,058 | ) |
| Deferred revenue | | | 680 | | | | 247 | | | | 2,091 | | | | 1,933 | |
| Lease obligations | | | (1,575 | ) | | | (1,162 | ) | | | (4,422 | ) | | | 4,838 | |
| Net cash provided by operating activities | | | 80,813 | | | | 71,165 | | | | 245,253 | | | | 212,163 | |
| Investing Activities | | | | | | | | | | | | |
| Purchases of property and equipment | | | (996 | ) | | | (1,362 | ) | | | (1,949 | ) | | | (5,185 | ) |
| Capitalization of website development costs | | | (5,947 | ) | | | (5,794 | ) | | | (18,596 | ) | | | (17,447 | ) |
| Net cash used in investing activities | | | (6,943 | ) | | | (7,156 | ) | | | (20,545 | ) | | | (22,632 | ) |
| Financing Activities | | | | | | | | | | | | |
| Proceeds from issuance of common stock upon exercise of stock options | | | — | | | | 25 | | | | 55 | | | | 429 | |
| Payment of withholding taxes on net share settlements of restricted stock units | | | (7,393 | ) | | | (7,374 | ) | | | (20,989 | ) | | | (22,704 | ) |
| Repurchases of common stock | | | (22,934 | ) | | | (110,279 | ) | | | (225,069 | ) | | | (294,887 | ) |
| Payment of excise tax for repurchase of common stock | | | — | | | | — | | | | (2,654 | ) | | | (682 | ) |
| Payment of deferred financing costs | | | (691 | ) | | | — | | | | (691 | ) | | | — | |
| Payment of finance lease obligations | | | (22 | ) | | | (20 | ) | | | (65 | ) | | | (60 | ) |
| Change in gross advance payments received from third-party transaction processor | | | — | | | | (803 | ) | | | — | | | | (1,084 | ) |
| Net cash used in financing activities | | | (31,040 | ) | | | (118,451 | ) | | | (249,413 | ) | | | (318,988 | ) |
| Impact of foreign currency on cash, cash equivalents, and restricted cash | | | (56 | ) | | | (52 | ) | | | (903 | ) | | | 2,083 | |
| Net increase (decrease) in cash, cash equivalents, and restricted cash | | | 42,774 | | | | (54,494 | ) | | | (25,608 | ) | | | (127,374 | ) |
| Cash, cash equivalents, and restricted cash at beginning of period | | | 122,136 | | | | 233,349 | | | | 190,518 | | | | 306,229 | |
| Cash, cash equivalents, and restricted cash at end of period | | $ | 164,910 | | | $ | 178,855 | | | $ | 164,910 | | | $ | 178,855 | |
| | | | | | | | | | | | | | | | | |
Unaudited Reconciliation of GAAP Gross Profit from Continuing Operations to Non-GAAP Gross Profit from Continuing Operations and GAAP Gross Profit Margin from Continuing Operations to Non-GAAP Gross Profit Margin from Continuing Operations (in thousands, except percentages)
| | | Three Months Ended | | | Nine Months Ended | |
| | | September 30, | | | September 30, | |
| | | 2026 | | | 2025 | | | 2026 | | | 2025 | |
| Revenue | | $ | 258,366 | | | $ | 231,653 | | | $ | 752,892 | | | $ | 665,886 | |
| Cost of revenue | | | 21,288 | | | | 16,946 | | | | 60,095 | | | | 46,966 | |
| GAAP gross profit from continuing operations | | | 237,078 | | | | 214,707 | | | | 692,797 | | | | 618,920 | |
| Stock-based compensation expense included in cost of revenue | | | 55 | | | | 70 | | | | 171 | | | | 209 | |
| Impairments included in cost of revenue | | | — | | | | — | | | | 510 | | | | — | |
| Non-GAAP gross profit from continuing operations | | $ | 237,133 | | | $ | 214,777 | | | $ | 693,478 | | | $ | 619,129 | |
| | | | | | | | | | | | | |
| GAAP gross profit margin from continuing operations | | | 92 | % | | | 93 | % | | | 92 | % | | | 93 | % |
| Non-GAAP gross profit margin from continuing operations | | | 92 | % | | | 93 | % | | | 92 | % | | | 93 | % |
| | | | | | | | | | | | | | | | | |
Unaudited Reconciliation of GAAP Net Income from Continuing Operations to Non-GAAP Net Income from Continuing Operations and GAAP Net Income from Continuing Operations Per Share Attributable to Common Stockholders to Non-GAAP Net Income from Continuing Operations Per Share Attributable to Common Stockholders (in thousands, except per share data)
| | | Three Months Ended | | | Nine Months Ended | |
| | | September 30, | | | September 30, | |
| | | 2026 | | | 2025 | | | 2026 | | | 2025 | |
| GAAP net income from continuing operations | | $ | 52,789 | | | $ | 51,941 | | | $ | 134,210 | | | $ | 143,004 | |
| Amortization of intangible assets | | | 237 | | | | 239 | | | | 714 | | | | 705 | |
| Stock-based compensation expense | | | 13,003 | | | | 12,026 | | | | 39,633 | | | | 36,926 | |
| Transaction-related expenses | | | — | | | | (2 | ) | | | — | | | | 5 | |
| Impairments | | | — | | | | — | | | | 20,161 | | | | 499 | |
| Income tax effects and adjustments | | | (3,265 | ) | | | (4,009 | ) | | | (15,990 | ) | | | (13,256 | ) |
| Non-GAAP net income from continuing operations | | $ | 62,764 | | | $ | 60,195 | | | $ | 178,728 | | | $ | 167,883 | |
| GAAP net income from continuing operations per share attributable to common stockholders | | | | | | | | | | | | |
| Basic | | $ | 0.59 | | | $ | 0.53 | | | $ | 1.47 | | | $ | 1.43 | |
| Diluted | | $ | 0.59 | | | $ | 0.52 | | | $ | 1.46 | | | $ | 1.41 | |
| Non-GAAP net income from continuing operations per share attributable to common stockholders | | | | | | | | | | | | |
| Basic | | $ | 0.70 | | | $ | 0.61 | | | $ | 1.96 | | | $ | 1.68 | |
| Diluted | | $ | 0.70 | | | $ | 0.60 | | | $ | 1.94 | | | $ | 1.65 | |
| Shares used in GAAP and Non-GAAP per share calculations | | | | | | | | | | | | |
| Basic | | | 89,105 | | | | 98,170 | | | | 91,079 | | | | 100,034 | |
| Diluted | | | 90,121 | | | | 99,723 | | | | 92,080 | | | | 101,640 | |
| | | | | | | | | | | | | | | | | |
Unaudited Reconciliation of GAAP Net Income from Continuing Operations to Non-GAAP Adjusted EBITDA from Continuing Operations and GAAP Net Income Margin from Continuing Operations to Non-GAAP Adjusted EBITDA Margin from Continuing Operations (in thousands, except percentages)
| | | Three Months Ended | | | Nine Months Ended | |
| | | September 30, | | | September 30, | |
| | | 2026 | | | 2025 | | | 2026 | | | 2025 | |
| GAAP net income from continuing operations | | $ | 52,789 | | | $ | 51,941 | | | $ | 134,210 | | | $ | 143,004 | |
| Depreciation and amortization | | | 8,722 | | | | 6,308 | | | | 23,821 | | | | 17,773 | |
| Stock-based compensation expense | | | 13,003 | | | | 12,026 | | | | 39,633 | | | | 36,926 | |
| Transaction-related expenses | | | — | | | | (2 | ) | | | — | | | | 5 | |
| Impairments | | | — | | | | — | | | | 20,161 | | | | 499 | |
| Other income, net | | | (683 | ) | | | (1,883 | ) | | | (2,256 | ) | | | (7,243 | ) |
| Provision for income taxes | | | 15,826 | | | | 14,057 | | | | 39,039 | | | | 39,557 | |
| Non-GAAP adjusted EBITDA from continuing operations | | $ | 89,657 | | | $ | 82,447 | | | $ | 254,608 | | | $ | 230,521 | |
| | | | | | | | | | | | | |
| GAAP net income margin from continuing operations | | | 20 | % | | | 22 | % | | | 18 | % | | | 21 | % |
| Non-GAAP adjusted EBITDA margin from continuing operations | | | 35 | % | | | 36 | % | | | 34 | % | | | 35 | % |
| | | | | | | | | | | | | | | | | |
Unaudited Reconciliation of GAAP Expense from Continuing Operations to Non-GAAP Expense from Continuing Operations (in thousands)
| | | Three Months Ended September 30, 2026 | |
| | | GAAP expense | | | Amortization of intangible assets | | | Stock-based compensation expense | | | Transaction-related expenses | | | Impairments | | | Non-GAAP expense | |
| Cost of revenue | | $ | 21,288 | | | $ | — | | | $ | (55 | ) | | $ | — | | | $ | — | | | $ | 21,233 | |
| Sales and marketing | | | 99,242 | | | | — | | | | (2,550 | ) | | | — | | | | — | | | | 96,692 | |
| Product, technology, and development | | | 38,493 | | | | — | | | | (5,337 | ) | | | — | | | | — | | | | 33,156 | |
| General and administrative | | | 27,522 | | | | — | | | | (5,061 | ) | | | — | | | | — | | | | 22,461 | |
| Impairments | | | — | | | | — | | | | — | | | | — | | | | — | | | | — | |
| Depreciation & amortization | | | 3,889 | | | | (237 | ) | | | — | | | | — | | | | — | | | | 3,652 | |
| Operating expenses from continuing operations(1) | | $ | 169,146 | | | $ | (237 | ) | | $ | (12,948 | ) | | $ | — | | | $ | — | | | $ | 155,961 | |
| Total cost of revenue and operating expenses from continuing operations | | $ | 190,434 | | | $ | (237 | ) | | $ | (13,003 | ) | | $ | — | | | $ | — | | | $ | 177,194 | |
| | | | | | | | | | | | | | | | | | | |
| | | | | | | | | | | | | | | | | | | |
| | | Three Months Ended September 30, 2025 | |
| | | GAAP expense | | | Amortization of intangible assets | | | Stock-based compensation expense | | | Transaction-related expenses | | | Impairments | | | Non-GAAP expense | |
| Cost of revenue | | $ | 16,946 | | | $ | — | | | $ | (70 | ) | | $ | — | | | $ | — | | | $ | 16,876 | |
| Sales and marketing | | | 87,039 | | | | — | | | | (2,664 | ) | | | — | | | | — | | | | 84,375 | |
| Product, technology, and development | | | 34,139 | | | | — | | | | (5,240 | ) | | | 2 | | | | — | | | | 28,901 | |
| General and administrative | | | 25,546 | | | | — | | | | (4,052 | ) | | | — | | | | — | | | | 21,494 | |
| Impairments | | | — | | | | — | | | | — | | | | — | | | | — | | | | — | |
| Depreciation & amortization | | | 3,868 | | | | (239 | ) | | | — | | | | — | | | | — | | | | 3,629 | |
| Operating expenses from continuing operations(1) | | $ | 150,592 | | | $ | (239 | ) | | $ | (11,956 | ) | | $ | 2 | | | $ | — | | | $ | 138,399 | |
| Total cost of revenue and operating expenses from continuing operations | | $ | 167,538 | | | $ | (239 | ) | | $ | (12,026 | ) | | $ | 2 | | | $ | — | | | $ | 155,275 | |
| | | | | | | | | | | | | | | | | | | |
| | | | | | | | | | | | | | | | | | | |
| | | Nine Months Ended September 30, 2026 | |
| | | GAAP expense | | | Amortization of intangible assets | | | Stock-based compensation expense | | | Transaction-related expenses | | | Impairments | | | Non-GAAP expense | |
| Cost of revenue | | $ | 60,095 | | | $ | — | | | $ | (171 | ) | | $ | — | | | $ | (510 | ) | | $ | 59,414 | |
| Sales and marketing | | | 294,361 | | | | — | | | | (8,450 | ) | | | — | | | | — | | | | 285,911 | |
| Product, technology, and development | | | 114,301 | | | | — | | | | (16,373 | ) | | | — | | | | — | | | | 97,928 | |
| General and administrative | | | 82,212 | | | | — | | | | (14,639 | ) | | | — | | | | — | | | | 67,573 | |
| Impairments | | | 19,651 | | | | — | | | | — | | | | — | | | | (19,651 | ) | | | — | |
| Depreciation & amortization | | | 11,279 | | | | (714 | ) | | | — | | | | — | | | | — | | | | 10,565 | |
| Operating expenses from continuing operations(1) | | $ | 521,804 | | | $ | (714 | ) | | $ | (39,462 | ) | | $ | — | | | $ | (19,651 | ) | | $ | 461,977 | |
| Total cost of revenue and operating expenses from continuing operations | | $ | 581,899 | | | $ | (714 | ) | | $ | (39,633 | ) | | $ | — | | | $ | (20,161 | ) | | $ | 521,391 | |
| | | | | | | | | | | | | | | | | | | |
| | | Nine Months Ended September 30, 2025 | |
| | | GAAP expense | | | Amortization of intangible assets | | | Stock-based compensation expense | | | Transaction-related expenses | | | Impairments | | | Non-GAAP expense | |
| Cost of revenue | | $ | 46,966 | | | $ | — | | | $ | (209 | ) | | $ | — | | | $ | — | | | $ | 46,757 | |
| Sales and marketing | | | 253,295 | | | | — | | | | (8,240 | ) | | | — | | | | — | | | | 245,055 | |
| Product, technology, and development | | | 102,892 | | | | — | | | | (16,209 | ) | | | — | | | | — | | | | 86,683 | |
| General and administrative | | | 75,597 | | | | — | | | | (12,268 | ) | | | (5 | ) | | | — | | | | 63,324 | |
| Impairments | | | 499 | | | | — | | | | — | | | | — | | | | (499 | ) | | | — | |
| Depreciation & amortization | | | 11,319 | | | | (705 | ) | | | — | | | | — | | | | — | | | | 10,614 | |
| Operating expenses from continuing operations(1) | | $ | 443,602 | | | $ | (705 | ) | | $ | (36,717 | ) | | $ | (5 | ) | | $ | (499 | ) | | $ | 405,676 | |
| Total cost of revenue and operating expenses from continuing operations | | $ | 490,568 | | | $ | (705 | ) | | $ | (36,926 | ) | | $ | (5 | ) | | $ | (499 | ) | | $ | 452,433 | |
| (1) Operating expenses include sales and marketing, product, technology, and development, general and administrative, impairments, and depreciation & amortization. |
| |
Unaudited Reconciliation of GAAP Net Cash, Cash Equivalents, and Restricted Cash Provided by Operating Activities to Non-GAAP Free Cash Flow**(in thousands)**
| | | Three Months Ended | | | Nine Months Ended | |
| | | September 30, | | | September 30, | |
| | | 2026 | | | 2025 | | | 2026 | | | 2025 | |
| GAAP net cash, cash equivalents, and restricted cash provided by operating activities | | $ | 80,813 | | | $ | 71,165 | | | $ | 245,253 | | | $ | 212,163 | |
| Purchases of property and equipment | | | (996 | ) | | | (1,362 | ) | | | (1,949 | ) | | | (5,185 | ) |
| Capitalization of website development costs | | | (5,947 | ) | | | (5,794 | ) | | | (18,596 | ) | | | (17,447 | ) |
| Non-GAAP free cash flow | | $ | 73,870 | | | $ | 64,009 | | | $ | 224,708 | | | $ | 189,531 | |
| | | | | | | | | | | | | | | | | |
Non-GAAP Financial Measures and Other Business Metrics
To supplement our consolidated financial statements, which are prepared and presented in accordance with generally accepted accounting principles in the U.S. ("GAAP"), we provide investors with certain non-GAAP financial measures and other business metrics, which we believe are helpful to our investors. We use these non-GAAP financial measures and other business metrics for financial and operational decision-making purposes and as a means to evaluate period-to-period comparisons. We believe that these non-GAAP financial measures and other business metrics provide useful information about our operating results, enhance the overall understanding of past financial performance and future prospects, and allow for greater transparency with respect to metrics used by our management in its financial and operational decision-making.
The presentation of non-GAAP financial measures and other business metrics is not meant to be considered in isolation or as a substitute for the directly comparable financial measures prepared in accordance with GAAP. While our non-GAAP financial measures and other business metrics are an important tool for financial and operational decision-making and for evaluating our own operating results over different periods of time, we urge investors to review the reconciliation of these financial measures to the comparable GAAP financial measures included above, and not to rely on any single financial measure to evaluate our business.
While a reconciliation of non-GAAP guidance measures to corresponding GAAP measures is not available on a forward-looking basis because we are unable to accurately predict without unreasonable effort the exact amount or timing of certain reconciling items between such GAAP and non-GAAP financial measures, including, as applicable, depreciation expenses, amortization of intangible assets, non-intangible amortization, stock-based compensation, transaction-related expenses, impairments, and income tax effects, we have provided a reconciliation of non-GAAP financial measures and other business metrics to the nearest comparable GAAP measures in the accompanying financial statement tables included in this press release.
We monitor operating measures of certain non-GAAP items including non-GAAP gross profit from continuing operations, non-GAAP gross margin from continuing operations, non-GAAP expense from continuing operations, non-GAAP net income from continuing operations, and non-GAAP net income from continuing operations per share attributable to common stockholders. These non-GAAP financial measures exclude the effect of amortization of intangible assets, stock-based compensation expense, transaction related-expenses, and impairments. Non-GAAP net income from continuing operations and non-GAAP net income from continuing operations per share attributable to common stockholders also exclude certain income tax effects and adjustments. Our calculations of non-GAAP net income from continuing operations per share attributable to common stockholders utilize applicable GAAP share counts as included in the accompanying financial statement tables included in this press release. In addition, we evaluate our non-GAAP gross profit from continuing operations in relation to our revenue. We refer to this as non-GAAP gross profit margin from continuing operations and define it as non-GAAP gross profit from continuing operations divided by total revenue. We believe that these non-GAAP financial measures provide useful information to investors and others in understanding and evaluating our operating results, enhance the overall understanding of past financial performance and future prospects, and allow for greater transparency with respect to key financial metrics used by our management in its financial and operational decision-making.
We define non-GAAP Adjusted EBITDA from continuing operations as net income from continuing operations adjusted to exclude: depreciation and amortization, stock-based compensation expense, transaction-related expenses, impairments, other income, net, and provision for income taxes. In addition, we evaluate our non-GAAP Adjusted EBITDA from continuing operations in relation to our revenue. We refer to this as non-GAAP Adjusted EBITDA margin from continuing operations and define it as non-GAAP Adjusted EBITDA from continuing operations divided by total revenue.
We have presented non-GAAP Adjusted EBITDA from continuing operations and non-GAAP Adjusted EBITDA margin from continuing operations because they are key measures used by our management and Board of Directors to understand and evaluate our operating performance, generate future operating plans, and make strategic decisions regarding the allocation of capital. We believe non-GAAP Adjusted EBITDA from continuing operations helps identify underlying trends in our business that could otherwise be masked by the effect of the expenses that we exclude. Accordingly, we believe that non-GAAP Adjusted EBITDA from continuing operations provides useful information to investors and others in understanding and evaluating our operating results, enhances the overall understanding of our past financial performance and future prospects, and allows for greater transparency with respect to key financial metrics used by our management in its financial and operational decision making.
We define non-GAAP Free Cash Flow as cash flow from operations adjusted to include: purchases of property and equipment and capitalization of website development costs. We have presented non-GAAP Free Cash Flow because it is a measure of our financial performance that represents the cash that we are able to generate after expenditures required to maintain or expand our asset base.
We define a paying dealer as a dealer account with an active, paid subscription at the end of a defined period. The number of paying dealers we have is important to us and we believe it provides valuable information to investors because it is indicative of the value proposition of our products, as well as our sales and marketing success and opportunity, including our ability to retain paying dealers and develop new dealer relationships.
We define Quarterly Average Revenue per Subscribing Dealer (“QARSD”), which is measured at the end of a fiscal quarter, as the revenue primarily from subscription products during that trailing quarter divided by the average number of paying dealers during the quarter. We calculate the average number of paying dealers for a period by adding the number of paying dealers at the end of such period and the end of the prior period and dividing by two. This information is important to us, and we believe it provides useful information to investors, because we believe that our ability to grow QARSD is an indicator of the value proposition of our products and the return on investment that our paying dealers realize from our products. In addition, increases in QARSD, which we believe reflect the value of exposure to our engaged audience in relation to subscription cost, are driven in part by our ability to grow the volume of connections to our users and the quality of those connections, which result in increased opportunity to upsell package levels and cross-sell additional products to our paying dealers.


Source: CarGurus, Inc.
Investor Contact
Kirndeep Singh
VP, Head of Investor Relations