|
The Cheesecake Factory Incorporated is a restaurant company operating upscale casual dining establishments in the United States and Canada. The company owns and operates restaurants under brands including The Cheesecake Factory, North Italia, and Flower Child, as well as additional brands within its Fox Restaurant Concepts portfolio. Internationally, The Cheesecake Factory restaurants operate under licensing agreements. The company also maintains a bakery division with two facilities that produce cheesecakes and other baked products for its restaurants, international licensees, and third-party customers. The business originated in 1972 when Oscar and Evelyn Overton founded a bakery, and the first restaurant opened in 1978 in Beverly Hills, California. Menus feature extensive selections of freshly prepared food items and proprietary desserts, catering to diverse dining occasions from lunch and dinner to brunch and late-night service. Summarised from the company's own disclosures, fiscal year ended Feb 2026 |
Industry Restaurants | Homepage thecheesecakefactory.com |
| Sector Consumer Cyclical | IR page investors.thecheesecakefactory.com/home/default.aspx | |
|
Tags
upscale casual dining, full-service restaurants, bakery production, dessert manufacturing, food service, hospitality, licensed operations, multi-brand portfolio, The Cheesecake Factory, North Italia, Flower Child, Fox Restaurant Concepts, Grand Lux Cafe, SkinnyLicious, The Cheesecake Factory Oscar and Evelyn Overton Charitable Foundation
|
Press page — |
Metrics
| Valuation | |
|---|---|
| Market cap | $ 5.667B |
| Market cap (USD) | $ 5.667B |
| P/E | 27.01 |
| PEG | 0.53 |
| P/BV | 9.87 |
| P/S | 1.42 |
| P/OCF | 14.58 |
| P/FCF | 25.85 |
| Dividend yield | 1.0% |
| Turnover / mcap | — |
| Returns | |
|---|---|
| ROE | 33.7% |
| ROI | 13.9% |
| ROIC | 16.0% |
| Profit margin | 4.0% |
| Growth | |
|---|---|
| Revenue growing | Yes |
| Profits growing | No |
| Revenue up 3y | Yes |
| Revenue up 5y | Yes |
| Earnings growth 3y (net profit CAGR) | 51.0% |
| Quality | |
|---|---|
| Profitable | Yes |
| Margin expanding | Yes |
| Buying back stock | Yes |
| Diluting (TTM) | No |
| Debt/Equity | 108.5% |
| Podcast bulls (TTM) | Sign up |
| Podcast bears (TTM) | Sign up |
| Podcast sentiment (TTM) | Sign up |
| Podcast sentiment % (TTM) | Sign up |
| News sentiment (TTM) | 24 |
| Quality score | 31.6% |
| Insiders | |
|---|---|
| Buys, 1w | Sign up |
| Buys, 1m | Sign up |
| Buys, 1y | Sign up |
| Sells, 1w | Sign up |
| Sells, 1m | Sign up |
| Sells, 1y | Sign up |
Sign up to see this company's insider trades
| Figure | FY 2025 | FY 2024 | FY 2023 | FY 2022 | FY 2021 | FY 2020 | FY 2019 | FY 2018 | FY 2017 | FY 2016 | FY 2015 | FY 2014 | FY 2013 | FY 2012 | FY 2011 | FY 2010 | FY 2009 | FY 2008 | FY 2007 | FY 2006 | FY 2005 | FY 2004 | FY 2003 | FY 2002 | FY 2001 | FY 2000 |
|---|---|---|---|---|---|---|---|---|---|---|---|---|---|---|---|---|---|---|---|---|---|---|---|---|---|---|
| Revenue | 3.752B | 3.582B | 3.44B | 3.303B | 2.928B | 1.983B | 2.483B | 2.332B | 2.261B | 2.276B | 2.101B | 1.977B | 1.878B | 1.809B | 1.758B | 1.659B | 1.602B | 1.606B | — | — | — | 969.232M | 773.835M | 651.97M | — | — |
| Net profit | 148.427M | 156.783M | 101.351M | 43.123M | 72.373M | -253.365M | 127.293M | 99.035M | 157.392M | 139.494M | 116.523M | 101.276M | 114.356M | 98.423M | 95.72M | 81.713M | 42.833M | 52.293M | — | — | — | 66.538M | 57.836M | 49.075M | — | — |
| Free cash flow | 155.077M | 107.961M | 66.836M | 49.462M | 146.063M | -47.421M | 144.996M | 188.406M | 118.017M | 186.699M | 81.482M | 125.667M | 98.496M | 108.929M | 119.318M | 123.389M | 159.892M | 84.278M | — | — | — | -11.76M | 11.094M | 6.834M | — | — |
| Figure | FY 2025 | FY 2024 | FY 2023 | FY 2022 | FY 2021 | FY 2020 | FY 2019 | FY 2018 | FY 2017 | FY 2016 | FY 2015 | FY 2014 | FY 2013 | FY 2012 | FY 2011 | FY 2010 | FY 2009 | FY 2008 | FY 2007 | FY 2006 | FY 2005 | FY 2004 | FY 2003 | FY 2002 | FY 2001 | FY 2000 |
|---|---|---|---|---|---|---|---|---|---|---|---|---|---|---|---|---|---|---|---|---|---|---|---|---|---|---|
| Share price | 50.48 | 47.44 | 35.01 | 31.71 | 39.15 | 37.06 | 38.86 | 43.51 | 48.18 | 59.88 | 46.11 | 50.31 | 48.27 | 32.71 | 29.51 | 30.65 | 21.56 | 22.38 | 23.28 | 25.95 | — | — | — | — | — | — |
| Price performance 12m | 0.06 | 0.36 | 0.1 | -0.19 | 0.06 | -0.05 | -0.11 | -0.1 | -0.2 | 0.3 | -0.08 | 0.04 | 0.48 | 0.11 | -0.04 | 0.42 | -0.04 | -0.04 | -0.1 | — | — | — | — | — | — | — |
Filed figures
Lines the statements and their notes report beside the headline figures, read from the filings' XBRL as filed (no restatement applied), with figures computed from one filing's own lines. Cash-flow lines carry their cash direction: an outflow is negative. Each period links to its filing; a figure's period, report date and tag are in its tooltip.
| Figure | Dec 2016 | Dec 2017 | Dec 2018 | Dec 2019 | Dec 2020 | Dec 2021 | Dec 2022 | Dec 2023 | Dec 2024 | Dec 2025 |
|---|---|---|---|---|---|---|---|---|---|---|
| Balance sheet detail | ||||||||||
| Trade receivables (USD) | 15.6M | 19.9M | 20.9M | 25.6M | — | — | — | — | — | — |
| ↳ YoY growth | +10.4% | +27.1% | +5.4% | +22.4% | ||||||
| ↳ 5y CAGR | +6.6% | +6.4% | +15.7% | +11.0% | ||||||
| Borrowings, current (USD) | — | — | — | — | — | — | — | — | — | 68.8M |
| Borrowings, non-current (USD) | — | 10M | 10M | 290M | 280M | 466M | 468M | 470M | 452M | 561M |
| Lease liabilities (USD) | — | — | — | 1.32B | 1.36B | 1.35B | 1.37B | 1.39B | 1.46B | 1.5B |
| Cash and deposits (USD) | 53.8M | 6.01M | 26.6M | 58.4M | 154M | 190M | 115M | 56.3M | 84.2M | 216M |
| Intangible assets (USD) | 23.1M | 24.1M | 26.2M | 437M | 253M | 252M | 252M | 252M | 252M | 252M |
| Right-of-use assets (USD) | — | — | — | 1.24B | 1.25B | 1.24B | 1.27B | 1.3B | 1.4B | 1.44B |
| Net debt (borrowings + leases - cash) (USD) | — | 3.99M | -16.6M | 1.55B | 1.48B | 1.63B | 1.73B | 1.8B | 1.82B | 1.91B |
| Cash flow detail | ||||||||||
| Operating cash flow (USD) | 303M | 239M | 291M | 219M | 2.91M | 213M | 162M | 218M | 268M | 301M |
| Purchases of property, plant and equipment (USD) | -116M | -121M | -103M | -73.8M | -50.3M | -66.9M | -112M | -152M | -160M | -146M |
| Purchases of intangible assets (USD) | -1.64M | -1.65M | -3.02M | -2.1M | -585,000 | -606,000 | -680,000 | -1.66M | -1.05M | -1.06M |
| Change in receivables (cash effect) (USD) | -1.47M | -4.23M | -1.02M | — | — | — | — | — | — | — |
| Change in inventories (cash effect) (USD) | -916,000 | -7.63M | 3.67M | -5.77M | 7.92M | -3.48M | -12.7M | -2.09M | -6.88M | 10.6M |
| Change in payables (cash effect) (USD) | 752,000 | 3.77M | 5.6M | 2.33M | -2.01M | -3.68M | 17.6M | 3.97M | -1.83M | 1.7M |
| Dividends paid (cash effect) (USD) | -42.4M | -49.9M | -56.3M | -60.7M | -15.8M | -337,000 | -42.3M | -53.2M | -53M | -52.2M |
| Share buybacks (cash effect) (USD) | -146M | -123M | -109M | -51M | -3.62M | -5.77M | -63.1M | -46.1M | -18.2M | -154M |
| Interest paid (cash effect) (USD) | -6.04M | -7.13M | -8.16M | -1.65M | -13M | -9.59M | -7.23M | -9.76M | -12.9M | -8.68M |
| Income taxes paid (cash effect) (USD) | -17.9M | -31.6M | -10.1M | -20.8M | -2.97M | -13M | -14.7M | -14.5M | -19.1M | -22.8M |
| Share-based compensation (USD) | 21.5M | 16.5M | 20M | 19.4M | 21.4M | 23M | 24.4M | 25.8M | 30M | 27.2M |
| Operating cash flow before change in receivables (USD) | 304M | 243M | 292M | — | — | — | — | — | — | — |
| Free cash flow (OCF - PPE - intangibles) (USD) | 185M | 116M | 185M | 143M | -48M | 145M | 48.8M | 65.2M | 107M | 154M |
| Income detail | ||||||||||
| Total comprehensive income (USD) | 139M | 157M | 98.2M | 128M | -257M | 75.9M | 42.4M | 102M | 156M | 149M |
| Comprehensive income to owners (USD) | 139M | 157M | 98.2M | 128M | -257M | 75.9M | 42.4M | 102M | 156M | 149M |
| Reported | Feb 28, 2018 | Feb 28, 2018 | Mar 4, 2019 | Mar 12, 2020 | Feb 24, 2021 | Feb 22, 2022 | Feb 27, 2023 | Feb 26, 2024 | Feb 24, 2025 | Feb 23, 2026 |
Operating KPIs — quarters
Business figures the company publishes beside its accounts (users, subscribers, same-store sales, production, occupancy ...), read from its results releases and reports, with the growth on the same period a year earlier beneath each: computed from the figures, and as the company states it where it does. Each figure links to its source; counts at a period end show under that period.
Operating KPIs — years
Business figures the company publishes beside its accounts (users, subscribers, same-store sales, production, occupancy ...), read from its results releases and reports, with the growth on the same period a year earlier beneath each: computed from the figures, and as the company states it where it does. Each figure links to its source; counts at a period end show under that period.
Sign up to see institutional holdings
Sign UpPodcast Mentions
Sign up to see podcast mentions and sentiment
Sign UpMaterial events reported to the SEC on Form 8-K or 6-K, newest first. The link opens the filing itself on EDGAR. Press releases from the company's own website, newest first.
November 4, 2026
CALABASAS HILLS, Calif.--(BUSINESS WIRE)-- The Cheesecake Factory Incorporated (NASDAQ: CAKE) today announced that management will participate in the Stephens Annual Investment Conference to be held November 17-19, 2026 in Nashville, TN. David Gordon, President, and Matthew Clark, Executive Vice President, will participate in a fireside chat on Wednesday, November 18, 2026 at 10:15 a.m. Central Time and host investor meetings**.**
The fireside chat will be webcast on the Company’s website at investors.thecheesecakefactory.com and a replay of the webcast will be available following the live presentation. Investors interested in scheduling a meeting with management should contact their Stephens sales representative.
About The Cheesecake Factory Incorporated
The Cheesecake Factory Incorporated is a leader in experiential dining. We are culinary forward and relentlessly focused on hospitality. Delicious, memorable experiences created by passionate people—this defines who we are and where we are going. We currently own and operate 385 restaurants throughout the United States and Canada under brands including The Cheesecake Factory®, North Italia®, Flower Child® and a collection of other FRC brands. Internationally, 35 The Cheesecake Factory® restaurants operate under licensing agreements. Our bakery division operates two facilities that produce quality cheesecakes and other baked products for our restaurants, international licensees and third-party bakery customers. In 2026, we were named to the FORTUNE Magazine “100 Best Companies to Work For®” list for the thirteenth consecutive year. To learn more, visit www.thecheesecakefactory.com , www.northitalia.com , www.iamaflowerchild.com and www.foxrc.com .
From Fortune. ©2026 Fortune Media IP Limited. All rights reserved. Used under license. Fortune® and Fortune 100 Best Companies to Work For® are registered trademarks of Fortune Media IP Limited and are used under license. Fortune and Fortune Media IP Limited are not affiliated with, and do not endorse products or services of, The Cheesecake Factory Incorporated.
Etienne Marcus
(818) 871-3000
[email protected]
Source: The Cheesecake Factory Incorporated
Multimedia Files:
-
Company's logo
Download:
Download original 411 KB (2794 x 1325) Download image: Company's logo as a original in JPG format. Opens in a new window
Investor Email Alerts
To opt-in for investor email alerts, please enter your email address in the field below and select at least one alert option. After submitting your request, you will receive an activation email to the requested email address. You must click the activation link in order to complete your subscription. You can sign up for additional alert options at any time.
At The Cheesecake Factory, we promise to treat your data with respect and will not share your information with any third party. You can unsubscribe to any of the investor alerts you are subscribed to by visiting the ‘unsubscribe’ section below. If you experience any issues with this process, please contact us for further assistance.
By providing your email address below, you are providing consent to The Cheesecake Factory to send you the requested Investor Email Alert updates.
* Required
Email Address * Investor Alert Options *
| Press Releases |
| SEC Filings |
| Events |
| Presentations |
| Annual Reports |
| Enter the code shown above. |
| * |
Email Alert Sign Up Confirmation
Footer Primary
-
Restaurant Information
-
Restaurant Information
-
Shop
-
Shop
-
Additional Information
-
Additional Information
Follow Us!
© 2026 TCF Co. LLC. All Rights Reserved.
October 27, 2026
CALABASAS HILLS, Calif.--(BUSINESS WIRE)-- The Cheesecake Factory Incorporated (NASDAQ: CAKE) today reported financial results for the third quarter of fiscal 2026, which ended on September 29, 2026.
Total revenues were $1,033.4 million in the third quarter of fiscal 2026 compared to $907.2 million in the third quarter of fiscal 2025. Net income and diluted net income per share were $61.3 million and $1.19, respectively, in the third quarter of fiscal 2026.
The Company recorded a pre-tax net income of $12.9 million related to Fox Restaurant Concepts (“FRC”) acquisition-related items. Excluding the after-tax impact of these items and certain other items, adjusted net income and adjusted diluted net income per share for the third quarter of fiscal 2026 were $52.3 million and $1.02, respectively. Please see the Company’s reconciliation of non-GAAP financial measures at the end of this press release.
Comparable restaurant sales at The Cheesecake Factory restaurants increased 15.2% year-over-year in the third quarter of fiscal 2026.
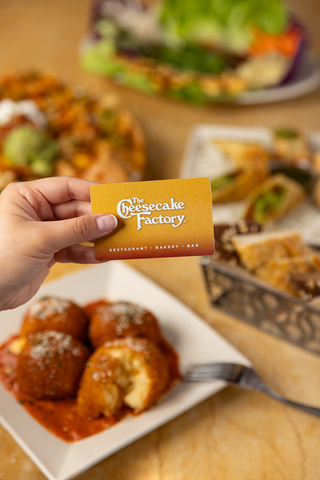
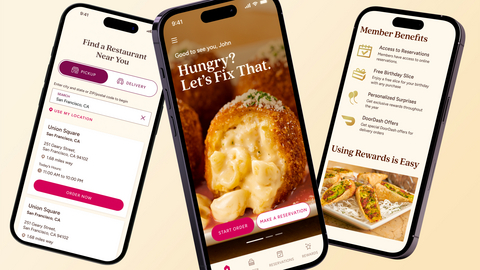
“We delivered an exceptional third quarter, generating record quarterly revenue, with margins and earnings also exceeding our expectations,” said David Overton, Chairman and Chief Executive Officer. “The Cheesecake Factory restaurants led our performance, with comparable sales and traffic meaningfully outperforming the broader casual dining industry. Our experienced operators executed at a high level, delivering the outstanding food quality, service and hospitality that keep our guests coming back. Continued menu innovation, our rewards program and significant engagement across social media contributed to the impressive sales growth, while year-over-year improvements in labor productivity and food efficiency supported strong profitability.”
Mr. Overton continued, “The Cheesecake Factory has long enjoyed tremendous brand affinity across generations, and its ability to attract younger guests reinforces the enduring appeal and relevance of our namesake concept. We remain focused on delivering the memorable dining experiences that have defined our success, while building on the momentum of the rewards program and further expanding engagement across digital and social platforms. These strengths reinforce our competitive position and give us confidence in our ability to deliver profitable growth and long-term shareholder value.”
Development
During the third quarter of fiscal 2026, the Company opened six new restaurants, including two Cheesecake Factory restaurants, one North Italia, one Flower Child and two FRC restaurants. Subsequent to quarter-end, the Company opened two Flower Childs and one FRC restaurant.
The Company continues to expect to open as many as 26 new restaurants in fiscal 2026, including as many as five The Cheesecake Factory restaurants, eight North Italia locations, seven Flower Child locations and as many as six FRC restaurants.
Liquidity and Capital Allocation
As of September 29, 2026, the Company had total available liquidity of $585.3 million, including a cash balance of $249.3 million and $336.0 million of availability on its revolving credit facility with no outstanding balance. Total principal amount of debt outstanding was $575 million, representing the principal amount of 2.00% convertible senior notes due 2030.
During the third quarter of fiscal 2026, the Company repurchased approximately 29,800 shares of its stock at a cost of $2.4 million. In addition, the Company’s Board of Directors has declared a quarterly dividend of $0.30 per share to be paid on November 24, 2026, to shareholders of record at the close of business on November 10, 2026.
Conference Call and Webcast
The Company will hold a conference call to review its results for the third quarter of fiscal 2026 today at 2:00 p.m. Pacific Time. The conference call will be webcast live on the Company’s website at investors.thecheesecakefactory.com .
About The Cheesecake Factory Incorporated
The Cheesecake Factory Incorporated is a leader in experiential dining. We are culinary forward and relentlessly focused on hospitality. Delicious, memorable experiences created by passionate people—this defines who we are and where we are going. We currently own and operate 383 restaurants throughout the United States and Canada under brands including The Cheesecake Factory®, North Italia®, Flower Child® and a collection of other FRC brands. Internationally, 35 The Cheesecake Factory® restaurants operate under licensing agreements. Our bakery division operates two facilities that produce quality cheesecakes and other baked products for our restaurants, international licensees and third-party bakery customers. In 2026, we were named to the FORTUNE Magazine “100 Best Companies to Work For®” list for the thirteenth consecutive year. To learn more, visit www.thecheesecakefactory.com , www.northitalia.com , www.iamaflowerchild.com and www.foxrc.com .
From Fortune. ©2026 Fortune Media IP Limited. All rights reserved. Used under license. Fortune® and Fortune 100 Best Companies to Work For® are registered trademarks of Fortune Media IP Limited and are used under license. Fortune and Fortune Media IP Limited are not affiliated with, and do not endorse products or services of, The Cheesecake Factory Incorporated.
Safe Harbor Statement
This press release contains forward-looking statements within the meaning of the Private Securities Litigation Reform Act of 1995, as codified in Section 27A of the Securities Act of 1933, as amended, and Section 21E of the Securities Exchange Act of 1934, as amended. These statements include, without limitation, statements regarding the Company’s operations, growth, restaurant development and other objectives. Such forward-looking statements include all other statements that are not historical facts, as well as statements that are preceded by, followed by or that include words or phrases such as “believe,” “plan,” “will likely result,” “expect,” “intend,” “will continue,” “is anticipated,” “estimate,” “project,” “may,” “could,” “would,” “should” and similar expressions. These statements are based on current expectations and involve risks and uncertainties which may cause results to differ materially from those set forth in such statements. Investors are cautioned that forward-looking statements are not guarantees of future performance and that undue reliance should not be placed on such statements. These forward-looking statements may be affected by various factors including: economic, public health and political conditions that impact consumer confidence and spending, including government shutdowns, trade policy, interest rate fluctuations, periods of heightened inflation and market instability, and armed conflicts; supply chain disruptions; demonstrations, political unrest, potential damage to or closure of the Company’s restaurants and potential reputational damage to the Company or any of its brands; public health crises, including the potential for quarantines or restrictions affecting in-person dining; acceptance and success of The Cheesecake Factory in international markets; acceptance and success of North Italia, Flower Child and Other Fox Restaurant Concepts restaurants; the risks of doing business abroad through Company-owned restaurants and/or licensees; foreign exchange rates, tariffs and cross-border taxation; changes in unemployment rates; increases in minimum wages and benefit costs; the economic health of the Company’s landlords and other tenants in retail centers in which its restaurants are located, and the Company’s ability to successfully manage its lease arrangements with landlords; the economic health of suppliers, licensees, vendors and other third parties providing goods or services to the Company; the timing of new unit development and related permitting; compliance with debt covenants; our ability to satisfy our obligations under our convertible senior notes due 2030; strategic capital allocation decisions including with respect to share repurchases or dividends; the ability to achieve projected financial results; the resolution of uncertain tax positions with the Internal Revenue Service and the impact of changes in tax laws; changes in laws impacting the Company’s business; adverse weather conditions and natural disasters in regions in which the Company’s restaurants are located; factors that are under the control of government agencies, landlords and other third parties; the risks, costs and uncertainties associated with opening new restaurants; and other risks and uncertainties detailed from time to time in the Company’s filings with the Securities and Exchange Commission (“SEC”). Forward-looking statements speak only as of the dates on which they are made, and the Company undertakes no obligation to publicly update or revise any forward-looking statements or to make any other forward-looking statements, whether as a result of new information, future events or otherwise, unless required to do so by law. Investors are referred to the full discussion of risks and uncertainties associated with forward-looking statements and the discussion of risk factors contained in the Company’s latest Annual Report on Form 10-K, Quarterly Reports on Form 10-Q and Current Reports on Form 8-K as filed with the SEC, which are available at www.sec.gov .
| The Cheesecake Factory Incorporated | ||||||||||||||||||||||||
| Condensed Consolidated Statements of Income | ||||||||||||||||||||||||
| (unaudited; in thousands, except per share data) | ||||||||||||||||||||||||
| 13 Weeks Ended | 13 Weeks Ended | 39 Weeks Ended | 39 Weeks Ended | |||||||||||||||||||||
| Consolidated Statements of Income | September 29, 2026 | September 30, 2025 | September 29, 2026 | September 30, 2025 | ||||||||||||||||||||
| Amount | Percent of Revenues | Amount | Percent of Revenues | Amount | Percent of Revenues | Amount | Percent of Revenues | |||||||||||||||||
| Revenues | $ | 1,033,440 | 100.0 | % | $ | 907,226 | 100.0 | % | $ | 3,041,906 | 100.0 | % | $ | 2,790,248 | 100.0 | % | ||||||||
| Costs and expenses: | ||||||||||||||||||||||||
| Food and beverage costs | 218,919 | 21.2 | % | 197,654 | 21.8 | % | 655,016 | 21.5 | % | 605,758 | 21.7 | % | ||||||||||||
| Labor expenses | 359,758 | 34.8 | % | 322,774 | 35.6 | % | 1,059,002 | 34.8 | % | 987,368 | 35.4 | % | ||||||||||||
| Other operating costs and expenses | 285,791 | 27.7 | % | 255,724 | 28.2 | % | 822,832 | 27.1 | % | 757,871 | 27.2 | % | ||||||||||||
| General and administrative expenses | 66,645 | 6.4 | % | 58,996 | 6.5 | % | 196,168 | 6.4 | % | 177,706 | 6.4 | % | ||||||||||||
| Depreciation and amortization expenses | 29,175 | 2.8 | % | 27,419 | 3.0 | % | 86,262 | 2.8 | % | 80,361 | 2.9 | % | ||||||||||||
| Impairment of assets and lease termination expenses/(income) | 8 | 0.0 | % | (104 | ) | 0.0 | % | 961 | 0.0 | % | 496 | 0.0 | % | |||||||||||
| Acquisition-related contingent consideration, compensation and amortization (income)/expenses | (12,889 | ) | (1.2 | )% | 910 | 0.1 | % | (10,452 | ) | (0.3 | )% | 2,920 | 0.1 | % | ||||||||||
| Preopening costs | 11,160 | 1.1 | % | 6,584 | 0.7 | % | 23,591 | 0.8 | % | 23,718 | 0.8 | % | ||||||||||||
| Total costs and expenses | 958,567 | 92.8 | % | 869,957 | 95.9 | % | 2,833,380 | 93.1 | % | 2,636,198 | 94.5 | % | ||||||||||||
| Income from operations | 74,873 | 7.2 | % | 37,269 | 4.1 | % | 208,526 | 6.9 | % | 154,050 | 5.5 | % | ||||||||||||
| Interest expense, net | (1,988 | ) | (0.2 | )% | (2,247 | ) | (0.3 | )% | (6,040 | ) | (0.2 | )% | (7,448 | ) | (0.2 | )% | ||||||||
| Loss on debt extinguishment | – | – | % | – | – | % | – | – | % | (15,891 | ) | (0.6 | )% | |||||||||||
| Other income, net | 520 | 0.1 | % | 459 | 0.1 | % | 1,173 | 0.0 | % | 1,482 | 0.0 | % | ||||||||||||
| Income before income taxes | 73,405 | 7.1 | % | 35,481 | 3.9 | % | 203,659 | 6.7 | % | 132,193 | 4.7 | % | ||||||||||||
| Income tax provision | 12,105 | 1.2 | % | 3,582 | 0.4 | % | 24,417 | 0.8 | % | 12,541 | 0.4 | % | ||||||||||||
| Net income | $ | 61,300 | 5.9 | % | $ | 31,899 | 3.5 | % | $ | 179,242 | 5.9 | % | $ | 119,652 | 4.3 | % | ||||||||
| Basic net income per share | $ | 1.31 | $ | 0.68 | $ | 3.84 | $ | 2.55 | ||||||||||||||||
| Basic weighted average shares outstanding | 46,775 | 46,608 | 46,663 | 46,842 | ||||||||||||||||||||
| Diluted net income per share | $ | 1.19 | $ | 0.66 | $ | 3.62 | $ | 2.46 | ||||||||||||||||
| Diluted weighted average shares outstanding | 51,473 | 48,616 | 49,487 | 48,633 |
| The Cheesecake Factory Incorporated | ||||||||||||||||||
| Selected Segment Information | ||||||||||||||||||
| (unaudited; in thousands) | ||||||||||||||||||
| For the 13 Weeks Ended September 29, 2026 | ||||||||||||||||||
| The Cheesecake | ||||||||||||||||||
| Factory | North | Other | ||||||||||||||||
| restaurants | Italia | FRC | Other | Total | ||||||||||||||
| Revenues | $ | 754,374 | $ | 92,993 | $ | 90,313 | $ | 95,760 | $ | 1,033,440 | ||||||||
| Costs and expenses: | ||||||||||||||||||
| Food and beverage costs | 162,224 | 20,461 | 19,932 | 16,302 | 218,919 | |||||||||||||
| Labor expenses | 250,934 | 35,770 | 36,366 | 36,688 | 359,758 | |||||||||||||
| Other operating costs and expenses | 200,495 | 26,825 | 29,848 | 28,623 | 285,791 | |||||||||||||
| General and administrative expenses | - | - | - | 66,645 | 66,645 | |||||||||||||
| Depreciation and amortization expenses | 17,357 | 3,620 | 3,697 | 4,501 | 29,175 | |||||||||||||
| Impairment of assets and lease termination expenses | - | - | - | 8 | 8 | |||||||||||||
| Acquisition-related contingent consideration, compensation and amortization (income)/expenses | - | - | 316 | (13,205 | ) | (12,889 | ) | |||||||||||
| Preopening costs | 3,762 | 2,235 | 3,749 | 1,414 | 11,160 | |||||||||||||
| Total costs and expenses | 634,772 | 88,911 | 93,908 | 140,976 | 958,567 | |||||||||||||
| Income/(loss) from operations | $ | 119,602 | $ | 4,082 | $ | (3,595 | ) | $ | (45,216 | ) | $ | 74,873 | ||||||
| For the 13 Weeks Ended September 30, 2025 | ||||||||||||||||||
| The Cheesecake | ||||||||||||||||||
| Factory | North | Other | ||||||||||||||||
| restaurants | Italia | FRC | Other | Total | ||||||||||||||
| Revenues | $ | 651,375 | $ | 83,482 | $ | 78,017 | $ | 94,352 | $ | 907,226 | ||||||||
| Costs and expenses: | ||||||||||||||||||
| Food and beverage costs | 140,859 | 18,091 | 17,360 | 21,344 | 197,654 | |||||||||||||
| Labor expenses | 225,885 | 31,312 | 30,885 | 34,692 | 322,774 | |||||||||||||
| Other operating costs and expenses | 178,249 | 24,100 | 25,926 | 27,449 | 255,724 | |||||||||||||
| General and administrative expenses | - | - | - | 58,996 | 58,996 | |||||||||||||
| Depreciation and amortization expenses | 16,841 | 3,060 | 3,288 | 4,230 | 27,419 | |||||||||||||
| Impairment of assets and lease termination expenses/(income) | 33 | - | (178 | ) | 41 | (104 | ) | |||||||||||
| Acquisition-related contingent consideration, compensation and amortization expenses | - | - | 316 | 594 | 910 | |||||||||||||
| Preopening costs | 1,610 | 1,003 | 3,623 | 348 | 6,584 | |||||||||||||
| Total costs and expenses | 563,477 | 77,566 | 81,220 | 147,694 | 869,957 | |||||||||||||
| Income/(loss) from operations | $ | 87,898 | $ | 5,916 | $ | (3,203 | ) | $ | (53,342 | ) | $ | 37,269 | ||||||
| For the 39 Weeks Ended September 29, 2026 | ||||||||||||||||||
| The Cheesecake | ||||||||||||||||||
| Factory | North | Other | ||||||||||||||||
| restaurants | Italia | FRC | Other | Total | ||||||||||||||
| Revenues | $ | 2,174,323 | $ | 280,912 | $ | 298,867 | $ | 287,804 | $ | 3,041,906 | ||||||||
| Costs and expenses: | ||||||||||||||||||
| Food and beverage costs | 472,056 | 63,026 | 66,151 | 53,783 | 655,016 | |||||||||||||
| Labor expenses | 726,671 | 106,325 | 114,854 | 111,152 | 1,059,002 | |||||||||||||
| Other operating costs and expenses | 567,163 | 77,928 | 91,754 | 85,987 | 822,832 | |||||||||||||
| General and administrative expenses | - | - | - | 196,168 | 196,168 | |||||||||||||
| Depreciation and amortization expenses | 52,053 | 10,438 | 10,660 | 13,111 | 86,262 | |||||||||||||
| Impairment of assets and lease termination expenses | 568 | - | 5 | 388 | 961 | |||||||||||||
| Acquisition-related contingent consideration, compensation and amortization (income)/expenses | - | - | 947 | (11,399 | ) | (10,452 | ) | |||||||||||
| Preopening costs | 6,686 | 6,404 | 7,892 | 2,609 | 23,591 | |||||||||||||
| Total costs and expenses | 1,825,197 | 264,121 | 292,263 | 451,799 | 2,833,380 | |||||||||||||
| Income/(loss) from operations | $ | 349,126 | $ | 16,791 | $ | 6,604 | $ | (163,995 | ) | $ | 208,526 | |||||||
| For the 39 Weeks Ended September 30, 2025 | ||||||||||||||||||
| The Cheesecake | ||||||||||||||||||
| Factory | North | Other | ||||||||||||||||
| restaurants | Italia | FRC | Other | Total | ||||||||||||||
| Revenues | $ | 2,007,366 | $ | 257,722 | $ | 255,619 | $ | 269,541 | $ | 2,790,248 | ||||||||
| Costs and expenses: | ||||||||||||||||||
| Food and beverage costs | 435,891 | 56,341 | 56,303 | 57,223 | 605,758 | |||||||||||||
| Labor expenses | 690,517 | 96,748 | 95,892 | 104,211 | 987,368 | |||||||||||||
| Other operating costs and expenses | 530,995 | 70,777 | 78,720 | 77,379 | 757,871 | |||||||||||||
| General and administrative expenses | - | - | - | 177,706 | 177,706 | |||||||||||||
| Depreciation and amortization expenses | 49,263 | 8,932 | 9,587 | 12,579 | 80,361 | |||||||||||||
| Impairment of assets and lease termination expenses | 304 | - | 137 | 55 | 496 | |||||||||||||
| Acquisition-related contingent consideration, compensation and amortization expenses | - | - | 947 | 1,973 | 2,920 | |||||||||||||
| Preopening costs | 6,518 | 5,629 | 8,618 | 2,953 | 23,718 | |||||||||||||
| Total costs and expenses | 1,713,488 | 238,427 | 250,204 | 434,079 | 2,636,198 | |||||||||||||
| Income/(loss) from operations | $ | 293,878 | $ | 19,295 | $ | 5,415 | $ | (164,538 | ) | $ | 154,050 |
| The Cheesecake Factory Incorporated | ||||||||||||||||
| Selected Operating, Restaurant and Balance Sheet Information | ||||||||||||||||
| (unaudited; in thousands, except statistical data) | ||||||||||||||||
| 13 Weeks Ended | 13 Weeks Ended | 39 Weeks Ended | 39 Weeks Ended | |||||||||||||
| The Cheesecake Factory restaurants operating information: | September 29, 2026 | September 30, 2025 | September 29, 2026 | September 30, 2025 | ||||||||||||
| Comparable restaurant sales vs. prior year | 15.2 | % | 0.3 | % | 7.5 | % | 0.9 | |||||||||
| Restaurants opened during period | 2 | - | 2 | 2 | ||||||||||||
| Restaurants open at period-end | 218 | 216 | 218 | 216 | ||||||||||||
| Restaurant operating weeks | 2,818 | 2,808 | 8,442 | 8,397 | ||||||||||||
| North Italia operating information: | ||||||||||||||||
| Comparable restaurant sales vs. prior year | (3 | )% | (3 | )% | (3 | )% | (1 | |||||||||
| Restaurants opened during period | 1 | - | 4 | 4 | ||||||||||||
| Restaurants open at period-end | 52 | 46 | 52 | 46 | ||||||||||||
| Restaurant operating weeks | 667 | 598 | 1,942 | 1,748 | ||||||||||||
| Other Fox Restaurant Concepts (FRC) operating information:(1) | ||||||||||||||||
| Restaurants opened during period | 2 | 2 | 4 | 6 | ||||||||||||
| Restaurants open at period-end | 59 | 53 | 59 | 53 | ||||||||||||
| Restaurant operating weeks | 752 | 675 | 2,204 | 1,960 | ||||||||||||
| Other operating information:(2) | ||||||||||||||||
| Restaurants opened during period | 1 | - | 3 | 6 | ||||||||||||
| Restaurants open at period-end | 51 | 49 | 51 | 49 | ||||||||||||
| Restaurant operating weeks | 657 | 637 | 1,933 | 1,838 | ||||||||||||
| Number of company-owned restaurants: | ||||||||||||||||
| The Cheesecake Factory | 218 | |||||||||||||||
| North Italia | 52 | |||||||||||||||
| Other FRC | 59 | |||||||||||||||
| Other | 51 | |||||||||||||||
| Total | 380 | |||||||||||||||
| Number of international-licensed restaurants: | ||||||||||||||||
| The Cheesecake Factory | 35 | |||||||||||||||
| (1) The Other FRC segment includes all FRC brands except Flower Child. | ||||||||||||||||
| (2) The Other segment includes the Flower Child and Grand Lux Cafe concepts, as well as the Company's third-party bakery, international and consumer packaged goods businesses, unallocated corporate expenses and gift card costs. | ||||||||||||||||
| Selected Consolidated Balance Sheet Information | September 29, 2026 | December 30, 2025 | ||||||||||||||
| Cash and cash equivalents | $ | 249,269 | $ | 215,729 | ||||||||||||
| Current and long-term debt, net of issuance costs(1) | 563,713 | 630,074 | ||||||||||||||
| (1) As of September 29, 2026, includes $563.7 million net balance of 2.00% convertible senior notes due 2030 (principal amount of $575 million less $11.3 million in unamortized issuance costs). The unamortized issuance costs were recorded as a contra-liability and netted with current and long-term debt on the Condensed Consolidated Balance Sheet and are being amortized as interest expense. |
Reconciliation of Non-GAAP Results to GAAP Results
In addition to the results provided in accordance with accounting principles generally accepted in the United States of America (“GAAP”) in this press release, the Company is providing non-GAAP measurements which present net income and net income per share excluding the impact of certain items. The non-GAAP measurements are intended to supplement the presentation of the Company’s financial results in accordance with GAAP. These non-GAAP measures are calculated by eliminating from net income and diluted net income per share the impact of items the Company does not consider indicative of its ongoing operations. The Company uses these non-GAAP financial measures for financial and operational decision-making and as a means to evaluate period-to-period comparisons.
| The Cheesecake Factory Incorporated | ||||||||||||||||||||
| Reconciliation of Non-GAAP Financial Measures | ||||||||||||||||||||
| (unaudited; in thousands, except per share data) | ||||||||||||||||||||
| 13 Weeks Ended | 13 Weeks Ended | 39 Weeks Ended | 39 Weeks Ended | |||||||||||||||||
| September 29, 2026 | September 30, 2025 | September 29, 2026 | September 30, 2025 | |||||||||||||||||
| Net income (GAAP) | $ | 61,300 | $ | 31,899 | $ | 179,242 | $ | 119,652 | ||||||||||||
| Impairment of assets and lease termination expenses/(income)(1) | 8 | (104 | ) | 961 | 496 | |||||||||||||||
| Acquisition-related contingent consideration, compensation and amortization (income)/expenses(2) | (12,889 | ) | 910 | (10,452 | ) | 2,920 | ||||||||||||||
| Loss on extinguishment of debt(3) | - | - | - | 15,891 | ||||||||||||||||
| Uncertain tax positions(4) | 553 | 717 | 863 | 717 | ||||||||||||||||
| Tax effect of adjustments(5) | 3,349 | (210 | ) | 2,468 | (5,020 | ) | ||||||||||||||
| Adjusted net income (non-GAAP) | $ | 52,321 | $ | 33,212 | $ | 173,082 | $ | 134,656 | ||||||||||||
| Diluted net income per share (GAAP) | $ | 1.19 | $ | 0.66 | $ | 3.62 | $ | 2.46 | ||||||||||||
| Impairment of assets and lease termination expenses/(income)(1) | 0.00 | (0.00 | ) | 0.02 | 0.01 | |||||||||||||||
| Acquisition-related contingent consideration, compensation and amortization (income)/expenses(2) | (0.25 | ) | 0.02 | (0.21 | ) | 0.06 | ||||||||||||||
| Loss on extinguishment of debt(3) | - | - | - | 0.33 | ||||||||||||||||
| Uncertain tax positions(4) | 0.01 | 0.01 | 0.02 | 0.01 | ||||||||||||||||
| Tax effect of adjustments(5) | 0.07 | (0.00 | ) | 0.05 | (0.10 | ) | ||||||||||||||
| Adjusted diluted net income per share (non-GAAP)(6) | $ | 1.02 | $ | 0.68 | $ | 3.50 | $ | 2.77 |
| (1) A detailed breakdown of impairment of assets and lease termination expenses/(income) recorded in the thirteen and thirty-nine weeks ended September 29, 2026 and September 30, 2025 can be found in the Selected Segment Information table. |
| (2) Represents changes in the fair value of the deferred consideration and contingent consideration and compensation liabilities related to the FRC acquisition, as well as amortization of acquired definite-lived licensing agreements. |
| (3) Represents premium paid and acceleration of previously unamortized deferred financing costs as a result of partial redemption of our convertible senior notes due 2026. |
| (4) Represents change to a reserve for uncertain tax position taken in prior years related to tenant improvements allowances and Section 199 deductions. Uncertain tax positions taken in a tax return are recognized in the financial statements when it is more likely than not that the position will be sustained upon examination by tax authorities based on technical merits, taking into account available administrative remedies and litigation. |
| (5) Based on the federal statutory rate and an estimated blended state tax rate, the tax effect on all adjustments assumes a 26% tax rate for the fiscal 2026 and 2025 periods. |
| (6) Adjusted net income per share may not add due to rounding. |
Etienne Marcus
(818) 871-3000
[email protected]
Source: The Cheesecake Factory Incorporated
Multimedia Files:
-
Company's logo
Download:
Download original 411 KB (2794 x 1325) Download image: Company's logo as a original in JPG format. Opens in a new window
Investor Email Alerts
To opt-in for investor email alerts, please enter your email address in the field below and select at least one alert option. After submitting your request, you will receive an activation email to the requested email address. You must click the activation link in order to complete your subscription. You can sign up for additional alert options at any time.
At The Cheesecake Factory, we promise to treat your data with respect and will not share your information with any third party. You can unsubscribe to any of the investor alerts you are subscribed to by visiting the ‘unsubscribe’ section below. If you experience any issues with this process, please contact us for further assistance.
By providing your email address below, you are providing consent to The Cheesecake Factory to send you the requested Investor Email Alert updates.
* Required
Email Address * Investor Alert Options *
| Press Releases |
| SEC Filings |
| Events |
| Presentations |
| Annual Reports |
| Enter the code shown above. |
| * |
Email Alert Sign Up Confirmation
Footer Primary
-
Restaurant Information
-
Restaurant Information
-
Shop
-
Shop
-
Additional Information
-
Additional Information
Follow Us!
© 2026 TCF Co. LLC. All Rights Reserved.







Prompts
Click prompts to add them under the company line, click again to take one out, then copy the result into your AI chat. Shared by Asian Century Stocks and Uncovered Thai Stocks. Thank you.
ETFs Holding The Cheesecake Factory Incorporated
Exchange-traded funds whose newest published daily portfolio holds one of the company's listings, largest weight first.
| ETF | Weight in ETF | Shares | Market value | As of |
|---|---|---|---|---|
| ARWG | 2.60% | 3,506 | $ 383.872K | Aug 31, 2026 |
| QMOM | 2.31% | 78,698 | $ 8.81M | Nov 18, 2026 |
| FFSM | 1.19% | 175,532 | $ 17.802M | Jul 31, 2026 |
| EHLS | 0.61% | 2,979 | $ 326.886K | Nov 17, 2026 |
| MMSC | 0.57% | 2,607 | $ 286.066K | Nov 16, 2026 |
| AVUV | 0.56% | 1,632,542 | $ 179.139M | Nov 16, 2026 |
| LITL | 0.54% | 275 | $ 30.789K | Nov 17, 2026 |
| AFSM | 0.33% | 4,430 | $ 486.104K | Nov 16, 2026 |
| PSC | 0.31% | 92,072 | $ 7.323M | Jun 30, 2026 |
| AVSC | 0.31% | 90,072 | $ 9.884M | Nov 16, 2026 |
| AFMC | 0.25% | 5,893 | $ 646.639K | Nov 16, 2026 |
| FSEG | 0.23% | 168 | $ 13.363K | Jun 30, 2026 |
| RESM | 0.15% | 67 | $ 5,329.18 | Jun 30, 2026 |
| FSML | 0.14% | 2,189 | $ 174.113K | Jun 30, 2026 |
| DFAS | 0.12% | 378,972 | $ 40.247M | Nov 12, 2026 |
| EBI | 0.10% | 6,056 | $ 663.071K | Aug 31, 2026 |
| AVUQ | 0.09% | 3,559 | $ 390.529K | Nov 16, 2026 |
| JMEE | 0.09% | 23,969 | $ 2.684M | Nov 17, 2026 |
| MSSM | 0.06% | 4,001 | $ 438.069K | Aug 31, 2026 |
| AVUS | 0.04% | 54,623 | $ 5.994M | Nov 16, 2026 |
| DXUV | 0.04% | 21,236 | $ 2.255M | Nov 12, 2026 |
| AVSU | 0.03% | 1,429 | $ 156.804K | Nov 16, 2026 |
| IEDI | 0.03% | 80 | $ 8,113.60 | Jul 31, 2026 |
| DFAC | 0.03% | 230,075 | $ 24.434M | Nov 12, 2026 |
| DCOR | 0.03% | 112,376 | $ 11.934M | Nov 12, 2026 |
| SMDX | 0.02% | 238 | $ 26.116K | Nov 17, 2026 |
| DFAU | 0.01% | 14,977 | $ 1.591M | Nov 12, 2026 |
| IALT | 0.01% | 10,246 | $ 1.124M | Nov 16, 2026 |
| DFUS | 0.01% | 16,040 | $ 1.703M | Nov 12, 2026 |
| DFSU | 0.00% | 644 | $ 68.393K | Nov 12, 2026 |
| FBCG | 0.00% | 1,461 | $ 148.175K | Jul 31, 2026 |