August 5, 2026 Download PDF 343.3 KB EL SEGUNDO, Calif., Aug. 05, 2026 (GLOBE NEWSWIRE) -- Beyond Meat, Inc. (NASDAQ: BYND), otherwise known as Beyond The Plant Protein Company™ (the “Company” or “Beyond Meat”), today reported financial results for…
August 5, 2026
Download PDF 343.3 KB
EL SEGUNDO, Calif., Aug. 05, 2026 (GLOBE NEWSWIRE) -- Beyond Meat, Inc. (NASDAQ: BYND), otherwise known as Beyond The Plant Protein Company™ (the “Company” or “Beyond Meat”), today reported financial results for its second quarter ended June 27, 2026.
Second Quarter 2026 Financial Highlights****1
-
Net revenues were $68.8 million, a decrease of 8.2% year-over-year.
-
Gross profit was $5.9 million, or gross margin of 8.5%, compared to gross profit of $7.9 million, or gross margin of 10.6%, in the year-ago period.
-
Gross profit and gross margin included $1.6 million in expenses related to the cessation of the Company’s operational activities in China, compared to $1.7 million in the year-ago period.
-
Loss from operations was $30.8 million, or operating margin of -44.8%, compared to loss from operations of $37.5 million, or operating margin of -50.0%, in the year-ago period.
-
Loss from operations included the following charges recorded in operating expenses: $4.7 million in incremental share-based compensation expense related to the Company’s convertible debt exchange; $0.5 million in certain non-routine SG&A expenses; $0.4 million in amortization of costs related to a partial lease termination of a portion of the Company’s campus headquarters building in El Segundo, California (the “Campus Headquarters”); and a credit of $11.0 million reflecting the settlement of arbitration proceedings related to a previously-disclosed contractual dispute with a former co-manufacturer, compared to an expense of $2.5 million in the year-ago period.
-
Net income was $16.4 million, compared to net loss of $(31.8) million in the year-ago period. Net income per share available to common stockholders - basic was $0.03, compared to net loss per share available to common stockholders - basic of $(0.42) in the year-ago period. Net loss per share available to common stockholders - diluted was $(0.06), compared to net loss per share available to common stockholders - diluted of $(0.42) in the year-ago period. The increase in net income was primarily driven by a $57.7 million non-cash gain on debt extinguishment in connection with conversions of a portion of the Company’s 2030 Notes.
-
Adjusted EBITDA was a loss of $27.7 million, or -40.2% of net revenues, compared to an Adjusted EBITDA loss of $24.7 million, or -33.0% of net revenues, in the year-ago period.
Beyond Meat President and CEO Ethan Brown commented, “Our second quarter results represent directional progress, with net revenues, gross margin and operating expenses all sequentially improving, and our top line comfortably exceeding the high end of our guidance.”
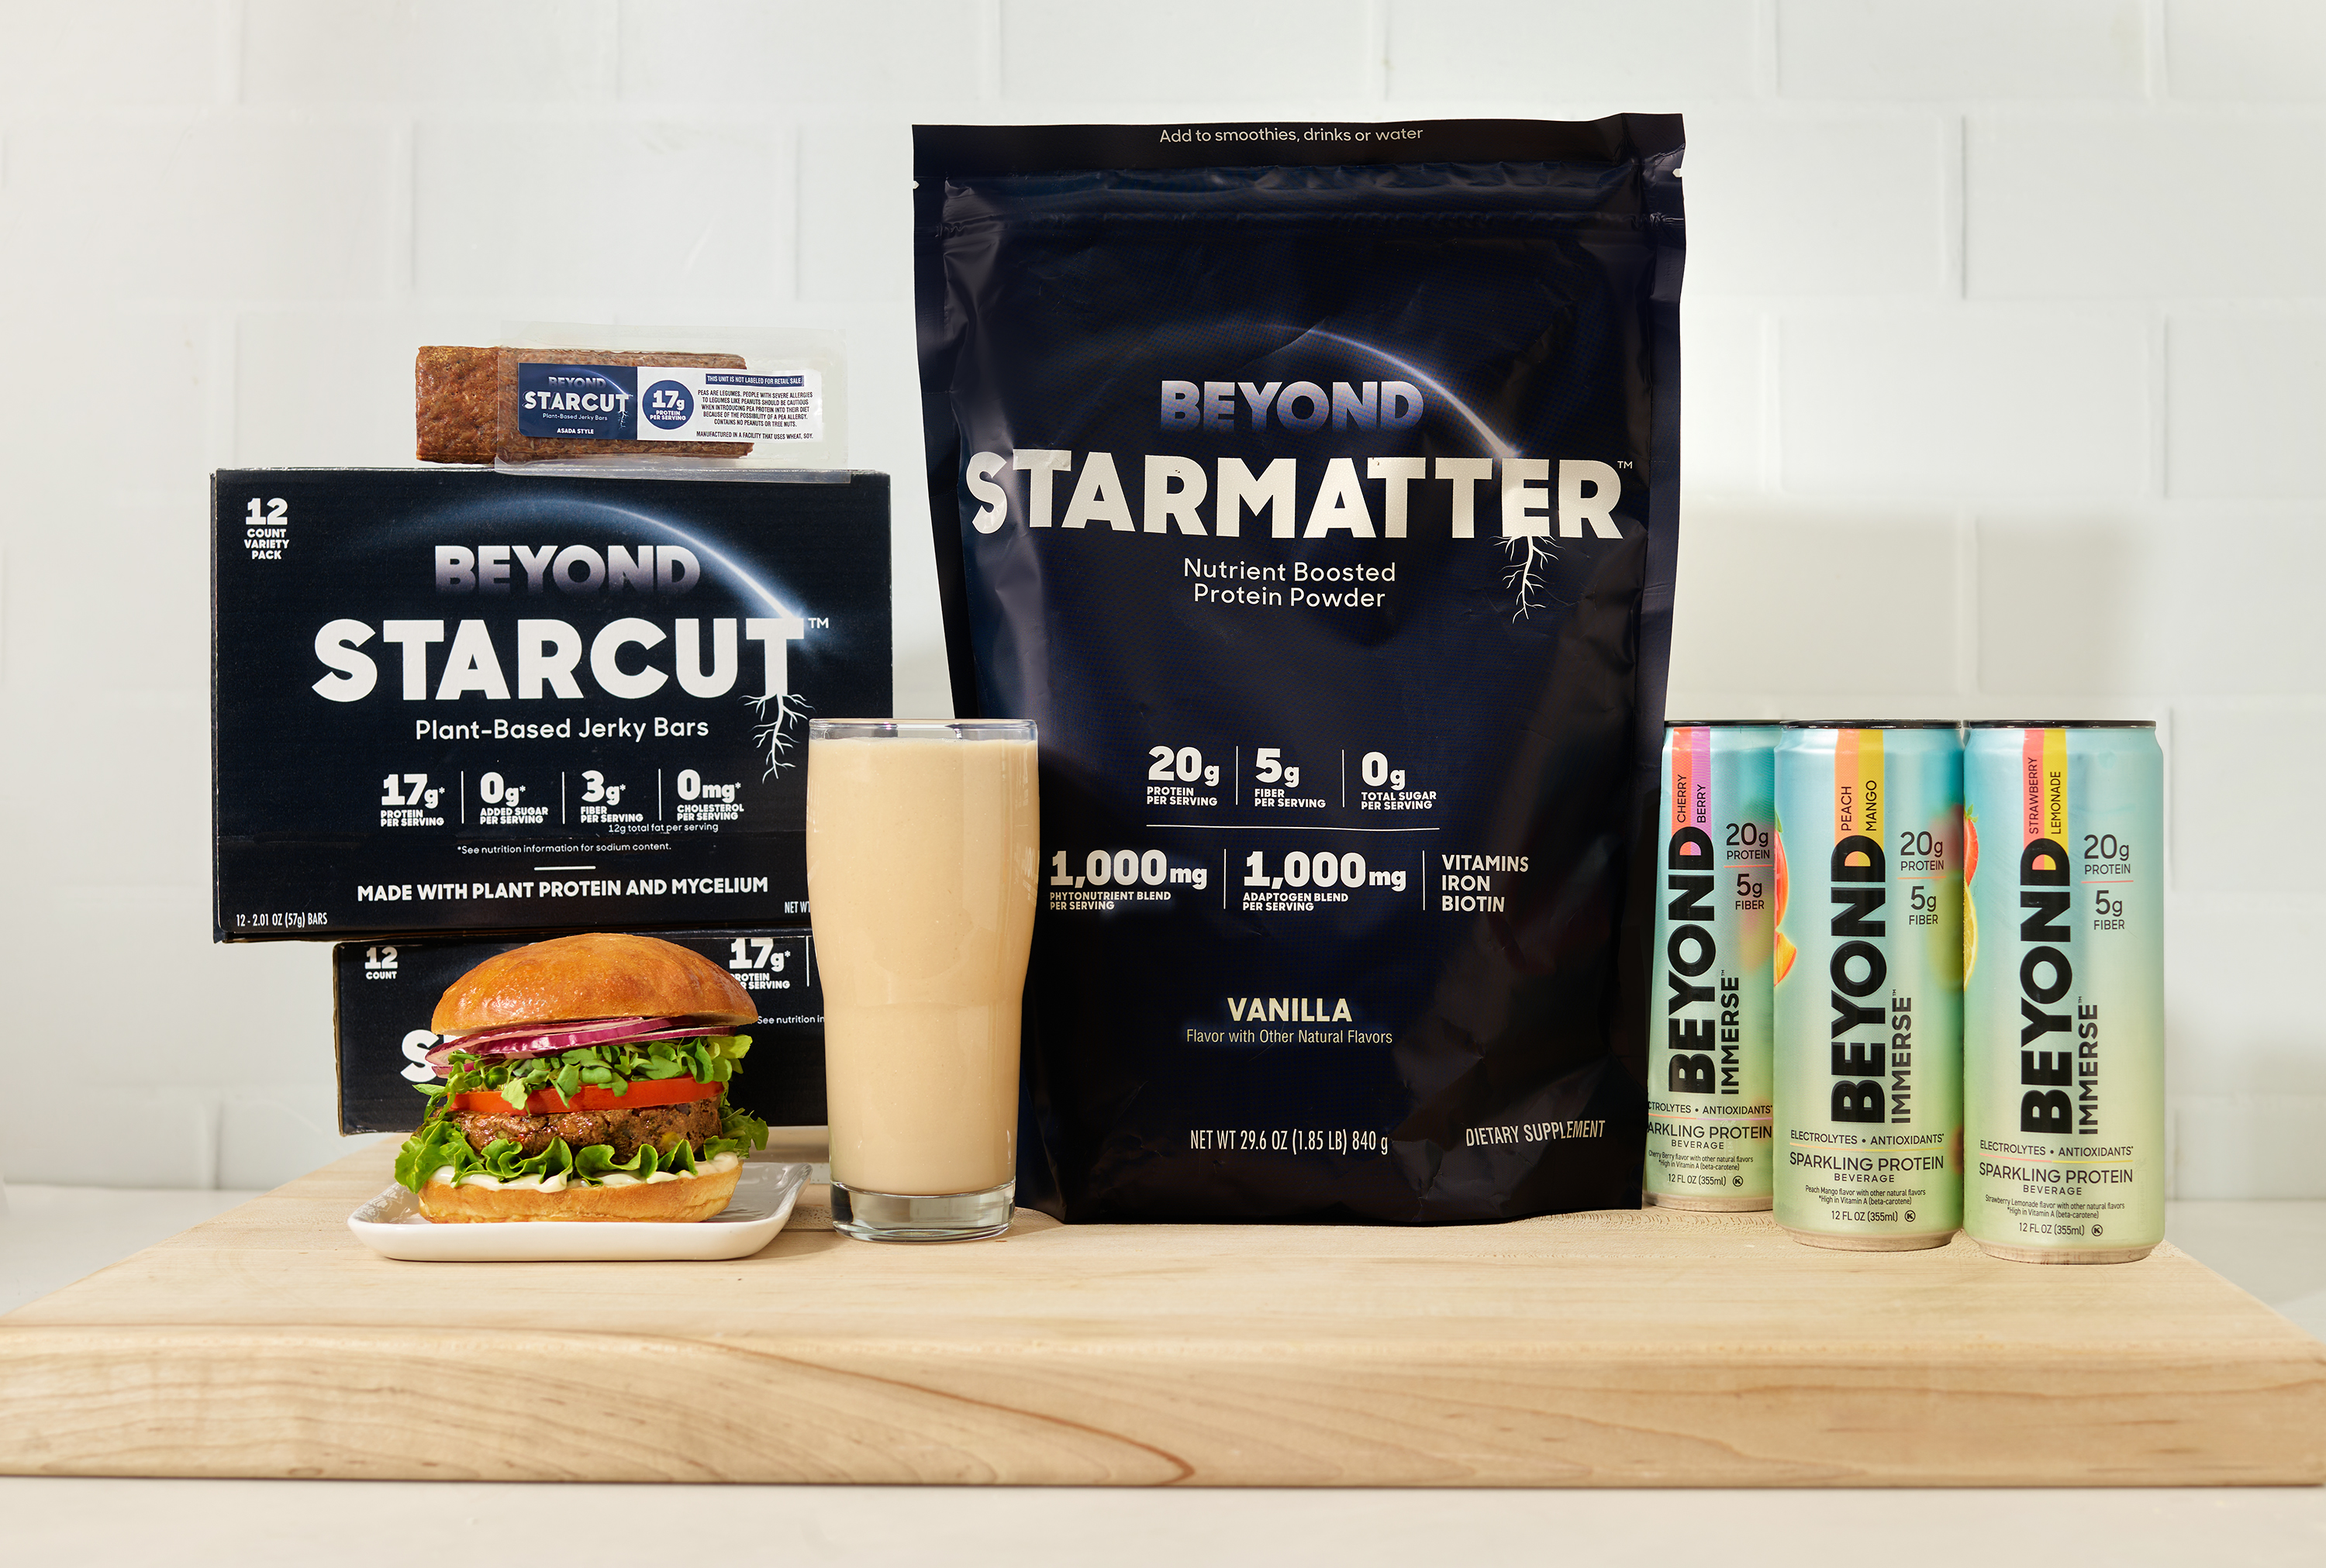
Brown continued, “We continue to work to stabilize our plant-based meat business, with highlights including growth in international retail and the U.S. retail debut of Beyond Steak Filet, and to build upon this core as we reposition around Beyond The Plant Protein CompanyTM to pursue faster-growing adjacent categories. The exciting launch of Beyond Immerse represents the first output of this expanded aperture, and we expect more to come as we execute our plan to deliver the superpowers of plants to a broadening group of consumers.”
Second Quarter 2026
Net revenues decreased 8.2% to $68.8 million in the second quarter of 2026, compared to $75.0 million in the year-ago period. The decrease in net revenues was primarily driven by a 9.5% decrease in volume of products sold, partially offset by a 1.3% increase in net revenue per pound. The decrease in volume of products sold was primarily driven by lower sales of burger and chicken products to Quick Service Restaurant (“QSR”) customers in the international foodservice channel, and by weak category demand and reduced points of distribution in the U.S. foodservice and retail channels. The increase in net revenue per pound was primarily driven by changes in product sales mix and favorable changes in foreign currency exchange rates, partially offset by higher trade discounts.
U.S. retail channel net revenues decreased 9.9% to $29.6 million in the second quarter of 2026, compared to $32.9 million in the year-ago period. The decrease in U.S. retail channel net revenues was primarily driven by a 5.7% decrease in volume of products sold and a 4.5% decrease in net revenue per pound. The decrease in volume of products sold was primarily driven by weak category demand and reduced points of distribution within certain channels. The decrease in net revenue per pound was primarily driven by higher trade discounts and lower price realization on certain of the Company’s products, partially offset by changes in product sales mix.
U.S. foodservice channel net revenues decreased 27.6% to $8.0 million in the second quarter of 2026, compared to $11.1 million in the year-ago period. The decrease in U.S. foodservice channel net revenues was primarily driven by a 27.4% decrease in volume of products sold and a 0.2% decrease in net revenue per pound. The decrease in volume of products sold was primarily driven by weak category demand and reduced points of distribution. The decrease in net revenue per pound was primarily driven by lower price realization on certain of the Company’s products and higher trade discounts, partially offset by changes in product sales mix.
International retail channel net revenues increased 16.5% to $18.5 million in the second quarter of 2026, compared to $15.9 million in the year-ago period. The increase in international retail channel net revenues was primarily driven by an 8.2% increase in volume of products sold and a 7.7% increase in net revenue per pound. The increase in volume of products sold was primarily driven by higher sales of burger products and chicken products in European markets and the U.K., and increased sales of ground beef products in Canada. The increase in net revenue per pound was primarily driven by price increases of certain of the Company’s products and favorable changes in foreign currency exchange rates, partially offset by higher trade discounts.
International foodservice channel net revenues decreased 16.0% to $12.7 million in the second quarter of 2026, compared to $15.1 million in the year-ago period. The decrease in international foodservice channel net revenues was primarily driven by a 20.4% decrease in volume of products sold, partially offset by a 5.5% increase in net revenue per pound. The decrease in volume of products sold was primarily driven by lower sales of burger and chicken products to certain QSR customers. The increase in net revenue per pound was primarily driven by favorable changes in foreign currency exchange rates and lower trade discounts.
Net revenues by channel (unaudited):
The following table presents the Company's net revenues by channel for the respective periods presented (in thousands, except for percentages):
| | | Three Months Ended | | Change | | Six****Months Ended | | Change |
| | | June 27, 2026 | | June 28, 2025 | | Amount | | % | | June 27, 2026 | | June 28, 2025 | | Amount | | % |
| U.S.: | | | | | | | | | | | | | | | | |
| Retail | | $ | 29,637 | | $ | 32,909 | | $ | (3,272 | ) | | (9.9 | )% | | $ | 56,191 | | $ | 64,269 | | $ | (8,078 | ) | | (12.6 | )% |
| Foodservice | | | 8,005 | | | 11,055 | | | (3,050 | ) | | (27.6 | )% | | | 14,624 | | | 20,468 | | | (5,844 | ) | | (28.6 | )% |
| U.S. net revenues | | | 37,642 | | | 43,964 | | | (6,322 | ) | | (14.4 | )% | | | 70,815 | | | 84,737 | | | (13,922 | ) | | (16.4 | )% |
| International: | | | | | | | | | | | | | | | | |
| Retail | | | 18,479 | | | 15,867 | | | 2,612 | | | 16.5 | % | | | 32,188 | | | 28,549 | | | 3,639 | | | 12.7 | % |
| Foodservice | | | 12,711 | | | 15,127 | | | (2,416 | ) | | (16.0 | )% | | | 24,036 | | | 30,403 | | | (6,367 | ) | | (20.9 | )% |
| International net revenues | | | 31,190 | | | 30,994 | | | 196 | | | 0.6 | % | | | 56,224 | | | 58,952 | | | (2,728 | ) | | (4.6 | )% |
| Net revenues | | $ | 68,832 | | $ | 74,958 | | $ | (6,126 | ) | | (8.2 | )% | | $ | 127,039 | | $ | 143,689 | | $ | (16,650 | ) | | (11.6 | )% |
Volume of products sold by channel (unaudited):
The following table presents consolidated volume of the Company’s products sold in pounds for the respective periods presented (in thousands, except for percentages):
| | | Three Months Ended | | Change | | Six****Months Ended | | Change |
| | | June 27, 2026 | | June 28, 2025 | | Amount | | % | | June 27, 2026 | | June 28, 2025 | | Amount | | % |
| U.S.: | | | | | | | | | | | | | | | | |
| Retail | | 5,785 | | 6,136 | | (351 | ) | | (5.7 | )% | | 10,684 | | 11,877 | | (1,193 | ) | | (10.0 | )% |
| Foodservice | | 1,313 | | 1,809 | | (496 | ) | | (27.4 | )% | | 2,389 | | 3,387 | | (998 | ) | | (29.5 | )% |
| International: | | | | | | | | | | | | | | | | |
| Retail | | 3,689 | | 3,410 | | 279 | | | 8.2 | % | | 6,361 | | 6,074 | | 287 | | | 4.7 | % |
| Foodservice | | 3,691 | | 4,635 | | (944 | ) | | (20.4 | )% | | 6,875 | | 9,359 | | (2,484 | ) | | (26.5 | )% |
| Volume of products sold | | 14,478 | | 15,990 | | (1,512 | ) | | (9.5 | )% | | 26,309 | | 30,697 | | (4,388 | ) | | (14.3 | )% |
Gross profit in the second quarter of 2026 was $5.9 million, or gross margin of 8.5%, compared to gross profit of $7.9 million, or gross margin of 10.6%, in the year-ago period. Gross profit and gross margin in the second quarter of 2026 included $1.6 million in expenses related to the cessation of the Company’s operational activities in China, compared to $1.7 million in the year-ago period. Additionally, gross profit and gross margin in the second quarter of 2026 were negatively impacted by a 3.8% increase in cost of goods sold per pound, partially offset by a 1.3% increase in net revenue per pound. The increase in cost of goods sold per pound primarily reflected increased materials costs and higher manufacturing expenses, including depreciation, which included $1.6 million in expenses related to the cessation of our operational activities in China, partially offset by lower inventory provision.
Operating expenses were $36.7 million in the second quarter of 2026, compared to $45.4 million in the year-ago period. Operating expenses in the second quarter of 2026 included $4.7 million in incremental share-based compensation expense related to the Company’s convertible debt exchange, $0.5 million in certain non-routine SG&A expenses, $0.4 million in amortization of costs related to a partial lease termination of a portion of the Company’s Campus Headquarters, and a credit of $11.0 million reflecting the settlement of arbitration proceedings related to a previously-disclosed contractual dispute with a former co-manufacturer, compared to an expense of $2.5 million in the year-ago period.
Loss from operations in the second quarter of 2026 was $30.8 million, compared to $37.5 million in the year-ago period. The reduction in loss from operations was driven by the decrease in operating expenses, partially offset by the decrease in gross profit.
The following table summarizes certain charges recorded in the Company’s condensed consolidated statement of operations for the second quarter of 2026 (unaudited):
| (in thousands) | | | | Three Months Ended June 27, 2026 |
| | | | | | |
| Charges recorded in cost of goods sold | | | |
| Expenses related to cessation of operational activities in China | | $ | 1,560 | |
| Total charges recorded in cost of goods sold | | | | 1,560 | |
| | | | | | |
| Charges recorded in operating expenses | | | |
| Incremental non-cash share-based compensation expense | | | 4,747 | |
| Certain non-routine SG&A expenses | | | | 467 | |
| Amortization of costs related to partial lease termination | | | 387 | |
| Settlement related to contractual dispute with former co-manufacturer | | (11,000 | ) |
| Total charges recorded in operating expenses | | | (5,399 | ) |
| Total | | | | | $ | (3,839 | ) |
Total other income, net, was $47.2 million in the second quarter of 2026, compared to $5.7 million in the year-ago period. The increase in total other income, net, was primarily due to $57.7 million in non-cash gain on debt extinguishment in connection with conversions of a portion of the Company’s 2030 Notes, partially offset by a $4.6 million increase in interest expense and a $3.8 million non-cash loss from the remeasurement of derivative liability.
Net income was $16.4 million in the second quarter of 2026, compared to net loss of $(31.8) million in the year-ago period. Net income per share available to common stockholders - basic was $0.03, compared to net loss per share available to common stockholders - basic of $(0.42) in the year-ago period. Net loss per share available to common stockholders - diluted was $(0.06), compared to net loss per share available to common stockholders - diluted of $(0.42) in the year-ago period. The increase in net income in the second quarter of 2026 was primarily driven by the increase in total other income, net, and the decrease in loss from operations.
Adjusted EBITDA was a loss of $27.7 million, or -40.2% of net revenues, in the second quarter of 2026, compared to an Adjusted EBITDA loss of $24.7 million, or -33.0% of net revenues, in the year-ago period.
Balance Sheet and Cash Flow Highlights
The Company’s cash and cash equivalents balance, including restricted cash, was $186.1 million and total outstanding carrying value of debt, net of debt discount, was $323.8 million as of June 27, 2026, which included the total undiscounted future cash flows of the 2030 Notes recorded at the completion of the Company’s convertible debt exchange. Net cash used in operating activities was $23.2 million in the six months ended June 27, 2026, compared to $58.0 million in the year-ago period. Capital expenditures totaled $4.0 million in the six months ended June 27, 2026, compared to $6.4 million in the year-ago period. Net cash used in investing activities was $2.3 million in the six months ended June 27, 2026, compared to $6.1 million in the year-ago period. Net cash used in financing activities was $6.6 million in the six months ended June 27, 2026, compared to net cash provided by financing activities of $32.3 million in the year-ago period.
Third Quarter 2026 Outlook
The Company continues to experience an elevated level of uncertainty and volatility within its operating environment, which has, and may continue to have, unforeseen impacts on the Company’s actual realized results. In light of this uncertainty, the Company is limiting its outlook to the following:
- In the third quarter of 2026, net revenues are expected to be approximately $60 million to $65 million.
Conference Call and Webcast
The Company will host a conference call to discuss these results at 5:00 p.m. Eastern, 2:00 p.m. Pacific on Wednesday, August 5, 2026. Investors interested in participating in the live call can dial 412-902-4255. There will also be a simultaneous, live webcast available on the Investors section of the Company’s website at www.beyondmeat.com. The webcast will also be archived.
About Beyond Meat
Beyond Meat, Inc. (NASDAQ: BYND), otherwise known as Beyond The Plant Protein Company™, is a plant protein company offering a portfolio of plant-based products made from simple ingredients without GMOs, no added hormones or antibiotics, and 0 mg of cholesterol per serving. Founded in 2009, Beyond Meat’s core products are designed to have the same taste and texture as animal-based meat while being better for people and the planet. Beyond Meat’s brand promise, Eat What You Love®, represents a strong belief that there is a better way to feed our future and that the positive choices we all make, no matter how small, can have a great impact on our personal health and the health of our planet. By shifting from animal-based protein to plant-based protein, we can positively impact four growing global issues: human health, climate change, constraints on natural resources and animal welfare. Visit www.BeyondMeat.com and follow @BeyondMeat on Facebook, Instagram, Threads and LinkedIn.
Forward-Looking Statements
Certain statements in this release constitute “forward-looking statements" within the meaning of the federal securities laws, including statements related to the Company’s expectations with respect to its third quarter 2026 outlook, its strategic repositioning and expansion into adjacent product categories, and efforts towards sustainable growth and improved financial performance.
Forward-looking statements are based on management's current opinions, expectations, beliefs, plans, objectives, assumptions and projections regarding financial performance, prospects, future events and future results, including ongoing uncertainty related to macroeconomic issues, including high inflation and interest rates, prolonged, weakening demand in the plant-based meat category, ongoing concerns about the likelihood of a recession and increased competition, among other matters, and involve known and unknown risks that are difficult to predict. In some cases, you can identify forward-looking statements by the use of words such as “may,” “could,” “expect,” “intend,” “plan,” “seek,” “anticipate,” “believe,” “estimate,” “project,” “predict,” “outlook,” “potential,” “continue,” “likely,” “will,” “would” and variations of these terms and similar expressions, or the negative of these terms or similar expressions. These forward-looking statements are only predictions, not historical fact, and involve certain risks and uncertainties, as well as assumptions. Forward-looking statements should not be read as a guarantee of future performance or results, and will not necessarily be accurate indications of the times at, or by which or whether, such performance or results will be achieved. Actual results, levels of activity, performance, achievements and events could differ materially from those stated, anticipated or implied by such forward-looking statements. While Beyond Meat believes that its assumptions are reasonable, it is very difficult to predict the impact of known factors and, of course, it is impossible to anticipate all factors that could affect actual results. There are many risks and uncertainties that could cause actual results to differ materially from forward-looking statements made herein including, but not limited to: a further decrease in demand, and the underlying factors negatively impacting demand, in the plant-based meat category, including the exacerbation of weakness in the category by macroeconomic trends; the success of our marketing initiatives and the ability to maintain and grow our brand awareness, maintain, protect and enhance our brand, or rebrand altogether, attract and retain new customers and maintain and grow our market share, particularly while we are seeking to reduce our operating expenses; the success of our strategic repositioning to "Beyond The Plant Protein Company," including risks related to brand dilution or confusion, the failure to achieve meaningful consumer acceptance of an expanded portfolio of plant-based protein offerings across multiple categories and adjacencies, and the diversion of management time and financial resources from our existing business or other priorities; changes in the retail landscape, including our ability to maintain and expand our distribution footprint, the timing, success and level of trade and promotion discounts, our ability to maintain and grow market share and increase household penetration, repeat purchases, buying rates (amount spent per buyer) and purchase frequency, our ability to maintain and increase sales velocity of our products, and the timing and success of our efforts to expand distribution channels, such as our direct-to-consumer (DTC) channel, and planned new products or recently launched products; our ability to successfully innovate and commercialize new plant-based protein products, including in adjacent categories outside of our core, meat analog offerings, such as our Beyond Immerse functional beverage line of sparkling plant-based protein drinks, and consumer acceptance of such new products; the sufficiency of our cash and cash equivalents to meet our liquidity needs, including estimates of our expenses, future revenues, capital expenditures and capital requirements; our ability to obtain additional equity and/or debt financing, the terms of any such financing, and our ability to continue to bolster our balance sheet, particularly because we no longer satisfy the eligibility requirements for use of a registration statement on Form S-3 and, as a result, are unable to access our ATM Program; risks associated with our indebtedness, leverage and liquidity relating to our significant debt, including our ability to repay, refinance, equitize (in the case of our 0% Convertible Senior Notes due 2027 (the “2027 Notes”) that remain outstanding) and otherwise satisfy our obligations under each of the Loan and Security Agreement, the 2027 Notes that remain outstanding and our 7.00% Convertible Senior Secured Second Lien PIK Toggle Notes due 2030 (the “2030 Notes” and, together with the 2027 Notes, the “Notes”) issued in the exchange offer related to the 2027 Notes, which was completed on October 30, 2025 (the “Exchange Offer”), and our ability to comply with the covenants in the Loan and Security Agreement and respective indentures governing the Notes; our ability to raise the funds necessary to repurchase the Notes for cash, under certain circumstances, or to pay any cash amounts due under the Notes; the impact of the Exchange Offer on future availability of our pre-change net operating loss carryforwards and other tax attributes to offset our future net taxable income; the annual limitations on utilization of any remaining operating loss and tax credit carryforwards due to ownership change limitations provided by the Internal Revenue Code and similar state tax provisions, and the outcomes of any related audits or examinations; the significant dilution to our stockholders that resulted from the Exchange Offer and the additional dilution that resulted and will continue to result if we continue to exchange any portion of our outstanding Notes for equity, issue shares of our common stock with respect to the 2030 Notes (including any 2030 Notes issued as payment-in-kind interest on such 2030 Notes), including in connection with conversions of the 2030 Notes at our option or at the option of holders, upon equitization of the 2030 Notes, as payment of accrued interest in the form of common stock or in payment of certain make-whole payments on the 2030 Notes, in each case pursuant to the terms of the 2030 Notes, or if the lenders under the Loan and Security Agreement exercise their related warrants to purchase shares of our common stock or if the holders of the Big Geyser, Inc. warrants exercise their related warrants to purchase shares of our common stock; provisions in the respective indentures governing the Notes and in the Loan and Security Agreement delaying or preventing an otherwise beneficial takeover of us; and any adverse impact on our reported financial condition and results from the accounting methods for the Notes; our ability to remediate the existing material weaknesses in our internal control over financial reporting and maintain effective internal control over financial reporting and disclosure controls and procedures; risks and uncertainties related to failures to maintain effective internal control over financial reporting, and related to the identification of errors in our previously issued financial statements, such as those disclosed and corrected in this release, and a potential need to restate financial statements in such instances; market price fluctuations in the price of our common stock, whether due to dilution, adverse business or financial performance or the perception of such adverse performance, failure to meet the Nasdaq continued listing requirement for minimum bid price or other Nasdaq listing requirements and the potential delisting of our common stock, or market and trading dynamics unrelated to our underlying business, operating and financial performance or prospects or macro or industry fundamentals which may not coincide in timing with the disclosure of news or developments by or affecting us, could cause the market price of our common stock to fluctuate dramatically or decline rapidly, regardless of any developments in our business or financial results; the impact of general economic conditions in the U.S. and international markets on us, our customers, our suppliers, our vendors and consumers, including concerns related to inflation, geopolitical and economic uncertainty and instability, a potential recession, the shutdown of the federal government including regulatory agencies, tariffs and trade wars, and the effects of those conditions on consumer spending; the impact of adverse and uncertain political conditions in the U.S. and international markets, such as greater restrictions on free trade through significant increases in tariffs on raw materials, ingredients, finished goods and other products and supplies imported into the United States and increased uncertainty surrounding international trade policy and regulations, trade wars, including through the implementation of retaliatory tariffs or related counter-measures, and the negative effects of anti-American sentiment, the conflict in the Middle East (including with Iran), as well as the impact of inflation and high interest rates on consumer behavior, including higher food, grocery, raw materials, transportation, energy, labor and fuel costs; risks and uncertainties related to identifying and executing our current and future cost-reduction initiatives, cost structure improvements, workforce reductions, executive leadership changes and other organizational changes, including realignment of reporting structures, and the timing and success of continuing to reduce operating expenses and achieving our profitability, cash flow and financial performance objectives; our ability to streamline operations and improve cost efficiencies, which could result in the contraction of our business and the continued implementation of significant cost cutting measures such as further downsizing, consolidating or exiting certain operations, including product lines, domestically and/or abroad; the timing and success of narrowing our commercial focus to certain anticipated growth opportunities; accelerating activities that prioritize gross margin expansion and cash generation, including as part of our review of our global operations initiated in 2023 (“Global Operations Review”); changes to our pricing architecture; cash-accretive inventory reduction initiatives; and further cost-reduction initiatives; our ability to successfully execute our Global Operations Review and any resulting strategic plans, including the exit or discontinuation of select product lines; the impact of non-cash charges such as provision for excess and obsolete inventory and potential additional impairment charges, write-offs, disposals and accelerated depreciation of fixed assets, and losses on sale and write-down of fixed assets and assets held for sale; further optimization of our manufacturing capacity and real estate footprint; workforce reductions; and the cessation of our operational activities in China in 2025; our ability to successfully execute the Transformation Office initiatives including, among other things, positioning the business for a more fundamental resizing of operating expenses, driving margin recovery, including through targeted investments in our facilities and supply chain cost reductions, reducing inventory and associated carrying costs through SKU rationalization and the discontinuation of certain product lines, and preserving cash and monetizing non-strategic or idle assets; our ability to meet our obligations under leases for our corporate offices, manufacturing facilities and warehouses, including matters relating to our Campus Headquarters including, without limitation, the ability to meet our obligations under our Campus Headquarters lease, as amended from time to time (the “Campus Lease”), the impact of workforce reductions or other cost-reduction initiatives on our space demands, the impact of the surrender of a portion of the existing premises, the impact of the sublease of a portion of the existing premises, other efforts to develop, repurpose or consolidate our use of our leased premises, and the timing and success of surrendering, subleasing, assigning or otherwise transferring, developing or repurposing the remaining used or excess leased space or negotiating additional partial lease terminations and/or subleases or other dispositions of our Campus Headquarters on terms advantageous to us or at all, including any additional impairment charges that may result, the amount of which could be material to our consolidated financial statements; reduced consumer confidence and changes in consumer spending, including spending to purchase our products, and negative trends in consumer purchasing patterns due to levels of consumers’ disposable income, credit availability and debt levels, and economic conditions, including due to potential recessionary and inflationary pressures, and geopolitical instability and wars; our inability to properly manage and ultimately sell our inventory in a timely manner, which has in the past and could in the future require us to sell our products through liquidation channels at lower prices, write-down or write-off excess or obsolete inventory, or increase inventory provision; ongoing and persistent declines in demand in the plant-based meat category and for our products, or strategic decisions that result in changes to our product portfolio, including the potential discontinuation of certain product lines through initiatives stemming from our transformation office and program or other strategic measures, which may require us to write-down or write-off excess or obsolete inventories; impairment charges, including due to any future changes in estimates, judgments or assumptions, failure to achieve forecasted operating results, due to weakness in the economic environment, demand for our products or other factors, changes in market conditions and declines in our publicly-quoted stock price and market capitalization, failure to sublease, assign or otherwise transfer any excess space or negotiate additional partial lease terminations and/or subleases or other dispositions of our Campus Headquarters or other facilities on terms advantageous to us or at all, and the cessation of our operational activities in China in 2025; our ability to accurately predict consumer taste preferences, trends and demand and successfully innovate, introduce and commercialize new products, including in new geographic markets; the effects of competitive activity from our market competitors, including through consolidation in the plant-based food industry or vertical consolidation of diversified food businesses with existing plant-based food businesses, and new market entrants, which may include companies with substantially greater financial resources than us; our ability to protect our brand against misinformation about our products and the plant-based meat category, real or perceived quality or health issues with our products, marketing campaigns aimed at generating negative publicity regarding our products and the plant-based meat category, including regarding the nutritional value of our products, and other issues that could adversely affect our brand and reputation; disruption to, and the impact of uncertainty in, our domestic and international supply chain, including labor shortages and disruption, shipping delays and disruption, the impact of tariffs on raw materials, ingredients, finished goods and other products and supplies imported into the U.S., and the impact of cyber incidents at suppliers and vendors; the impact of uncertainty as a result of doing business internationally, including as a result of the cessation of our operational activities in China in 2025; the volatility of or inability to access the capital markets, including due to macroeconomic factors, geopolitical tensions, trade policy uncertainty (including tariffs and retaliatory trade measures), or the outbreak or escalation of hostilities or war—for example, the ongoing war between Russia and Ukraine and the conflict in the Middle East (including with Iran), and their impacts on the surrounding areas and global economy; changes in the foodservice landscape, including the timing, success and level of marketing and other financial incentives to assist in the promotion of our products, our ability to maintain and grow market share and attract and retain new foodservice customers or retain existing foodservice customers, and our ability to introduce and sustain offering of our products on menus; the timing and success of distribution expansion and new product introductions, including the success of our DTC channel, and the timing and success of planned new products or recently launched products in increasing revenues and market share, including the success of our distribution partnership with Big Geyser for Beyond Immerse; our ability to differentiate and continuously create innovative products, respond to competitive innovation and achieve speed-to-market, including the timing and success of planned new products or recently launched products; the timing and success of strategic Quick Service Restaurant (“QSR”) partnership launches and limited time offerings resulting in permanent menu items and our ability to attract and retain QSR and other strategic customers; the outcomes of, and costs related to, legal or administrative proceedings, including any settlements, appeals from initial decisions or other developments in such proceedings, or new legal or administrative proceedings filed against us; foreign currency exchange rate fluctuations; the effectiveness of our business systems and processes; our estimates of the size of our market opportunities and ability to accurately forecast market conditions; our ability to effectively optimize our manufacturing and production capacity, and real estate footprint, including consolidating manufacturing facilities and production lines, exiting co-manufacturing arrangements or entering into new arrangements under terms that are ultimately beneficial to us and effectively managing capacity for specific products with shifts in demand; risks associated with underutilization of capacity which have in the past and could in the future give rise to increased cost of goods sold per pound, underutilization fees, termination fees and other costs to exit certain supply chain arrangements and product lines, and/or the write-down or write-off of certain equipment and other fixed assets and impairment charges, all of which could negatively impact gross margin, driving less leverage on fixed costs and delaying the speed at which cost savings initiatives positively impact our financial results; our ability to accurately forecast our future results of operations and financial goals or targets, including as a result of fluctuations in demand for our products and in the plant-based meat category generally, increased competition, the impact and success of launching new products and new channels, and the impact of broader macroeconomic conditions and market uncertainty; our ability to accurately forecast demand for our products and manage our inventory, including the impact of customer orders ahead of holidays and the timing of customer promotions, shelf reset activities, and price increases as a result of tariffs or otherwise; customer and distributor changes and buying patterns, such as reductions in targeted inventory levels; and supply chain and labor disruptions, including due to the impact of cyber incidents at suppliers and vendors; our operational effectiveness and ability to fulfill orders in full and on time; variations in product selling prices and costs, the timing and success of changes to our pricing architecture, our ability to pass on price increases in full or at all, including due to the impact of tariffs and macroeconomic conditions, and the mix of products sold; our ability to successfully enter new geographic markets, manage our international business and comply with any applicable laws and regulations, including risks associated with doing business in foreign countries, and our ability to comply with the U.S. Foreign Corrupt Practices Act or other anti-corruption laws; the effects of global outbreaks of pandemics, epidemics or other public health crises, or fear of such crises; our ability to attract, maintain and effectively expand our relationships with key strategic foodservice partners; our ability to attract and retain our suppliers, distributors, vendors, co-manufacturers and customers; our ability to procure sufficient high-quality raw materials at competitive prices to manufacture our products; the availability of pea and other proteins and avocado oil that meet our standards; our ability to diversify the protein sources and avocado oil sources used for our products; our ability to successfully execute our strategic initiatives; the volatility associated with ingredient, packaging, transportation and other input costs, including due to the impact of tariffs and rising energy and fuel costs; our ability to keep pace with technological changes impacting the development of our products and implementation of our business needs; significant disruption in, or breach in security of our or our suppliers’ or vendors’ information technology systems, including any inability to detect or timely report any cybersecurity incidents, and resultant interruptions in service and any related impact on our reputation, including data privacy, and any potential impact on our supply chain, including on customer demand, order fulfillment and lost sales, and the resulting timing and/or amount of net revenues recognized; the ability of our transportation providers to ship and deliver our products in a timely and cost-effective manner; senior management and key personnel changes, the attraction, training and retention of qualified employees and key personnel, and our ability to maintain our company culture; risks related to use of a professional employer organization to administer human resources, payroll and employee benefits functions for certain of our international employees, and use of certain third party service providers for the performance of several business operations including payroll, human capital, supply chain optimization, financial reporting and accounting, and certain other management services; the impact of potential workplace hazards; the effects of natural or man-made catastrophic or severe weather events, including events brought on by climate change, particularly involving our or any of our co-manufacturers’ manufacturing facilities, our suppliers’ facilities or any other vital aspects of our supply chain; accounting estimates based on judgment and assumptions that may differ from actual results; changes in laws and government regulation, and their enforcement, affecting our business, including the U.S. Food and Drug Administration (“FDA”) and the U.S. Federal Trade Commission governmental regulation, and state, local and foreign regulation; new or pending legislation, or changes in laws, regulations or policies of governmental agencies or regulators, both in the U.S. and abroad, affecting plant-based meat, the labeling, packaging or naming of our products, including requirements regarding nutrient content claims, our brand name or logo, or the definition of “ultraprocessed” foods or ingredients; the failure of acquisitions and other investments to be efficiently integrated and produce the results we anticipate; risks inherent in investment in real estate; adverse developments affecting the financial services industry, including the potential failure of financial institutions with which we have deposits or other business relationships; the financial condition of, and our relationships with our suppliers, vendors, co-manufacturers, distributors, retailers and foodservice customers, and their future decisions regarding their relationships with us; our ability and the ability of our suppliers, vendors and co-manufacturers to comply with food safety, environmental or other laws or regulations and the impact of any non-compliance on our operations, brand reputation and ability to fulfill orders in full and on time; seasonality, including increased levels of grilling activity and higher levels of purchasing by customers ahead of holidays, customer shelf reset activity and the timing of product restocking by our retail customers; the impact of increased scrutiny from a variety of stakeholders, institutional investors and governmental bodies on environmental, social and governance (“ESG”) practices; our suppliers’ and our co-manufacturers’ ability to protect our proprietary technology, intellectual property and trade secrets adequately; the impact of changes in tax laws; and the risks discussed in Part I, Item 1A, Risk Factors, included in our Annual Report on Form 10-K for the fiscal year ended December 31, 2025 filed with the Securities and Exchange Commission (the “SEC”) on April 9, 2026, the Company’s Quarterly Report on Form 10-Q for the fiscal quarter ended June 27, 2026 to be filed with the SEC, and those discussed in other documents we file from time to time with the SEC. All forward-looking statements attributable to us or persons acting on our behalf are expressly qualified in their entirety by the cautionary statements set forth above. Such forward-looking statements are made only as of the date of this release. Beyond Meat undertakes no obligation to publicly update or revise any forward-looking statement because of new information, future events, changes in assumptions or otherwise, except to the extent required by applicable laws. If the Company does update one or more forward-looking statements, no inference should be made that it will make additional updates with respect to those or other forward-looking statements.
Non-GAAP Financial Measures
The Company refers to certain financial measures that are not recognized under U.S. generally accepted accounting principles (GAAP) in this press release, including: Adjusted loss from operations, Adjusted operating margin, Adjusted net loss, Adjusted net loss per diluted common share, Adjusted EBITDA and Adjusted EBITDA as a % of net revenues. See “Non-GAAP Financial Measures” below for additional information and reconciliations of such non-GAAP financial measures.
Availability of Information on Beyond Meat’s Website and Social Media Channels
Investors and others should note that Beyond Meat routinely announces material information to investors and the marketplace using SEC filings, press releases, public conference calls, webcasts and the Beyond Meat Investor Relations website. The Company also intends to use certain social media channels as a means of disclosing information about it and its products to consumers, and its customers, investors and the public (e.g., @BeyondMeat on Facebook, Instagram, Threads and LinkedIn. The information posted on social media channels is not incorporated by reference in this press release or in any other report or document we file with the SEC. While not all of the information that the Company posts to the Beyond Meat Investor Relations website or to social media accounts is of a material nature, some information could be deemed to be material. Accordingly, the Company encourages investors, the media and others interested in Beyond Meat to review the information that it shares at the “Investors” link located at the bottom of the Company’s webpage at https://investors.beyondmeat.com/investor-relations and to sign up for and regularly follow the Company’s social media accounts. Users may automatically receive email alerts and other information about the Company when enrolling an email address by visiting “Request Email Alerts” in the “Investors” section of Beyond Meat’s website at https://investors.beyondmeat.com/investor-relations.

 Austria (De)
 Canada (En)
 France (Fr)
 Germany (De)
 Netherlands (Du)
 Sweden (Se)
 United Kingdom (En)