Company About Us Our Origin Story Leadership Team Board of Directors Responsibility Giving Patients Patients Patient Support RARE Scholars Expanded Access Science & Medicine Our Science Medicines Pipeline Manufacturing Clinical Trials Publications…

Search
Search BioMarin
Back to News
Back to Stories
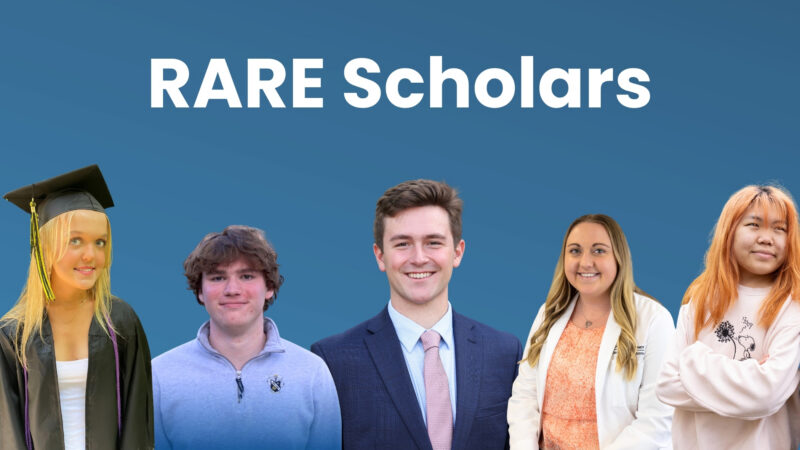
RARE Scholars Charting New Paths in Medicine, Advocacy, Leadership and Business
October 21, 2026
When Amanda Beedle’s daughters were diagnosed with CLN2 disease, an ultra-rare neurodegenerative condition that belongs to a group of disorders called Batten disease, her life changed in an instant.
“The day we received the diagnosis was the last traditional shift I ever worked,” recalls Amanda, who had spent the past 10 years in healthcare as a registered nurse.
That day marked a turning point for Amanda, who initially stopped working to focus on supporting the needs of two children living with a rare genetic condition that historically has led to premature death by early adolescence. Connecting with others in the rare disease community eventually drew her into advocacy and, more recently, back to school. She is currently working on a Master of Science in nursing research through an online program offered by Cleveland State University.
Amanda is part of the 2026-27 cohort of BioMarin’s RARE Scholars program, which since 2018 has provided financial support to U.S. college students living with rare genetic conditions, including achondroplasia, Batten disease, mucopolysaccharidosis (MPS) and phenylketonuria (PKU). In 2026, the program expanded to include caregivers, such as Amanda. Since its inception, RARE Scholars has awarded nearly $250,000 to more than 35 individuals who have demonstrated leadership in school and community activities.
Amanda has spent the past several years trying to balance medical appointments, school activities, family time and her work as a rare disease advocate. She says she never lost the connection to her work in healthcare and that influenced her decision to return to school.
“As I became immersed in the rare disease community, I realized there was an opportunity to use my clinical background and lived experience to help others,” she says. “Pursuing graduate school was a dream, but the realities of caring for a family affected by a rare disease made that dream uncertain. This scholarship helped provide an opportunity I might not otherwise have had.”

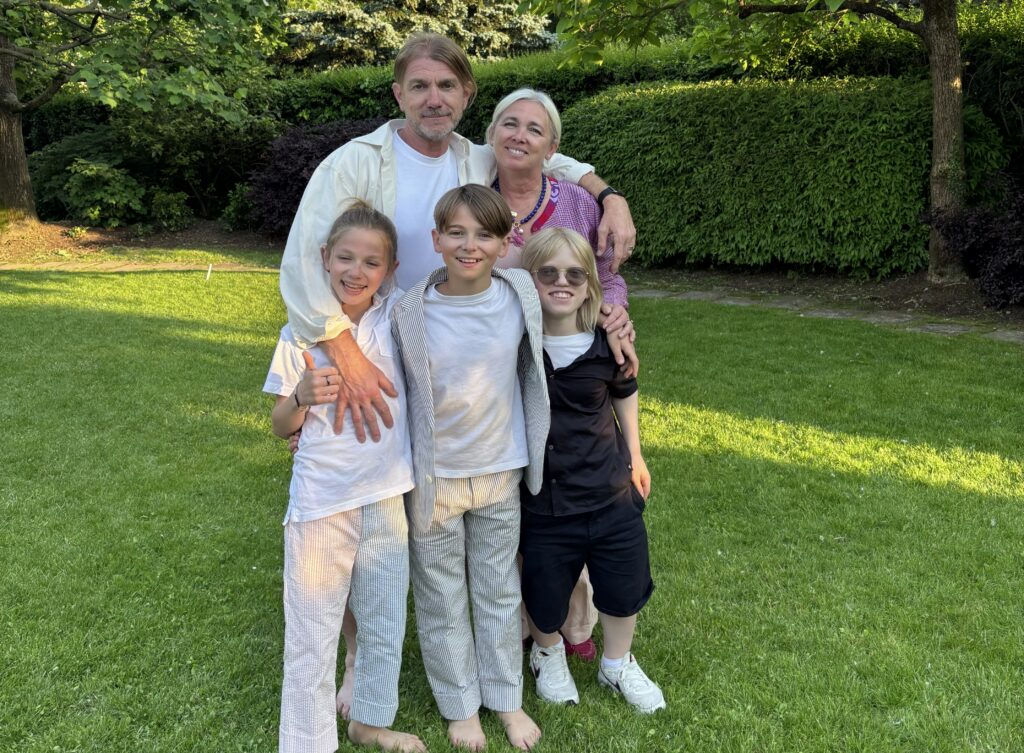
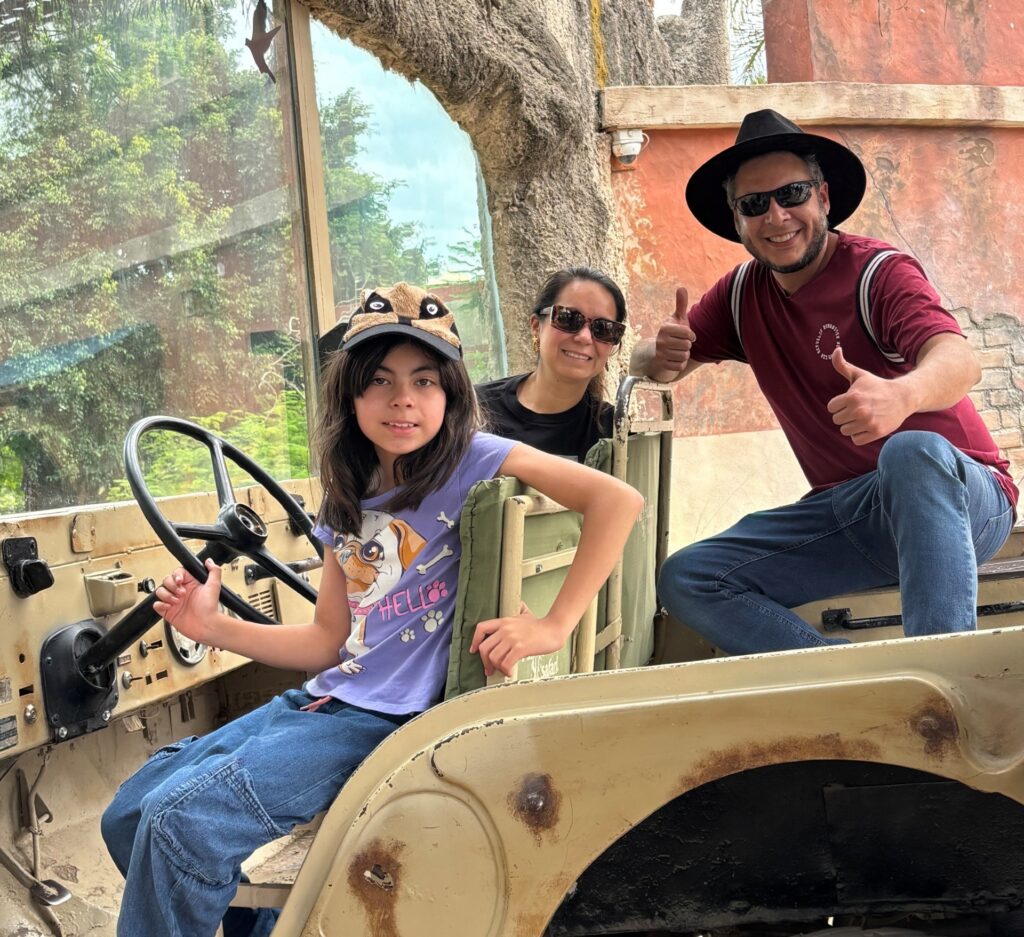
Amanda and her husband, Adam, with their daughters Annabelle (left) and Abigail.
Amanda is the first student in her program to center research on rare diseases. She hopes to build on the skills she already has and apply them in ways that improve care coordination, support families and create meaningful change for underserved populations.
“I’m eager to partner with my local county health department,” she says. “I hope to help families navigate new genetic diagnoses and connect them with resources, while integrating that work into my graduate studies.”
Despite the demands of caregiving, graduate school and advocacy work, Amanda stays grounded in the reason behind it all.
“The joy of being Annabelle and Abigail’s mom introduced me to the realities of the rare disease community – both the challenges and the victories,” she says. “Through meeting so many extraordinary families, I saw a need and recognized that my background could help address it. That realization continues to motivate me every day.”
Peter Gray: Dreaming of a Career in Professional Sports Management
For Peter Gray, earning his degree is the initial priority in building toward a lifelong goal.
“Ultimately, I’d love to become the general manager of a football team and help shape every aspect of an organization,” he says.
Peter recently moved from San Juan Capistrano, California to begin his first year at the University of Notre Dame, where he’s studying accounting at the school’s Mendoza College of Business.
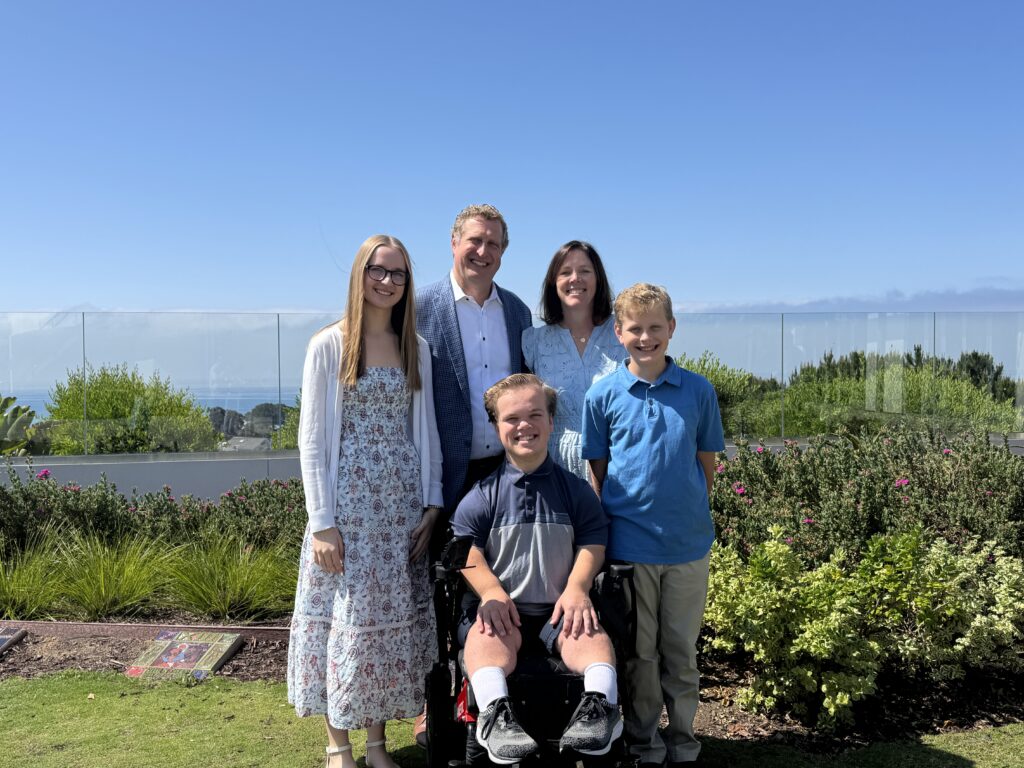
“I’m excited to focus on subjects that genuinely interest me and to explore them in greater depth,” he says. “College gives me the opportunity to learn more about the topics I enjoy, pursue meaningful opportunities and build a foundation for my future career.”
Peter is the only member of his family with achondroplasia, a rare genetic condition that affects bone growth.
“Having achondroplasia has taught me how to adapt and find solutions that work for me while still living a full and active life,” he says. “I’ve learned to make adjustments when necessary, but I’ve never viewed those adjustments as barriers.”
He credits his family for helping shape that mindset.
“They’ve always encouraged me to work hard, push myself academically and strive for my goals,” Peter says. “At the same time, they’ve been a constant source of support whenever I’ve faced challenges.”
Looking to the future, Peter sees no limits to where his education and drive can take him.
“My dream is to work on the financial side of a professional sports franchise. It’s a way to combine the two things I’m most passionate about – sports and business.”
Paige Kaczrowski: Pursuing Impact in Rural Family Medicine
Living with phenylketonuria (PKU) has shaped Paige Kaczrowski’s journey in profound ways – so much so that it’s led her to pursue a career in medicine.
PKU is a rare metabolic condition that limits the body’s ability to break down an amino acid found in protein. From an early age, Paige learned to manage her condition by adhering to a strict low-protein diet and incorporating medical formula into her daily routine, an experience that sparked her fascination with science and inspired career direction.
“A lot of my interest in medicine started with having PKU,” says Paige, who is a two-time RARE Scholars recipient. “I spent a lot of time with doctors, dietitians and other healthcare professionals. As I got older and learned more about the science behind PKU, my curiosity just kept growing.”
Paige is a medical student at the University of Minnesota Medical School’s Duluth campus, on track to graduate in 2029. Her goal is to become a family physician in a rural community.
“I grew up in Two Harbors, which is a smaller town in Minnesota, and I’ve always appreciated that sense of community,” she says. “What really appeals to me about rural medicine is the variety. You might work in a clinic one day, the emergency room the next. I love the idea of being able to do a little bit of everything while making a meaningful impact.”
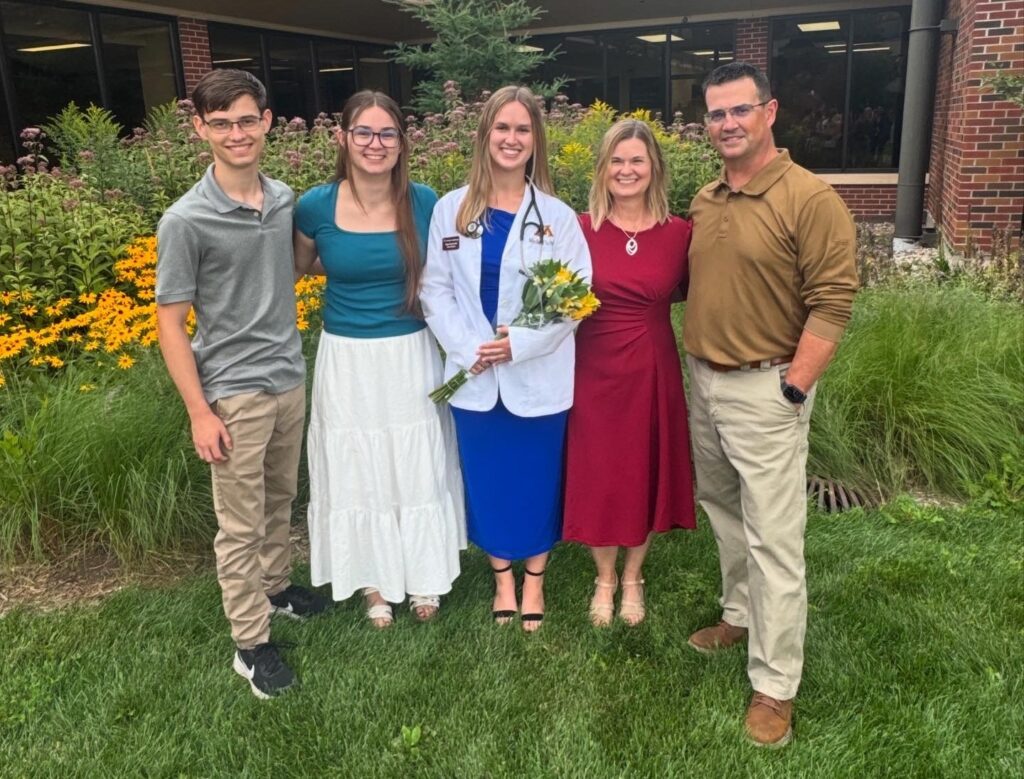
Receiving the RARE Scholars award for a second time provides important support as she pursues those dreams.
“Medical school is a significant financial commitment, so every bit of help matters,” Paige says. “The scholarship is meaningful not only because of the financial assistance, but because it feels like recognition from a community that understands what living with a rare disease is like.”
Looking to the future, Paige hopes to combine her personal experience with professional expertise to make healthcare more compassionate and accessible.
“I hope that experience helps me connect with my future patients and advocate for them in ways that truly make a difference,” she says.
Sarah Cook: Creating Moments That Matter
This summer, Sarah Cook found herself standing on the pitch at FIFA World Cup match, carrying the U.S. flag before the game against Türkiye.
“It was a moment of pride I’ll never forget,” she says about one highlight in a year filled with new opportunities.
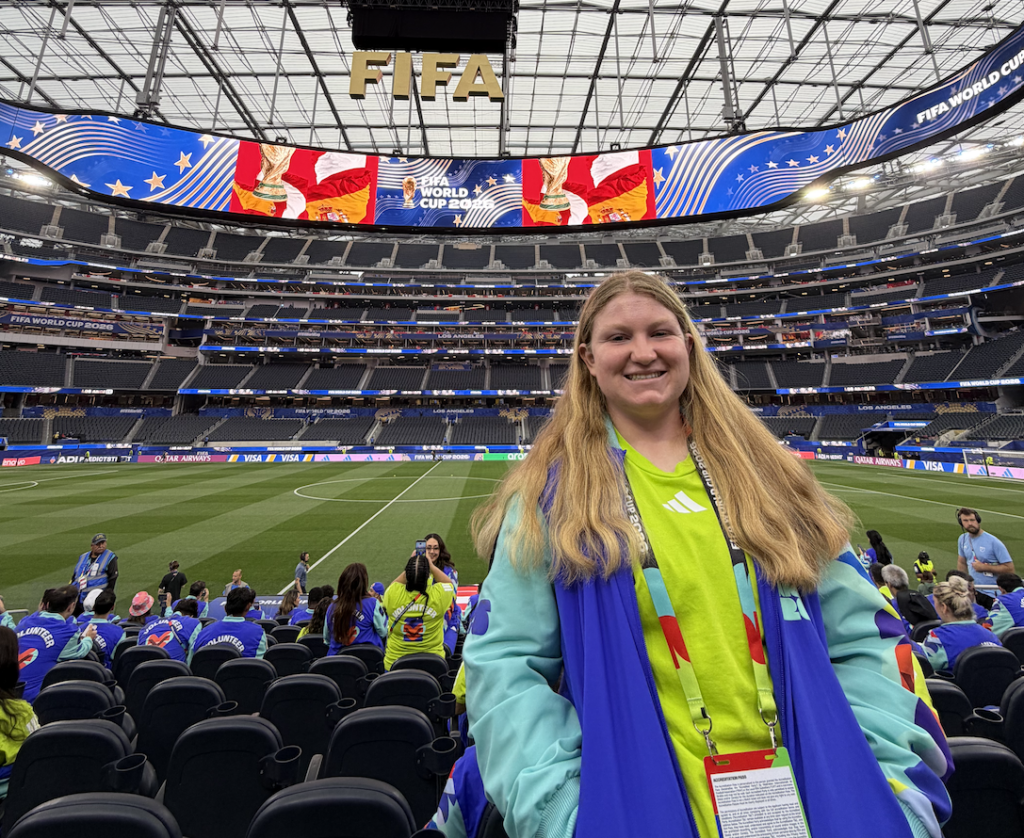
Now entering her senior year at San Diego State University (SDSU), Sarah balances academics with leadership roles and meaningful work. She’s pursuing a double degree in communications and leadership studies. She’s applying her leadership in extracurriculars, including reviving the SDSU Leadership Club, a group that began during her sophomore year that creates space for students to explore their potential. One of her proudest achievements thus far has been leading a student-funded service trip to Puerto Rico, where her team plans to spend spring break of 2027 serving the community and building connections beyond the classroom.
Sarah’s summer also included an internship with Make-A-Wish San Diego and volunteer work at the World Cup. These experiences deepened her interest in roles that blend purpose, logistics and people. Combined with her part-time work for San Diego FC – a recent expansion team in Major League Soccer – these opportunities reflect her drive to pursue work that makes an impact.
That open-minded approach matches Sarah’s outlook on living with MPS Type I, a rare progressive genetic condition that causes complex sugars to build up in the body and can lead to complications affecting multiple organs.
“People don’t often ask about my genetic condition, but I’ve learned that everyone faces challenges,” she says. “Life is still incredibly good. I focus less on limitations and more on what I might miss if I let fear hold me back.”
Looking ahead, Sarah is excited to explore what comes after graduation – roles that may even intersect with major events such as the 2028 Summer Olympics in Los Angeles. Wherever her path leads, she hopes to continue creating spaces where others feel connected and empowered.
Bryce Pinter: Embracing New Opportunities
Growing up in Lenexa, Kansas, Bryce Pinter learned early that perseverance pays off.
“My family taught me to keep pushing through to the end goals even when it seems hard or impossible,” he says.
That determination shows up in his favorite pastimes – golf and fishing.
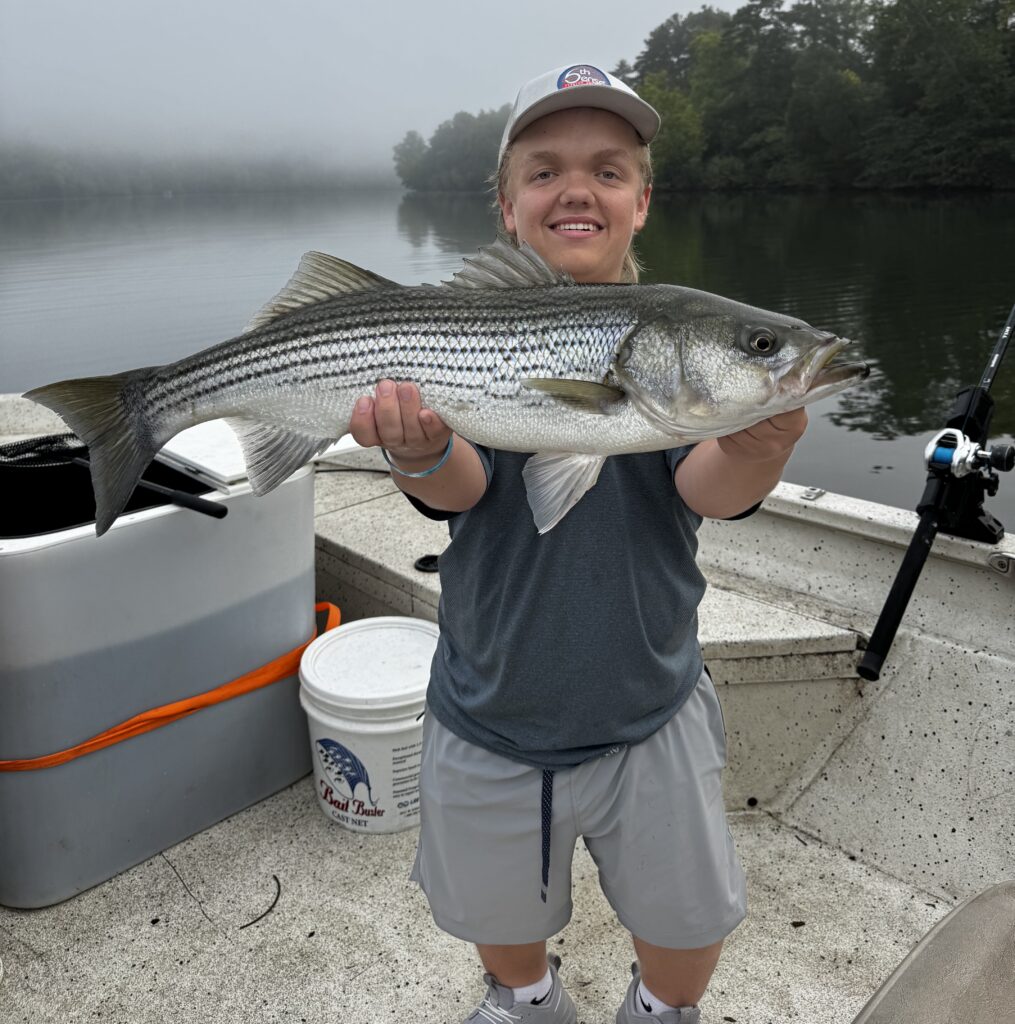
“Fishing takes a lot of patience. Just because you go doesn’t mean you’ll catch a fish, but when you do, there’s nothing better,” he says. “Golf is all about perseverance – thousands of balls and hours of practice to improve.”
A numbers-driven thinker, Bryce is studying finance at Iowa State University and hopes to turn his love for sports into a career.
“I’ve always had a passion for sports and while playing at the professional level wasn’t an option, I fell in love with the idea of working on the management side,” says Bryce, whose ultimate dream is to become a general manager for a National Basketball Association franchise.
Bryce knows living with achondroplasia will bring unique experiences to navigate in college – something he’s already thought through.
“My step length is shorter, so walking between classes will take extra time and effort,” he says. “Staying active has been important.”
Still, he’s focused on making the most of his first year by meeting new people and building a strong academic foundation. His advice to younger students with rare conditions:
“Try it. Not giving it a go would be a bigger regret than trying and having a tough experience,” Bryce says.
So far, Bryce is happy he took on the challenge of moving away to school.
“The school year is going great so far,” he says. “Ames, Iowa is a great place with great people.”
Addi Hazel: Finding Her Own Path
For Addi Hazel, the move from Kansas to Texas was more than a change of scenery – it was a chance to step into new opportunities and embrace independence. After growing up in a tight-knit community, she’s now building a new one at Texas Tech University, bringing with her the same spirit of connection that shaped her early years.
Addi lets her love for people and passion for leadership shine through, whether she’s organizing church events, mentoring younger students or joining an intramural volleyball team. That same drive led her to pursue a degree in business management, blending an interest in event planning with a desire to help people feel seen and included.
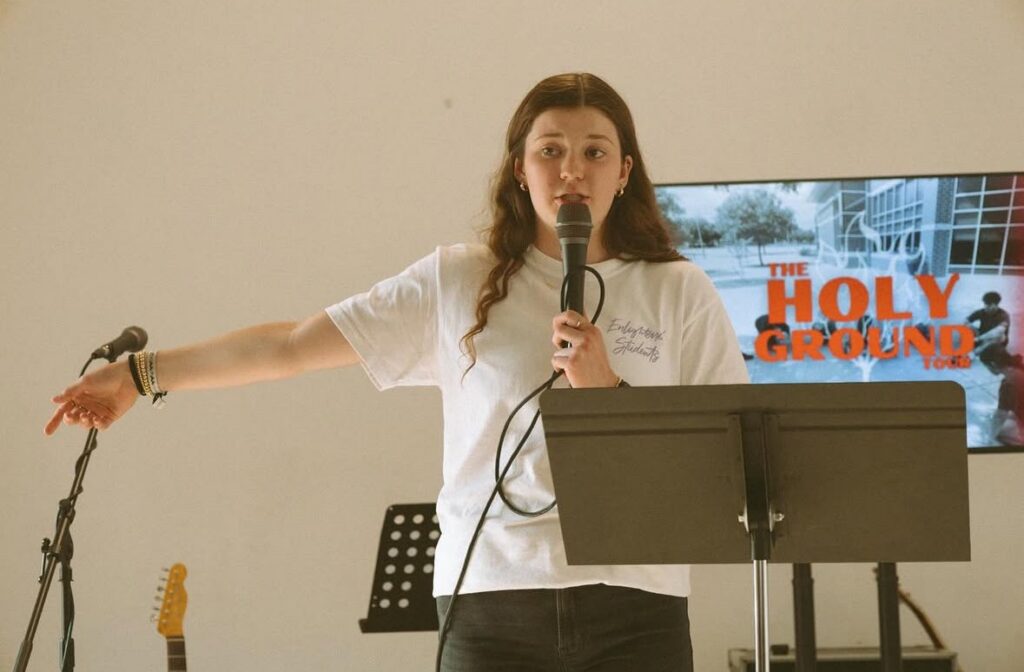
“Events have the power to bring people together,” she says.
Although college brings big changes, Addi approaches it with confidence and resilience – qualities shaped in part by living with PKU. Managing a rare condition has taught her perspective, empathy and the importance of curiosity. She welcomes questions about PKU, seeing them as opportunities to foster understanding. And thanks to years of preparation, she feels ready to navigate the transition on her own.
Looking ahead, Addi is embracing whatever the future may hold.
“Rather than worrying about what comes next, I try to stay present, make the most of today and trust the journey ahead,” she says.
Learn more about the RARE Scholars program
, including how to apply. Students who wish to be considered for the 2027-28 academic year can submit applications beginning March 1, 2027. In addition to the conditions referenced in this article, people living with Pompe disease and Fabry disease, and their caregivers, will be eligible to apply next year.
Related Stories
October 14, 2025

March 18, 2025

September 25, 2024
You’re leaving the BioMarin website.
Links to sites outside of this website are provided as a resource to the viewer. BioMarin accepts no responsibility for the content of linked sites.
Leave this website
Close
Enter your DIN number
Please locate the 8-digit DIN number found on your product package or educational materials and enter it in the form below to access important safety information.
DIN number
Contact
Legal
© 2026 BioMarin. All rights reserved.

 View original content to download multimedia:

 View original content to download multimedia:



 View original content to download multimedia:









 View original content to download multimedia:


 View original content to download multimedia:


 View original content to download multimedia: