May 6, 2026 Download (opens in new window) First Quarter 2026 Overview (all comparisons are made to the corresponding prior year first quarter unless otherwise specified): Net sales of $396.3 million Net income of $1.3 million**; Adjusted net…
May 6, 2026
First Quarter 2026 Overview (all comparisons are made to the corresponding prior year first quarter unless otherwise specified):
- Net sales of $396.3 million
- Net income of $1.3 million**; Adjusted net income of** $12.5 million
- EBITDA of $23.6 million**; Adjusted EBITDA of** $30.3 million
- Diluted EPS of $0.06; Adjusted EPS of $0.54
- Operating cash flow of $40.7 million**; Free cash flow of** $32.6 million
- Backlog of $549.2 million grew 36.4%
CHATTANOOGA, Tenn., May 06, 2026 (GLOBE NEWSWIRE) -- Astec Industries, Inc. (Nasdaq: ASTE) announced today its financial results for the first quarter ended March 31, 2026.
"A 70.6% increase in Materials Solutions net sales was primarily driven by organic and inorganic contributions. Infrastructure Solutions net sales were relatively flat after the inclusion of inorganic sales which offset timing and mix-related shortfalls in our legacy business." said Jaco van der Merwe, Chief Executive Officer. "We are optimistic about the remainder of 2026 due to favorable order activity and strong end markets. As such, we are maintaining our full year 2026 adjusted EBITDA guidance in the $170 million to $190 million range."
Brian Harris, Chief Financial Officer, commented, "First quarter profitability was impacted by timing and mix in legacy Infrastructure Solutions net sales and expenses associated with the ConExpo trade show held once every three years. Freight, duty, and tariffs were also a headwind to margin. We finished the quarter with leverage of 2.3x, which is within our target leverage range of 1.5x to 2.5x. We are well-positioned for additional organic and inorganic growth."
|
|
|
|
|
|
|
|
|
|
|
|
|
|
|
|
|
|
|
|
|
GAAP |
|
|
|
|
|
|
|
|
|
|
Adjusted |
|
|
|
|
|
|
|
| (in millions, except per share and percentage data) |
1Q 2026 |
|
|
|
1Q 2025 |
|
|
|
Change |
|
|
1Q 2026 |
|
|
1Q 2025 |
|
|
Change |
|
| Net sales |
$ |
396.3 |
|
|
$ |
329.4 |
|
|
20.3 |
% |
|
|
|
|
|
|
|
|
|
| Infrastructure Solutions |
|
237.0 |
|
|
|
236.0 |
|
|
0.4 |
% |
|
|
|
|
|
|
|
|
|
| Material Solutions |
|
159.3 |
|
|
|
93.4 |
|
|
70.6 |
% |
|
|
|
|
|
|
|
|
|
| Backlog |
|
549.2 |
|
|
|
402.6 |
|
|
36.4 |
% |
|
|
|
|
|
|
|
|
|
| Infrastructure Solutions |
|
312.6 |
|
|
|
276.4 |
|
|
13.1 |
% |
|
|
|
|
|
|
|
|
|
| Material Solutions |
|
236.6 |
|
|
|
126.2 |
|
|
87.5 |
% |
|
|
|
|
|
|
|
|
|
| Income from operations |
|
9.0 |
|
|
|
20.5 |
|
|
(56.1 |
)% |
|
23.6 |
|
|
29.0 |
|
|
(18.6 |
)% |
| Operating margin |
|
2.3 |
% |
|
|
6.2 |
% |
|
(390) bps |
|
|
6.0 |
% |
|
8.8 |
% |
|
(280) bps |
|
| Effective tax rate |
|
53.6 |
% |
|
|
27.4 |
% |
|
2,620 bps |
|
|
28.2 |
% |
|
25.9 |
% |
|
230 bps |
|
| Net income attributable to controlling interest |
|
1.3 |
|
|
|
14.3 |
|
|
(90.9 |
)% |
|
12.5 |
|
|
20.9 |
|
|
(40.2 |
)% |
| Diluted EPS |
|
0.06 |
|
|
|
0.62 |
|
|
(90.3 |
)% |
|
0.54 |
|
|
0.91 |
|
|
(40.7 |
)% |
| EBITDA (a non-GAAP measure) |
|
23.6 |
|
|
|
27.5 |
|
|
(14.2 |
)% |
|
30.3 |
|
|
35.2 |
|
|
(13.9 |
)% |
| EBITDA margin (a non-GAAP measure) |
|
6.0 |
% |
|
|
8.3 |
% |
|
(230) bps |
|
|
7.6 |
% |
|
10.7 |
% |
|
(310) bps |
|
|
|
|
|
|
|
|
|
|
|
|
|
|
|
|
|
|
|
|
|
Segments Results
Our reportable segments are comprised of sites based upon the nature of the products or services produced, the type of customer for the products, the similarity of economic characteristics, the manner in which management reviews results and the nature of the production process, among other considerations.
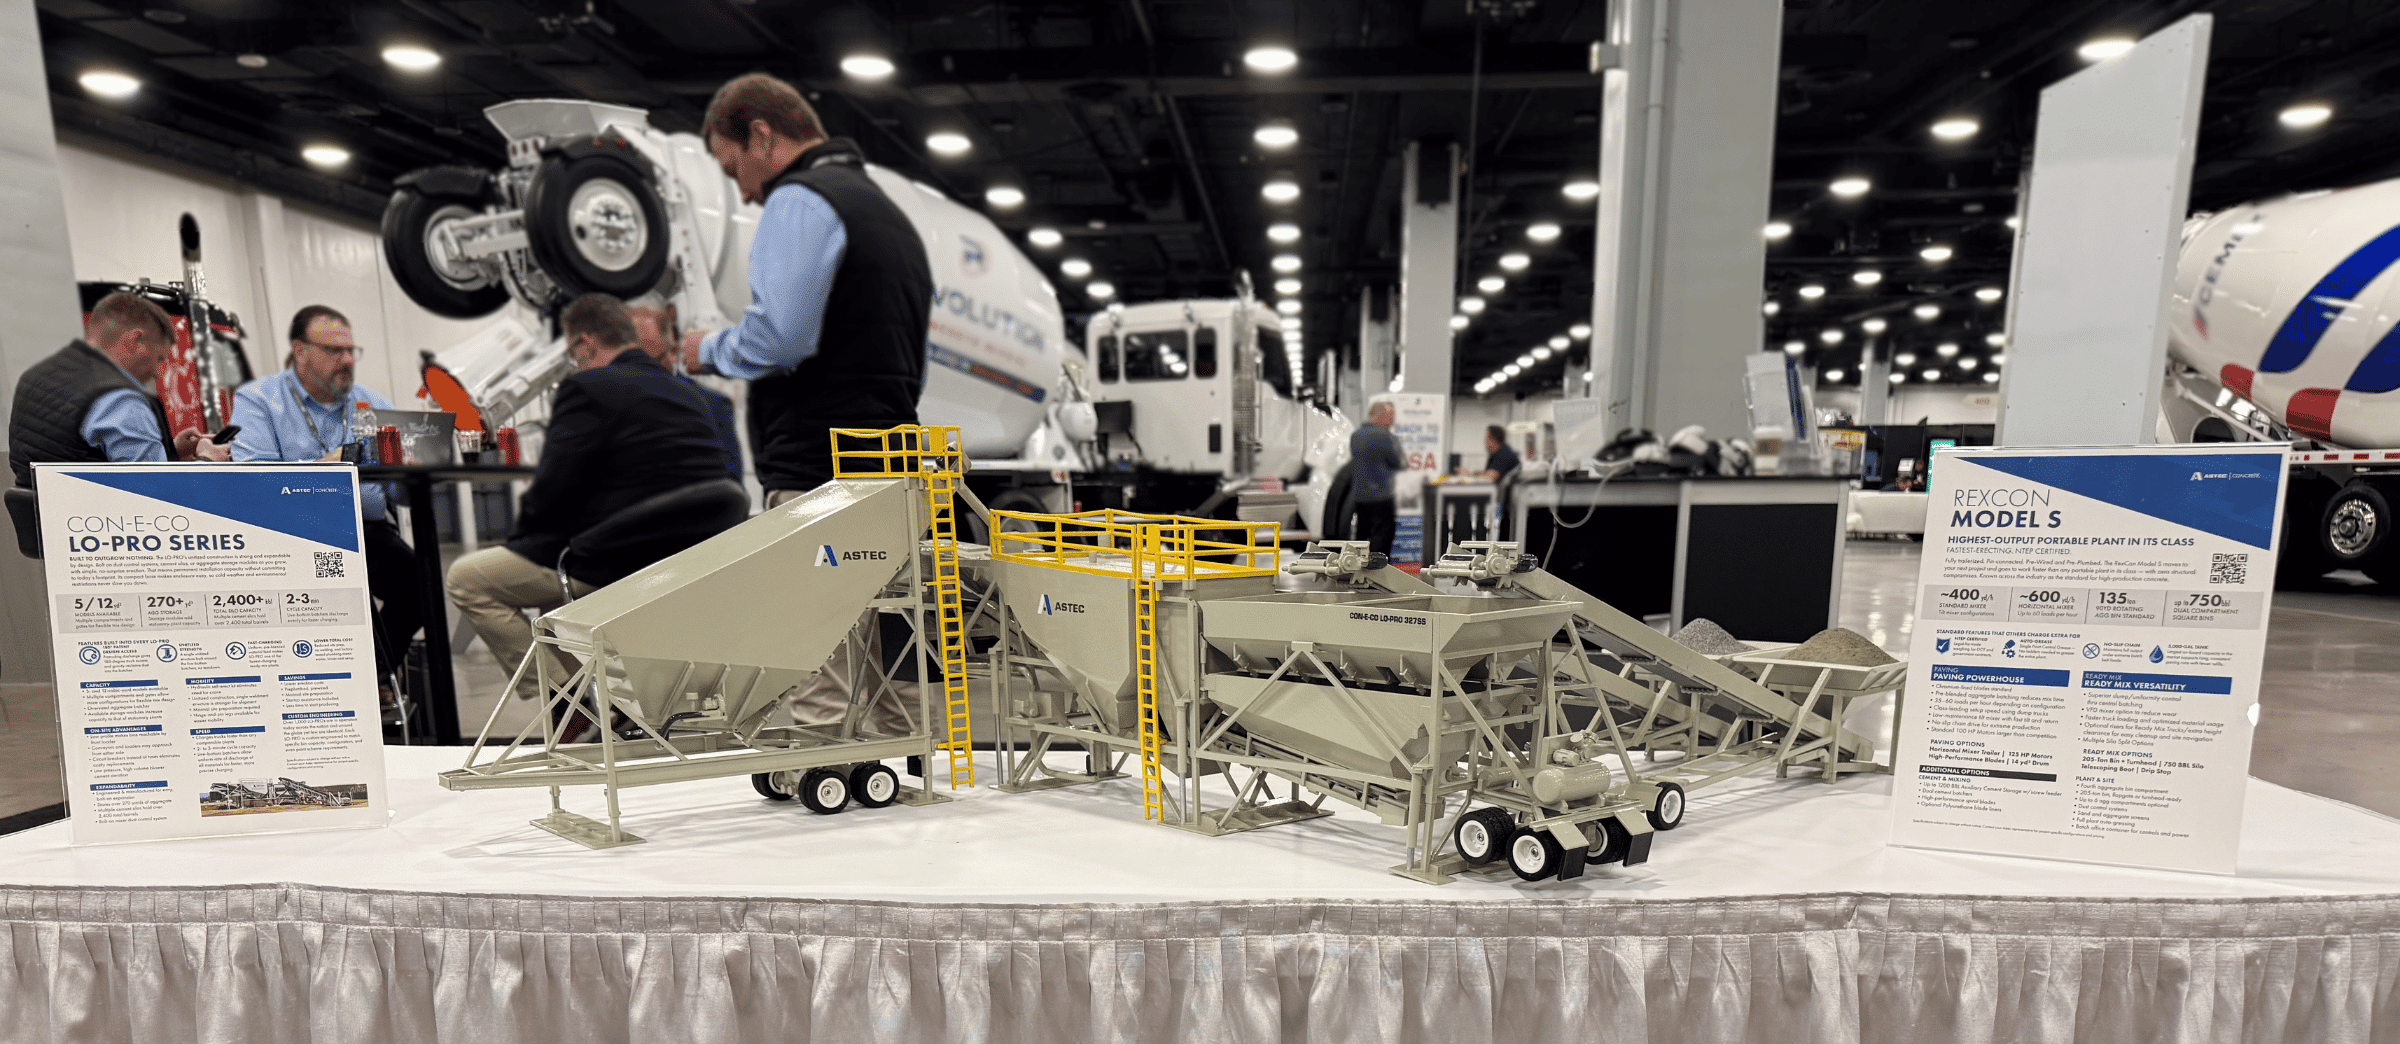
Infrastructure Solutions - Design, engineer, manufacture and market a complete line of asphalt plants, concrete plants and their related components and ancillary equipment, including industrial automation controls and telematics platforms, as well as supply asphalt road construction equipment, industrial thermal systems, land clearing, recycling and other heavy equipment, along with aftermarket parts.
- Net sales of $237.0 million increased 0.4% compared to a strong quarter the prior year. Our acquired business performed in line with expectations and offset the impact of timing in legacy net sales. Organic backlog increased slightly and remained at a healthy level. The book to bill ratio was 101%.
- Segment Operating Adjusted EBITDA of $34.8 million decreased 18.9% and Segment Operating Adjusted EBITDA margin of 14.7% decreased 350 basis points compared to a strong first quarter the prior year.
Materials Solutions - Design and manufacture hard and soft rock processing equipment, in addition to servicing and supplying parts for the aggregate, civil construction, energy, mining, hydro-electric, recycling, ports and bulk material handling markets.
- Net sales of $159.3 million increased by 70.6% due to organic growth and inorganic contributions. Implied orders declined 14.9% sequentially from a strong fourth quarter in 2025. The book to bill ratio stood at 110%.
- Segment Operating Adjusted EBITDA of $8.9 million increased 71.2% and Segment Operating Adjusted EBITDA margin was 5.6% for both the first quarters of 2026 and 2025.
Liquidity and Cash Flow
- Our total liquidity was $267.5 million, consisting of $73.4 million of cash and cash equivalents available for operating purposes and $194.1 million available for additional borrowings under our revolving credit facility.
- Operating Cash Flow in the quarter was $40.7 million and Free Cash Flow in the quarter was $32.6 million.
First Quarter Capital Allocation
- Capital expenditures of $8.1 million.
- Dividend payment of $0.13 per share.
Investor Conference Call and Webcast
Astec will conduct a conference call and live webcast today, May 6, 2026, at 8:30 A.M. Eastern Time, to review its first quarter 2026 financial results.
To access the call, dial (800) 715-9871 on Wednesday, May 6, 2026, at least 10 minutes prior to the scheduled time for the call. International callers should dial +1 (646) 307-1963.
You may also access a live webcast of the call at: https://events.q4inc.com/attendee/207358450
You will need to give your name and company affiliation and reference Astec. An archived webcast will be available for ninety days at www.astecindustries.com
.
A replay of the call can be accessed until May 20, 2026, by dialing (800) 770-2030, or +1(609) 800-9909 for international callers, Conference ID# 2593169. A transcript of the conference call will be made available under the Investor Relations section of the Astec Industries, Inc. website within 5 business days after the call.
About Astec
Astec, (www.astecindustries.com
), is a manufacturer of specialized equipment for asphalt road building, aggregate processing and concrete production. Astec's manufacturing operations are divided into two primary business segments: Infrastructure Solutions that includes road building, asphalt and concrete plants, thermal and storage solutions; and Materials Solutions that include our aggregate processing equipment. Astec also operates a line of controls and automation products designed to deliver enhanced productivity through improved equipment performance.
Safe Harbor Statements under the Private Securities Litigation Reform Act of 1995
This News Release contains forward-looking statements within the meaning of the Securities Act of 1933, as amended, the Securities Exchange Act of 1934, as amended, and the Private Securities Litigation Reform Act of 1995. Such statements relate to, among other things, income, earnings, cash flows, changes in operations, operating improvements, businesses in which we operate, the United States and global economies and guidance for fiscal 2026. Statements in this News Release that are not historical are hereby identified as "forward-looking statements" and may be indicated by words or phrases such as "anticipates," "supports," "plans," "projects," "expects," "believes," "should," "would," "could," "forecast," "management is of the opinion," use of the future tense and similar words or phrases. These forward-looking statements are based largely on management's expectations, which are subject to a number of known and unknown risks, uncertainties and other factors discussed and described in our most recent Annual Report on Form 10-K, including those risks described in Part I, Item 1A. Risk Factors thereof**,** and in other reports filed subsequently by us with the Securities and Exchange Commission, including those risks described in Part II, Item 1A in our most recent Quarterly Report on Form 10-Q, which may cause actual results, financial or otherwise, to be materially different from those anticipated, expressed or implied by the forward-looking statements. All forward-looking statements included in this document are based on information available to us on the date hereof, and we assume no obligation to update any such forward-looking statements to reflect future events or circumstances, except as required by law.
Non-GAAP Measures
In an effort to provide investors with additional information regarding the Company's results, the Company refers to various GAAP (U.S. generally accepted accounting principles) and non-GAAP financial measures which management believes provide useful information to investors. These non-GAAP measures have no standardized meaning prescribed by U.S. GAAP and therefore are unlikely to be comparable to the calculation of similar measures for other companies. Management of the Company does not intend these items to be considered in isolation or as a substitute for the related GAAP measures. Nonetheless, this non-GAAP information can be useful in understanding the Company's operating results and the performance of its core business. Management of the Company uses both GAAP and non-GAAP financial measures to establish internal budgets and targets to evaluate the Company's financial performance against such budgets and targets. A reconciliation of these non-GAAP measures to the most directly comparable GAAP measure is included in the tables.
When we provide guidance for adjusted EBITDA we do not provide a reconciliation of the U.S. GAAP measures as we are unable to predict with a reasonable degree of certainty the actual impact of the non-GAAP adjustment items. By their very nature, non-GAAP adjusted items are difficult to anticipate with precision because they are generally associated with unexpected and unplanned events that impact our Company and its financial results. Therefore, we are unable to provide a reconciliation of these measures without unreasonable efforts.
For Additional Information Contact:
Steve Anderson
Senior Vice President of Administration and Investor Relations
Phone: (423) 899-5898
E-mail: [email protected]
|
|
|
|
|
|
|
|
|
|
|
|
|
|
|
|
| Astec Industries Inc. Condensed Consolidated Statements of Operations (In millions, except shares in thousands and per share amounts; unaudited) |
|
|
|
|
|
|
|
|
|
|
|
|
|
|
|
|
Three Months Ended March 31, |
|
|
|
|
|
|
|
|
2026 |
|
|
|
2025 |
|
| Net sales |
$ |
396.3 |
|
|
$ |
329.4 |
|
| Cost of sales |
|
297.2 |
|
|
|
237.0 |
|
| Gross profit |
|
99.1 |
|
|
|
92.4 |
|
|
|
|
|
|
|
|
|
| Operating expenses: |
|
|
|
|
|
|
|
| Selling, general and administrative expenses |
|
90.2 |
|
|
|
71.9 |
|
| Other operating gains, net |
|
(0.1 |
) |
|
|
— |
|
| Total operating expenses |
|
90.1 |
|
|
|
71.9 |
|
| Income from operations |
|
9.0 |
|
|
|
20.5 |
|
|
|
|
|
|
|
|
|
| Other expenses, net: |
|
|
|
|
|
|
|
| Interest expense |
|
(7.4 |
) |
|
|
(2.0 |
) |
| Other income, net |
|
1.2 |
|
|
|
1.2 |
|
| Income before income taxes |
|
2.8 |
|
|
|
19.7 |
|
| Income tax provision |
|
1.5 |
|
|
|
5.4 |
|
| Net income |
|
1.3 |
|
|
|
14.3 |
|
| Net income attributable to noncontrolling interest |
|
— |
|
|
|
— |
|
| Net income attributable to controlling interest |
$ |
1.3 |
|
|
$ |
14.3 |
|
|
|
|
|
|
|
|
|
| Earnings per common share |
|
|
|
|
|
|
|
| Basic |
$ |
0.06 |
|
|
$ |
0.63 |
|
| Diluted |
|
0.06 |
|
|
|
0.62 |
|
|
|
|
|
|
|
|
|
| Weighted average shares outstanding |
|
|
|
|
|
|
|
| Basic |
|
22,939 |
|
|
|
22,833 |
|
| Diluted |
|
23,251 |
|
|
|
22,977 |
|
|
|
|
|
|
|
|
|
| Astec Industries Inc. Reportable Segment Net Sales and Operating Adjusted EBITDA (In millions, except percentage data; unaudited) |
|
|
|
|
|
|
|
|
|
|
|
|
|
|
|
Reportable segment net sales exclude intersegment sales.
|
|
|
|
|
|
|
|
|
|
|
|
|
|
|
|
Three Months Ended March 31, |
|
|
|
|
|
|
|
|
|
|
|
|
|
|
|
2026 |
|
|
|
2025 |
|
|
$ Change |
|
|
|
% Change |
|
| Revenues from external customers |
|
|
|
|
|
|
|
|
|
|
|
|
|
|
| Infrastructure Solutions |
$ |
237.0 |
|
|
$ |
236.0 |
|
|
$ |
1.0 |
|
|
0.4 |
% |
| Materials Solutions |
|
159.3 |
|
|
|
93.4 |
|
|
|
65.9 |
|
|
70.6 |
% |
| Net sales |
$ |
396.3 |
|
|
$ |
329.4 |
|
|
$ |
66.9 |
|
|
20.3 |
% |
|
|
|
|
|
|
|
|
|
|
|
|
|
|
|
| Segment Operating Adjusted EBITDA |
|
|
|
|
|
|
|
|
|
|
|
|
|
|
| Infrastructure Solutions |
$ |
34.8 |
|
|
$ |
42.9 |
|
|
$ |
(8.1 |
) |
|
(18.9 |
)% |
| Materials Solutions |
|
8.9 |
|
|
|
5.2 |
|
|
|
3.7 |
|
|
71.2 |
% |
| Segment Operating Adjusted EBITDA - Reportable Segments |
|
43.7 |
|
|
|
48.1 |
|
|
|
|
|
|
|
|
| Reconciliation of Segment Operating Adjusted EBITDA to "Income before income taxes" |
|
|
|
|
|
|
|
|
|
|
|
|
|
|
| Corporate and Other |
|
(13.4 |
) |
|
|
(12.9 |
) |
|
|
|
|
|
|
|
| Transformation program |
|
(3.8 |
) |
|
|
(6.9 |
) |
|
|
|
|
|
|
|
| Acquisition and integration costs |
|
(2.9 |
) |
|
|
(0.8 |
) |
|
|
|
|
|
|
|
| Interest expense, net |
|
(6.6 |
) |
|
|
(1.4 |
) |
|
|
|
|
|
|
|
| Depreciation and amortization |
|
(14.2 |
) |
|
|
(6.4 |
) |
|
|
|
|
|
|
|
| Income before income taxes |
$ |
2.8 |
|
|
$ |
19.7 |
|
|
|
|
|
|
|
|
|
|
|
|
|
|
|
|
|
|
|
|
|
|
|
| Segment Operating Adjusted EBITDA Margin |
|
2026 |
|
|
|
2025 |
|
|
Change |
|
|
|
|
|
| Infrastructure Solutions |
|
14.7 |
% |
|
|
18.2 |
% |
|
(350) bps |
|
|
|
|
|
| Materials Solutions |
|
5.6 |
% |
|
|
5.6 |
% |
|
— bps |
|
|
|
|
|
|
|
|
|
|
|
|
|
|
|
|
|
|
|
|
|
|
|
|
|
|
|
|
| Astec Industries Inc. Condensed Consolidated Balance Sheets (In millions; unaudited) |
|
|
|
|
|
|
|
|
|
|
|
|
|
|
|
|
March 31, 2026 |
|
|
|
December 31, 2025 |
|
|
| Assets |
|
|
|
|
|
|
|
| Current assets: |
|
|
|
|
|
|
|
| Cash, cash equivalents and restricted cash |
$ |
75.0 |
|
|
$ |
72.0 |
|
| Investments |
|
1.9 |
|
|
|
2.1 |
|
| Trade receivables, contract assets and other receivables, net |
|
215.6 |
|
|
|
218.7 |
|
| Inventories, net |
|
469.8 |
|
|
|
466.0 |
|
| Other current assets, net |
|
57.2 |
|
|
|
57.8 |
|
| Total current assets |
|
819.5 |
|
|
|
816.6 |
|
| Property, plant and equipment, net |
|
238.5 |
|
|
|
222.3 |
|
| Other long-term assets |
|
370.9 |
|
|
|
328.3 |
|
| Total assets |
$ |
1,428.9 |
|
|
$ |
1,367.2 |
|
|
|
|
|
|
|
|
|
| Liabilities |
|
|
|
|
|
|
|
| Current liabilities: |
|
|
|
|
|
|
|
| Accounts payable |
$ |
108.2 |
|
|
$ |
93.5 |
|
| Customer deposits |
|
96.1 |
|
|
|
83.7 |
|
| Other current liabilities |
|
145.3 |
|
|
|
150.8 |
|
| Total current liabilities |
|
349.6 |
|
|
|
328.0 |
|
| Long-term debt |
|
365.5 |
|
|
|
319.6 |
|
| Other long-term liabilities |
|
35.7 |
|
|
|
38.0 |
|
| Total equity |
|
678.1 |
|
|
|
681.6 |
|
| Total liabilities and equity |
$ |
1,428.9 |
|
|
$ |
1,367.2 |
|
|
|
|
|
|
|
|
|
| Astec Industries Inc. Condensed Consolidated Statements of Cash Flows (In millions; unaudited) |
|
|
|
|
|
|
|
|
|
|
|
|
|
|
|
|
Three Months Ended March 31, |
|
|
|
|
|
|
|
|
2026 |
|
|
|
2025 |
|
| Cash flows from operating activities: |
|
|
|
|
|
|
|
| Net income |
$ |
1.3 |
|
|
$ |
14.3 |
|
| Adjustments to reconcile net income to net cash provided by operating activities |
|
20.7 |
|
|
|
13.3 |
|
| Change in operating assets and liabilities |
|
18.7 |
|
|
|
(7.1 |
) |
| Net cash provided by operating activities |
|
40.7 |
|
|
|
20.5 |
|
| Cash flows from investing activities: |
|
|
|
|
|
|
|
| Acquisitions, net of cash acquired |
|
(67.9 |
) |
|
|
— |
|
| Expenditures for property and equipment |
|
(8.1 |
) |
|
|
(3.9 |
) |
| Proceeds from sale of property and equipment |
|
0.1 |
|
|
|
— |
|
| Proceeds from insurance |
|
0.1 |
|
|
|
— |
|
| Purchase of investments |
|
(0.6 |
) |
|
|
(0.4 |
) |
| Sale of investments |
|
0.2 |
|
|
|
0.1 |
|
| Net cash used in investing activities |
|
(76.2 |
) |
|
|
(4.2 |
) |
| Cash flows from financing activities: |
|
|
|
|
|
|
|
| Payment of dividends |
|
(3.0 |
) |
|
|
(2.9 |
) |
| Proceeds from borrowings on credit facilities and bank loans |
|
117.8 |
|
|
|
95.5 |
|
| Repayments of borrowings on credit facilities and bank loans |
|
(73.2 |
) |
|
|
(106.9 |
) |
| Withholding tax paid upon vesting of share-based compensation awards |
|
(2.6 |
) |
|
|
(0.7 |
) |
| Net cash provided by (used in) financing activities |
|
39.0 |
|
|
|
(15.0 |
) |
| Effect of exchange rates on cash |
|
(0.5 |
) |
|
|
0.5 |
|
| Increase in cash, cash equivalents and restricted cash |
|
3.0 |
|
|
|
1.8 |
|
| Cash, cash equivalents and restricted cash, beginning of period |
|
72.0 |
|
|
|
90.8 |
|
| Cash, cash equivalents and restricted cash, end of period |
$ |
75.0 |
|
|
$ |
92.6 |
|
|
|
|
|
|
|
|
|
We present certain non-GAAP information that can be useful in understanding our operating results and the performance of our core business. We use both GAAP and non-GAAP financial measures to establish internal budgets and targets and to evaluate financial performance against such budgets and targets.
Beginning with the announcement of results for the third quarter of 2025, we have excluded amortization of acquired intangibles from the presentation of Adjusted income from operations, Adjusted net income attributable to controlling interest and Adjusted EPS. We have adopted this change to remove the effect of non-cash charges that are not affected by operations in any particular period unless an intangible asset becomes impaired, or the useful life of an intangible asset is revised.
Additionally, beginning with the announcement of results for the first quarter of 2026, we have included the gain or loss on sale of property and equipment in the presentation of Adjusted income from operations, Adjusted net income attributable to controlling interest, Adjusted EPS and Adjusted EBITDA.
Prior periods have been updated to reflect these changes.
We exclude the costs and related tax effects, which are based on the statutory tax rate applicable to each respective item unless otherwise noted below, of the following items as we do not believe they are indicative of our core business operations:
-
Transformation program - Incremental costs related to the execution of our ongoing strategic transformation initiatives which may include personnel costs, third-party consultant costs, duplicative systems usage fees, administrative costs, accelerated depreciation and amortization on certain long-lived assets and other similar type charges. Transformation program initiatives include our multi-year phased implementation of a standardized enterprise resource planning system. These costs are included in "Cost of sales" and "Selling, general and administrative expenses", as appropriate, in the Consolidated Statements of Operations.
-
Restructuring and other related charges - Charges related to restructuring activities, to the extent that they are experienced, may include personnel termination actions and reorganization efforts to simplify and consolidate our operations. These costs are recorded in "Other operating gains, net" in the Consolidated Statements of Operations.
-
Goodwill impairment - Goodwill impairment charges, to the extent that they are experienced, are recorded in "Goodwill impairment" in the Consolidated Statements of Operations.
-
Asset impairment - Asset impairment charges, to the extent that they are experienced, are recorded in "Other operating gains, net" in the Consolidated Statements of Operations.
-
Amortization of acquired intangible assets - Non-cash charges related to the amortization of acquired intangible assets. These costs are typically included in "Selling, general and administrative expenses" in the Consolidated Statements of Operations.
-
Acquisition and integration costs - Costs associated with the pursuit of acquisition opportunities or the effected acquisition and integration of acquired businesses. These costs are typically included in "Cost of sales" and "Selling, general and administrative expenses" in the Consolidated Statements of Operations.
|
|
|
|
|
|
|
|
|
|
|
|
|
|
|
|
| Astec Industries Inc. GAAP vs Non-GAAP Adjusted Income from Operations Reconciliations (In millions, except percentage data; unaudited) |
|
|
|
|
|
|
|
|
|
|
|
|
|
|
|
|
Three Months Ended March 31, |
|
|
|
|
|
|
|
|
2026 |
|
|
|
2025 |
|
| Net sales |
$ |
396.3 |
|
|
$ |
329.4 |
|
|
|
|
|
|
|
|
|
| Income from operations |
$ |
9.0 |
|
|
$ |
20.5 |
|
| Adjustments: |
|
|
|
|
|
|
|
| Transformation program |
|
3.8 |
|
|
|
7.0 |
|
| Amortization of acquired intangible assets |
|
7.9 |
|
|
|
0.7 |
|
| Acquisition and integration costs |
|
2.9 |
|
|
|
0.8 |
|
| Adjusted income from operations |
$ |
23.6 |
|
|
$ |
29.0 |
|
| Adjusted operating margin |
|
6.0 |
% |
|
|
8.8 |
% |
|
|
|
|
|
|
|
|
|
|
|
|
|
|
|
|
| Astec Industries Inc. GAAP vs Non-GAAP Adjusted EPS Reconciliations (In millions, except per share amounts; unaudited) |
|
|
|
|
|
|
|
|
|
|
|
|
|
|
|
|
Three Months Ended March 31, |
|
|
|
|
|
|
|
|
2026 |
|
|
|
2025 |
|
| Net income attributable to controlling interest |
$ |
1.3 |
|
|
$ |
14.3 |
|
| Adjustments: |
|
|
|
|
|
|
|
| Transformation program |
|
3.8 |
|
|
|
7.0 |
|
| Amortization of acquired intangible assets |
|
7.9 |
|
|
|
0.7 |
|
| Acquisition and integration costs |
|
2.9 |
|
|
|
0.8 |
|
| Income tax impact of adjustments |
|
(3.4 |
) |
|
|
(1.9 |
) |
| Adjusted net income attributable to controlling interest |
$ |
12.5 |
|
|
$ |
20.9 |
|
|
|
|
|
|
|
|
|
| Diluted EPS |
$ |
0.06 |
|
|
$ |
0.62 |
|
| Adjustments: |
|
|
|
|
|
|
|
| Transformation program(a) |
|
0.17 |
|
|
|
0.31 |
|
| Amortization of acquired intangible assets |
|
0.34 |
|
|
|
0.03 |
|
| Acquisition and integration costs |
|
0.12 |
|
|
|
0.03 |
|
| Income tax impact of adjustments |
|
(0.15 |
) |
|
|
(0.08 |
) |
| Adjusted EPS |
$ |
0.54 |
|
|
$ |
0.91 |
|
|
|
|
|
|
|
|
|
| (a)Calculation includes the impact of a rounding adjustment |
|
|
|
|
|
|
|
|
|
|
|
|
|
|
|
|
|
|
|
|
|
|
|
| Astec Industries Inc. EBITDA and Adjusted EBITDA Reconciliations (In millions, except percentage data; unaudited) |
|
|
|
|
|
|
|
|
|
|
|
|
|
|
|
|
Three Months Ended March 31, |
|
|
|
|
|
|
|
|
2026 |
|
|
|
2025 |
|
| Net sales |
$ |
396.3 |
|
|
$ |
329.4 |
|
|
|
|
|
|
|
|
|
| Net income attributable to controlling interest |
$ |
1.3 |
|
|
$ |
14.3 |
|
| Interest expense, net |
|
6.6 |
|
|
|
1.4 |
|
| Depreciation and amortization |
|
14.2 |
|
|
|
6.4 |
|
| Income tax provision |
|
1.5 |
|
|
|
5.4 |
|
| EBITDA |
|
23.6 |
|
|
|
27.5 |
|
| EBITDA margin |
|
6.0 |
% |
|
|
8.3 |
% |
|
|
|
|
|
|
|
|
| Adjustments: |
|
|
|
|
|
|
|
| Transformation program |
|
3.8 |
|
|
|
6.9 |
|
| Acquisition and integration costs |
|
2.9 |
|
|
|
0.8 |
|
| Adjusted EBITDA |
$ |
30.3 |
|
|
$ |
35.2 |
|
| Adjusted EBITDA margin |
|
7.6 |
% |
|
|
10.7 |
% |
|
|
|
|
|
|
|
|
Astec Industries Inc.
Free Cash Flow Reconciliation
(In millions; unaudited)
|
|
|
|
|
|
|
|
|
Three Months Ended March 31, |
|
|
|
|
|
|
|
|
2026 |
|
|
|
2025 |
|
| Net cash provided by operating activities |
$ |
40.7 |
|
|
$ |
20.5 |
|
| Expenditures for property and equipment |
|
(8.1 |
) |
|
|
(3.9 |
) |
| Free cash flow |
$ |
32.6 |
|
|
$ |
16.6 |
|
|
|
|
|
|
|
|
|

Source: Astec Industries, Inc.
View All News
Investor Email Alerts
Personal Information.
Email Address *Required Email Address is required. Email Address is invalid.
Investor Alert Options *
- News
- Quarterly Reports
- Annual Reports
- SEC Filings
- End of Day Stock Quote
- Events & Presentations
Investor Alert Options is required.
The captcha test has failed. Please try again. Submit
Unsubscribe