ARTW
Fiscal year ends November Quarters are offset from the calendar — Q1 is Dec–Feb

Art's-Way Manufacturing Co., Inc. is a manufacturer of agricultural equipment and specialized modular buildings. The company operates two primary segments: Agricultural Products and Modular Buildings. The Agricultural Products segment manufactures farm machinery under the Art's-Way brand, including feed processing equipment such as grinder mixers and mills, forage equipment, manure spreaders, sugar beet harvesting equipment, and dirt work implements. These products are distributed through independent dealers in the United States, Canada, Australia, Japan, and the United Kingdom. The Modular Buildings segment, operated through its subsidiary Art's-Way Scientific, Inc., designs, manufactures, and leases custom modular buildings for animal containment and research laboratories. This segment serves academic institutions, government research centers, public health agencies, and private pharmaceutical companies. The company began operations in 1956 and has expanded its product lines through acquisitions of brands such as Eversman, MillerPro, Badger, and Universal Harvester.

Summarised from the company's own disclosures, fiscal year ended Feb 2026

Industry Farm & Heavy Construction Machinery Homepage artsway-mfg.com
Sector Industrials IR page artsway-mfg.com/investors
Tags
agricultural machinery, feed processing equipment, manure spreaders, sugar beet harvesters, modular buildings, research laboratories, animal containment, forage equipment, dirt work equipment, oem parts, Art's-Way, Art's-Way Scientific, Eversman, MillerPro, Badger, Universal Harvester, American Carbide Tools, AgroTrend, Ohio Metal Co., Logan Company, Peerless, Sunmaster, Heath Farm Equipment, WeighTronix, SupRaMix, Landstar, KanAm, DMI, United Farm Tool, Roda, M&W
Press page —

Metrics

Valuation  
Market cap $ 16.244M
Market cap (USD) $ 16.244M
P/E -34.67
PEG —
P/BV 1.19
P/S 0.65
P/OCF 16.94
P/FCF -15.68
Dividend yield —
Turnover / mcap —
Returns  
ROE 8.1%
ROI 6.6%
ROIC 1.3%
Profit margin 4.5%
Growth  
Revenue growing No
Profits growing Yes
Revenue up 3y No
Revenue up 5y No
Earnings growth 3y (net profit CAGR) 119.5%
Quality  
Profitable Yes
Margin expanding No
Buying back stock No
Diluting (TTM) Yes
Debt/Equity 17.2%
Podcast bulls (TTM) Sign up
Podcast bears (TTM) Sign up
Podcast sentiment (TTM) Sign up
Podcast sentiment % (TTM) Sign up
News sentiment (TTM) 22
Quality score -35.3%
Insiders  
Buys, 1w Sign up
Buys, 1m Sign up
Buys, 1y Sign up
Sells, 1w Sign up
Sells, 1m Sign up
Sells, 1y Sign up

Sign up to see this company's insider trades

Figure FY 2025 FY 2024 FY 2023 FY 2022 FY 2021 FY 2020 FY 2019 FY 2018 FY 2017 FY 2016 FY 2015 FY 2014 FY 2013 FY 2012 FY 2011 FY 2010 FY 2009 FY 2008 FY 2007 FY 2003 FY 2002 FY 2001 FY 2000 FY 1999
Revenue 22.975M 24.499M 30.281M 28.4M 24.965M 22.409M 22.889M 19.727M 20.715M 21.558M 27.936M 36.17M 34.227M 36.457M 27.62M 28.951M 26.296M 32.041M 25.518M — — — 14.229M —
Net profit 1.035M 307.375K 266.969K 97.797K 212.631K -2.103M -1.42M -3.387M -1.637M -821.334K -557.842K 935.247K 1.551M 2.665M 1.249M 1.053M 762.25K 1.83M 2.234M 1.664M 569.103K -2.382M -2.166M —
Free cash flow -1.532M 1.902M -896.978K -795.63K -1.606M -1.55M 360.728K -1.553M 233.785K 2.108M -7.508K 1.309M -844.468K 4.205M 1.509M 1.55M 1.168M -3.666M -2.839M 292.782K 1.382M 886.175K 1.178M —

Figure FY 2025 FY 2024 FY 2023 FY 2022 FY 2021 FY 2020 FY 2019 FY 2018 FY 2017 FY 2016 FY 2015 FY 2014 FY 2013 FY 2012 FY 2011 FY 2010 FY 2009 FY 2008 FY 2007 FY 2003 FY 2002 FY 2001 FY 2000 FY 1999
Share price 2.49 1.84 2.35 1.83 3.6 2.3 2.13 2.25 2.5 3.04 2.95 4.99 6.96 — 10 10 — 3.57 24 — — — — —
Price performance 12m 0.35 -0.22 0.29 -0.49 0.56 0.08 -0.05 -0.1 -0.18 0.03 -0.41 -0.28 — — 0 — — -0.85 5.86 — — — — —

Filed figures

Figure Nov 2016 Nov 2017 Nov 2018 Nov 2019 Nov 2020 Nov 2021 Nov 2022 Nov 2023 Nov 2024 Nov 2025
Balance sheet detail
Trade receivables (USD) 1.42M 1.91M 1.54M 1.68M 2.39M 2.66M 2.72M 3.43M 2.37M 2.2M
↳ YoY growth -31.0% +34.5% -19.5% +9.3% +42.3% +11.4% +2.2% +26.1% -30.9% -7.2%
↳ 5y CAGR -6.9% -7.2% -12.5% -10.7% +3.0% +13.4% +7.3% +17.4% +7.2% -1.6%
Borrowings, current (USD) 1.81M 221,230 227,459 85,401 94,979 99,462 97,678 109,193 119,734 165,326
Borrowings, non-current (USD) 1.39M 2.75M 2.52M 2.35M 2.71M 2.64M 2.9M 2.63M 1.98M 2.33M
Lease liabilities (USD) — — — 34,316 18,342 177,317 796,982 993,428 769,118 663,902
Cash and deposits (USD) 1.06M 212,400 3,512 3,145 2,684 2,658 5,055 4,014 1,860 4,849
Right-of-use assets (USD) — — — 34,316 27,879 47,794 34,931 22,427 13,774 —
Net debt (borrowings + leases - cash) (USD) 2.13M 2.76M 2.75M 2.43M 2.82M 2.91M 3.79M 3.73M 2.86M 3.15M
Cash flow detail
Operating cash flow (USD) 2.38M 747,399 -1.12M 807,753 -856,314 -985,854 951,721 -55,194 2.63M -904,143
Purchases of property, plant and equipment (USD) -274,089 -513,614 -434,505 -447,025 -693,414 -620,284 -1.75M -841,784 -724,679 -627,615
Change in receivables (cash effect) (USD) 458,542 -499,795 380,379 -140,687 -738,879 -259,439 -55,779 -964,275 982,841 219,032
Change in inventories (cash effect) (USD) 1.66M 1.56M 900,854 1.48M 459,804 -809,070 -1.19M -1.3M 550,547 -1.44M
Change in payables (cash effect) (USD) -26,386 203,795 128,409 403,251 750,091 -218,313 893,875 -253,961 -1.31M -42,122
Share buybacks (cash effect) (USD) — -6,425 -21,310 -19,323 -30,996 -30,470 -92,432 -68,536 -37,654 -1,542
Interest paid (cash effect) (USD) -274,836 -319,319 -286,070 -329,356 -263,598 -270,616 -421,241 -606,747 -601,680 -338,112
Income taxes paid (cash effect) (USD) -4,872 -5,627 -5,237 -3,855 -28,514 -1,675 -2,365 -3,646 -6,309 -13,371
Share-based compensation (USD) 79,979 113,039 197,243 195,416 247,645 265,541 287,721 292,185 182,847 179,080
Operating cash flow before change in receivables (USD) 1.92M 1.25M -1.5M 948,440 -117,435 -726,415 1.01M 909,081 1.64M -1.12M
Free cash flow (OCF - PPE - intangibles) (USD) 2.11M 233,785 -1.55M 360,728 -1.55M -1.61M -795,630 -896,978 1.9M -1.53M
Income detail
Research and development expense (USD) 140,000 183,000 178,000 149,000 199,000 152,000 193,000 204,000 216,000 228,000
↳ 5y CAGR -20.2% +0.9% +0.5% -4.8% +4.2% +1.7% +1.1% +2.8% +7.7% +2.8%
Total comprehensive income (USD) -1.12M -1.59M -3.13M -1.42M — — — — — —
Comprehensive income to owners (USD) -1.12M -1.59M -3.13M -1.42M — — — — — —
Provision for credit losses (USD) 4,925 9,552 -7,198 -2,175 28,250 -12,987 -3,489 -1,151 76,499 -48,035
Credit cost ratio (credit losses / average receivables) (%) 0.3% 0.6% 0.4% 0.1% 1.4% 0.5% 0.1% 0.0% 2.6% 2.1%
Reported Feb 2, 2017 Feb 7, 2018 Feb 5, 2019 Jul 10, 2020 Feb 9, 2021 Apr 14, 2022 Apr 13, 2023 Apr 11, 2024 Feb 18, 2025 Feb 12, 2026

Sign up to see institutional holdings

Sign Up

Podcast Mentions

Sign up to see podcast mentions and sentiment

Sign Up

Art's Way Reports a 12% Revenue Increase Through First Nine Months of Fiscal 2026

ARMSTRONG, IA / ACCESS Newswire / October 9, 2026 / Art's-Way Manufacturing Co., Inc. (Nasdaq:ARTW) (the "Company"), a diversified manufacturer and distributor of equipment serving agricultural and research needs, announces its financial results for the third quarter and first nine months of fiscal 2026.
Marc McConnell, the Company's President, CEO, and Chairman, reports, "We are pleased to announce our third quarter results, although we believe these results aren't entirely representative of how the year is evolving for us. We continue to be pleased with the strong demand for livestock equipment we've experienced for much of the year, resulting in Agricultural Equipment sales that remain ahead of 2025 levels. In our Modular Buildings segment, our reduced revenue for the quarter was largely attributable to timing of revenue recognition on projects under contract. Demand remains strong in this segment and, as has been previously announced, we have significant projects in our pipeline that constitute the largest backlog in our history that suggest strong performance going forward. In both segments we are battling rising material and operating costs that have put pressure on margins. We are actively working to regain margin in both businesses while continuing to grow in the markets we serve. We are pleased with the overall trends year to date and look forward to continued progress with particular focus on quality, innovation, and outstanding customer service."

Consolidated

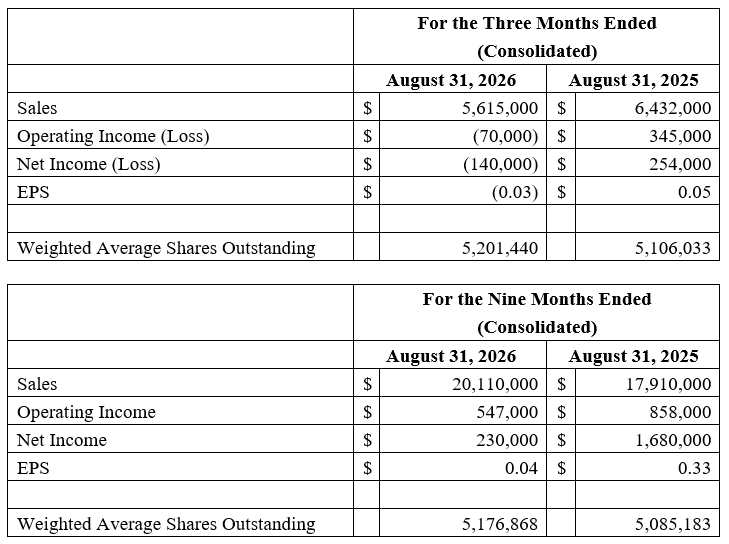
  • Sales decreased $816,000, or 12.7% for the three months and increased $2,199,000, or 12.3% for the nine months ended August 31, 2026, as compared to the same periods in fiscal 2025.
  • Gross profit as a percentage of sales declined by 2.1% to 27.9% for the nine months ended August 31, 2026, as compared to the first nine months of fiscal 2025.
  • Operating expenses as a percentage of sales increased by 0.2% to 25.1% for the nine months ended August 31, 2026, as compared to the same period in fiscal 2025. Operating income declined by 2.1% for the nine months ended August 31, 2026, as compared to the same period in fiscal 2025.
  • Net loss of $140,000 for the three months ended August 31, 2026, and net income of $230,000 for the nine months ended August 31, 2026. The Company received $1,154,000 of Employee Retention Credit net of income tax in Q2 of fiscal 2025 that was not repeated in fiscal 2026, which affects comparability for the nine-month period.

Agricultural Products

  • Sales increased $82,000, or 2.7% for the three months and increased $1,237,000, or 12.4% for the nine months ended August 31, 2026, as compared to the same periods in fiscal 2025.
  • Gross profit as a percentage of sales increased by 4.0% to 28.4% for the nine months ended August 31, 2026, as compared to the first nine months of fiscal 2025.
  • Operating expenses as a percentage of sales increased by 1.1% to 34.6% for the nine months ended August 31, 2026, as compared to the same period in fiscal 2025. Operating loss improved by $215,000 for the nine months ended August 31, 2026, as compared to the same period in fiscal 2025.
  • Net loss of $725,000 for the nine months ended August 31, 2026, compared to net income of $139,000 for the same period of fiscal 2025. We received an Employee Retention Credit refund during the nine months ending August 31, 2025, that positively impacted net income by $976,000 in this segment and affects comparability.

The overall outlook for the agricultural sector remains bleak with modest row crop prices and rising input costs. Despite this, our sales have increased compared to fiscal 2025 as heightened dealer inventories from previous years have returned to normal stocking levels. So far, fiscal 2026 has seen increased demand for grinder mixers, manure spreaders and bale processors from fiscal 2025, which we attribute mostly to strong livestock prices. Our sugar beet equipment demand is down noticeably from prior years, as sugar beet prices declined in the first fiscal quarter of 2026. We believe this softening demand was mitigated by the introduction of our new ClearView beet head in twelve and eight row configurations this year. We strategically deployed an experienced product specialist into our primary beet territory beginning in April 2026 to drive new customer activity and further technological development. We are still carrying elevated whole good inventory levels in beet and manure spreading equipment compared to prior years to put us in position to react to spikes in demand. We will build up grinder mixer inventory in the event we are able to work through our backlog but have yet to get ahead of demand for these products. The margin increase for fiscal 2026 is due primarily to increased sales, which resulted in better absorption of fixed manufacturing costs. Our grinder mixer sales increased approximately $1,523,000 year-on-year. The price of steel we use to manufacture agricultural equipment increased over 40% from our fiscal year end and rising oil prices may challenge our margins for the rest of fiscal 2026.

Modular Buildings

  • Sales decreased $898,000, or 26.0% for the three months and increased $962,000, or 12.1% for the nine months ended August 31, 2026, as compared to the same periods in fiscal 2025.
  • Gross profit as a percentage of sales declined by 9.2% to 27.2% for the nine months ended August 31, 2026, as compared to the same period in fiscal 2025.
  • Operating expenses as a percentage of sales decreased by 0.09% to 13.2% for the nine months ended August 31, 2026, as compared to the same period in fiscal 2025.
  • Net income of $955,000 for the nine months ended August 31, 2026, compared to net income of $1,541,000 for the same period of fiscal 2025. We received an Employee Retention Credit refund during the nine months ending August 31, 2025, that positively impacted net income by $179,000 in this segment.

While sales for the nine months ended August 31, 2026, were up year on year, our third fiscal quarter had a lull in progress on contracts as we concluded on-site projects and completed design work for expected construction contracts that eventually became backlog. Current backlog is the highest in the history of this segment and is expected to carry us through the end of fiscal 2027. Our margin decrease for the first nine months of fiscal 2026 is due to the selling of a warrantied agriculture modular building at cost, project overages on site work while completing current contracts and contingencies that became profits in the first quarter of fiscal 2025 that was not repeated in the first nine months of fiscal 2026.

Income per Share: Income per basic and diluted share for the first nine months of fiscal 2026 was $0.04, compared to income per basic and diluted share of $0.33 for the same period in fiscal 2025.

Art's-Way Manufacturing Co., Inc.

Art's Way Manufacturing is a small, publicly traded company that specializes in equipment manufacturing. For over 70 years, it has been committed to designing and building high-quality machinery for all operations. It has approximately 100 employees across two branch locations: Art's Way Manufacturing in Armstrong, Iowa and Art's Way Scientific in Monona, Iowa. Art's Way manure spreaders , forage boxes , high dump carts , bale processors , graders , land planes , sugar beet harvesters and grinder mixers are designed to optimize production, increase efficiency and meet the growing demands of customers. Art's Way Manufacturing has two reporting segments: Agricultural Products and Modular Buildings .

Art's Way Announces Significant Increase in Backlog Following Award of Major Modular Building Projects

ARMSTRONG, IA / ACCESS Newswire / August 10, 2026 / Art's-Way Manufacturing Co., Inc. (Nasdaq:ARTW) (the "Company"), a diversified manufacturer and distributor of equipment serving agricultural and research needs, announces that its Modular Buildings segment has been awarded major projects recently, increasing the segment's backlog to over $19.0 million, a significant increase since the $1.3 million reported in the Company's Quarterly Report on Form 10-Q for the fiscal quarter ended May 31, 2026.

These projects represent a significant increase in the Modular Building segment's production commitments and provide enhanced visibility into future manufacturing activity. The backlog is estimated to be substantially fulfilled by the end of the Company's 2027 fiscal year, subject to customer schedules, project milestones and customary execution.

Marc McConnell, the Company's President, CEO, and Chairman, reports, "We are pleased to announce the award of these significant projects, which reflect the strength of our modular manufacturing capabilities and the confidence our customers have placed in our team. These projects substantially strengthen our backlog and position the Company for an extended period of production activity. We remain focused on executing these projects efficiently and at the high level of quality and service our customers expect."

The Company is not disclosing the identities of the customers or additional project details at this time due to the contractual confidentiality obligations. Should the customers agree to joint press release in the future the Company may release more information related to the projects.

The Company expects these projects to be executed at margins generally consistent with its historical performance for comparable Modular Buildings projects.

Backlog represents the estimated value of signed customer contracts that have not yet been completed. While backlog provides an indication of future business activity, it is subject to customer requirements, contract terms, scheduling changes, and other factors. Accordingly, backlog is not necessarily indicative of future revenue, operating results, or the timing of revenue recognition.

Art's-Way Manufacturing Co., Inc.

Art's Way Manufacturing is a small, publicly traded company that specializes in equipment manufacturing. For over 65 years, it has been committed to designing and building high-quality machinery for all operations. It has approximately 100 employees across two branch locations: Art's Way Manufacturing in Armstrong, Iowa and Art's Way Scientific in Monona, Iowa. Art's Way manure spreaders , forage boxes , high dump carts , bale processors , graders , land planes , sugar beet harvesters and grinder mixers are designed to optimize production, increase efficiency and meet the growing demands of customers. Art's Way Manufacturing has two reporting segments: Agricultural Products and Modular Buildings .

Art's Way Reports 26% Increase in First Half Sales and 20% Growth in Operating Income

ARMSTRONG, IA / ACCESS Newswire / July 9, 2026 / Art's-Way Manufacturing Co., Inc. (NASDAQ:ARTW) (the "Company"), a diversified manufacturer and distributor of equipment serving agricultural and research needs, announces its financial results for the second quarter and first six months of fiscal 2026.

Marc McConnell, the Company's President, CEO, and Chairman, reports, "We are pleased to report that the marked improvement we saw at the outset of our fiscal year continued into the second quarter, resulting in improving revenue and operating results. In our Agricultural Products segment, we have experienced demand growth in livestock-oriented products that have well outpaced the reduced demand in our sugar beet products. We view this as an overall positive result given the persistent challenges in the entirety of the farm equipment marketplace. We are especially pleased with the continued strong demand and profitability in our Modular Buildings segment, where growth and progress continue. Despite improving operating results, we acknowledge that material cost pressures have impacted our gross margins and we are thus focused on monitoring, managing, and improving margins in both businesses. Overall, we have an optimistic view of our opportunities in the quarters ahead and remain steadfastly focused on quality, innovation, and serving our customers well."

Consolidated

  • Sales increased $1,517,000, or 23.9% for the three months and increased $3,017,000, or 26.3% for the six months ended May 31, 2026 as compared to the same periods in fiscal 2025.

  • Gross profit as a percentage of sales declined by 3.8% for the six months ended May 31, 2026 as compared to the first six months of fiscal 2025.

  • Operating expenses decreased by 3.6% as a percentage of sales for the six months ended May 31, 2026 as compared to the same period in fiscal 2025. Operating income improved by 20.2% for the six months ended May 31, 2026 as compared to the same period in fiscal 2025.

  • Net income of $173,000 for the three months ended May 31, 2026 and $370,000 for the six months ended May 31, 2026. The Company received $1,154,000 of Employee Retention Credit net of income tax in Q2 of fiscal 2025 that was not repeated in fiscal 2026, which affects comparability.

Agricultural Products

  • Sales increased $348,000, or 8.6% for the three months and increased $1,155,000, or 16.6% for the six months ended May 31, 2026 as compared to the same periods in fiscal 2025.

  • Gross profit as a percentage of sales increased by 2.1% for the six months ended May 31, 2026 as compared to the first six months of fiscal 2025.

  • Operating expenses decreased by 7.2% for the six months ended May 31, 2026 as compared to the same period in fiscal 2025. Operating loss improved by $299,000 for the six months ended May 31, 2026 as compared to the same period in fiscal 2025.

  • Net loss of $208,000 for the six months ended May 31, 2026 compared to net income of $527,000 for the same period of fiscal 2025. We received an Employee Retention Credit refund during the six months ending May 31, 2025 that positively impacted net income by $976,000 in this segment.

Livestock prices continued to be elevated through the second quarter of fiscal 2026 and are driving the increased demand for our agricultural products year-on-year. We continue to see steady demand for grinder mixers, manure spreaders and bale processors, despite modest row crop prices through the first six months of fiscal 2026. Our sugar beet equipment demand is down from prior years, as sugar beet prices declined in the first fiscal quarter of 2026. To offset some of the demand decrease, we strategically deployed an experienced product specialist into our primary beet territory to drive new customer activity and technological development. The timing of this hire aligns with the unveiling of a new product in the beet market for fiscal 2026. We have increased our finished product inventory since the fall of 2025 to be prepared for retail opportunities in fiscal 2026, which we believe has been an opportunistic move. Our inventory levels are still elevated as compared to prior years, but are putting us in a position where our short lead times may provide a competitive edge. Rising steel and oil prices may challenge our margins for the remainder of fiscal 2026 if we continue to see increases.

Modular Buildings

  • Sales increased $1,169,000, or 50.6% for the three months and increased $1,861,000, or 41.3% for the six months ended May 31, 2026 as compared to the same periods in fiscal 2025.

  • Gross profit as a percentage of sales declined by 12.4% for the [•] months ended May 31, 2026 as compared to the same period in fiscal 2025.

  • Operating expenses decreased by 3.1% as a percentage of sales for the [•] months ended May 31, 2026 as compared to the same period in fiscal 2025.

  • Net income of $577,000 for the six months ended May 31, 2026 compared to net income of $899,000 for the same period of fiscal 2025. We received an Employee Retention Credit refund during the six months ending May 31, 2025 that positively impacted net income by $179,000 in this segment.

We carried a strong modular building backlog into fiscal 2026, unlike fiscal 2025, which has driven the revenue increase so far this year. Our agricultural modular building business is up approximately $407,000, or 29.5%, year-on-year due to strong livestock prices. Our research-related modular building sales are up approximately $1,578,000, or 53.2%, for the six months ended May 31, 2026 due to large projects we contracted at the end of fiscal 2025. Current backlog is expected to carry us through the third quarter of fiscal 2026. Additionally, we expect current engineering projects to convert to construction projects in the third fiscal quarter. The private research market continued to carry strong demand for laboratory space during the first six months of fiscal 2026. Our gross profit decrease for the first six months of fiscal 2026 is due to the selling of a warrantied agriculture modular building at cost, project overages on site work while completing current contracts and contingencies that became profits in the first quarter of fiscal 2025 that were not repeated in the first six months of fiscal 2026.

Income (Loss) per Share: Income per basic and diluted share for the first six months of fiscal 2026 was $0.07, compared to income per basic and diluted share of $0.28 for the same period in fiscal 2025.

Art's-Way Manufacturing Co., Inc.

Art's Way Manufacturing is a small, publicly traded company that specializes in equipment manufacturing. For over 65 years, it has been committed to designing and building high-quality machinery for all operations. It has approximately 100 employees across two branch locations: Art's Way Manufacturing in Armstrong, Iowa and Art's Way Scientific in Monona, Iowa. Art's Way manure spreaders , forage boxes , high dump carts , bale processors , graders , land planes , sugar beet harvesters and grinder mixers are designed to optimize production, increase efficiency and meet the growing demands of customers. Art's Way Manufacturing has two reporting segments: Agricultural Products and Modular Buildings .

Prompts

Art's-Way Manufacturing Co., Inc. (ticker ARTW), listed in United States.

ETFs Holding Art's-Way Manufacturing Co., Inc.

ETF Weight in ETF Shares Market value As of
DFSU 0.00% 4,443 $ 12.751K Nov 12, 2026
DXUV 0.00% 4,404 $ 12.639K Nov 12, 2026
DCOR 0.00% 8,260 $ 23.706K Nov 12, 2026
DFAC 0.00% 9,247 $ 26.539K Nov 12, 2026