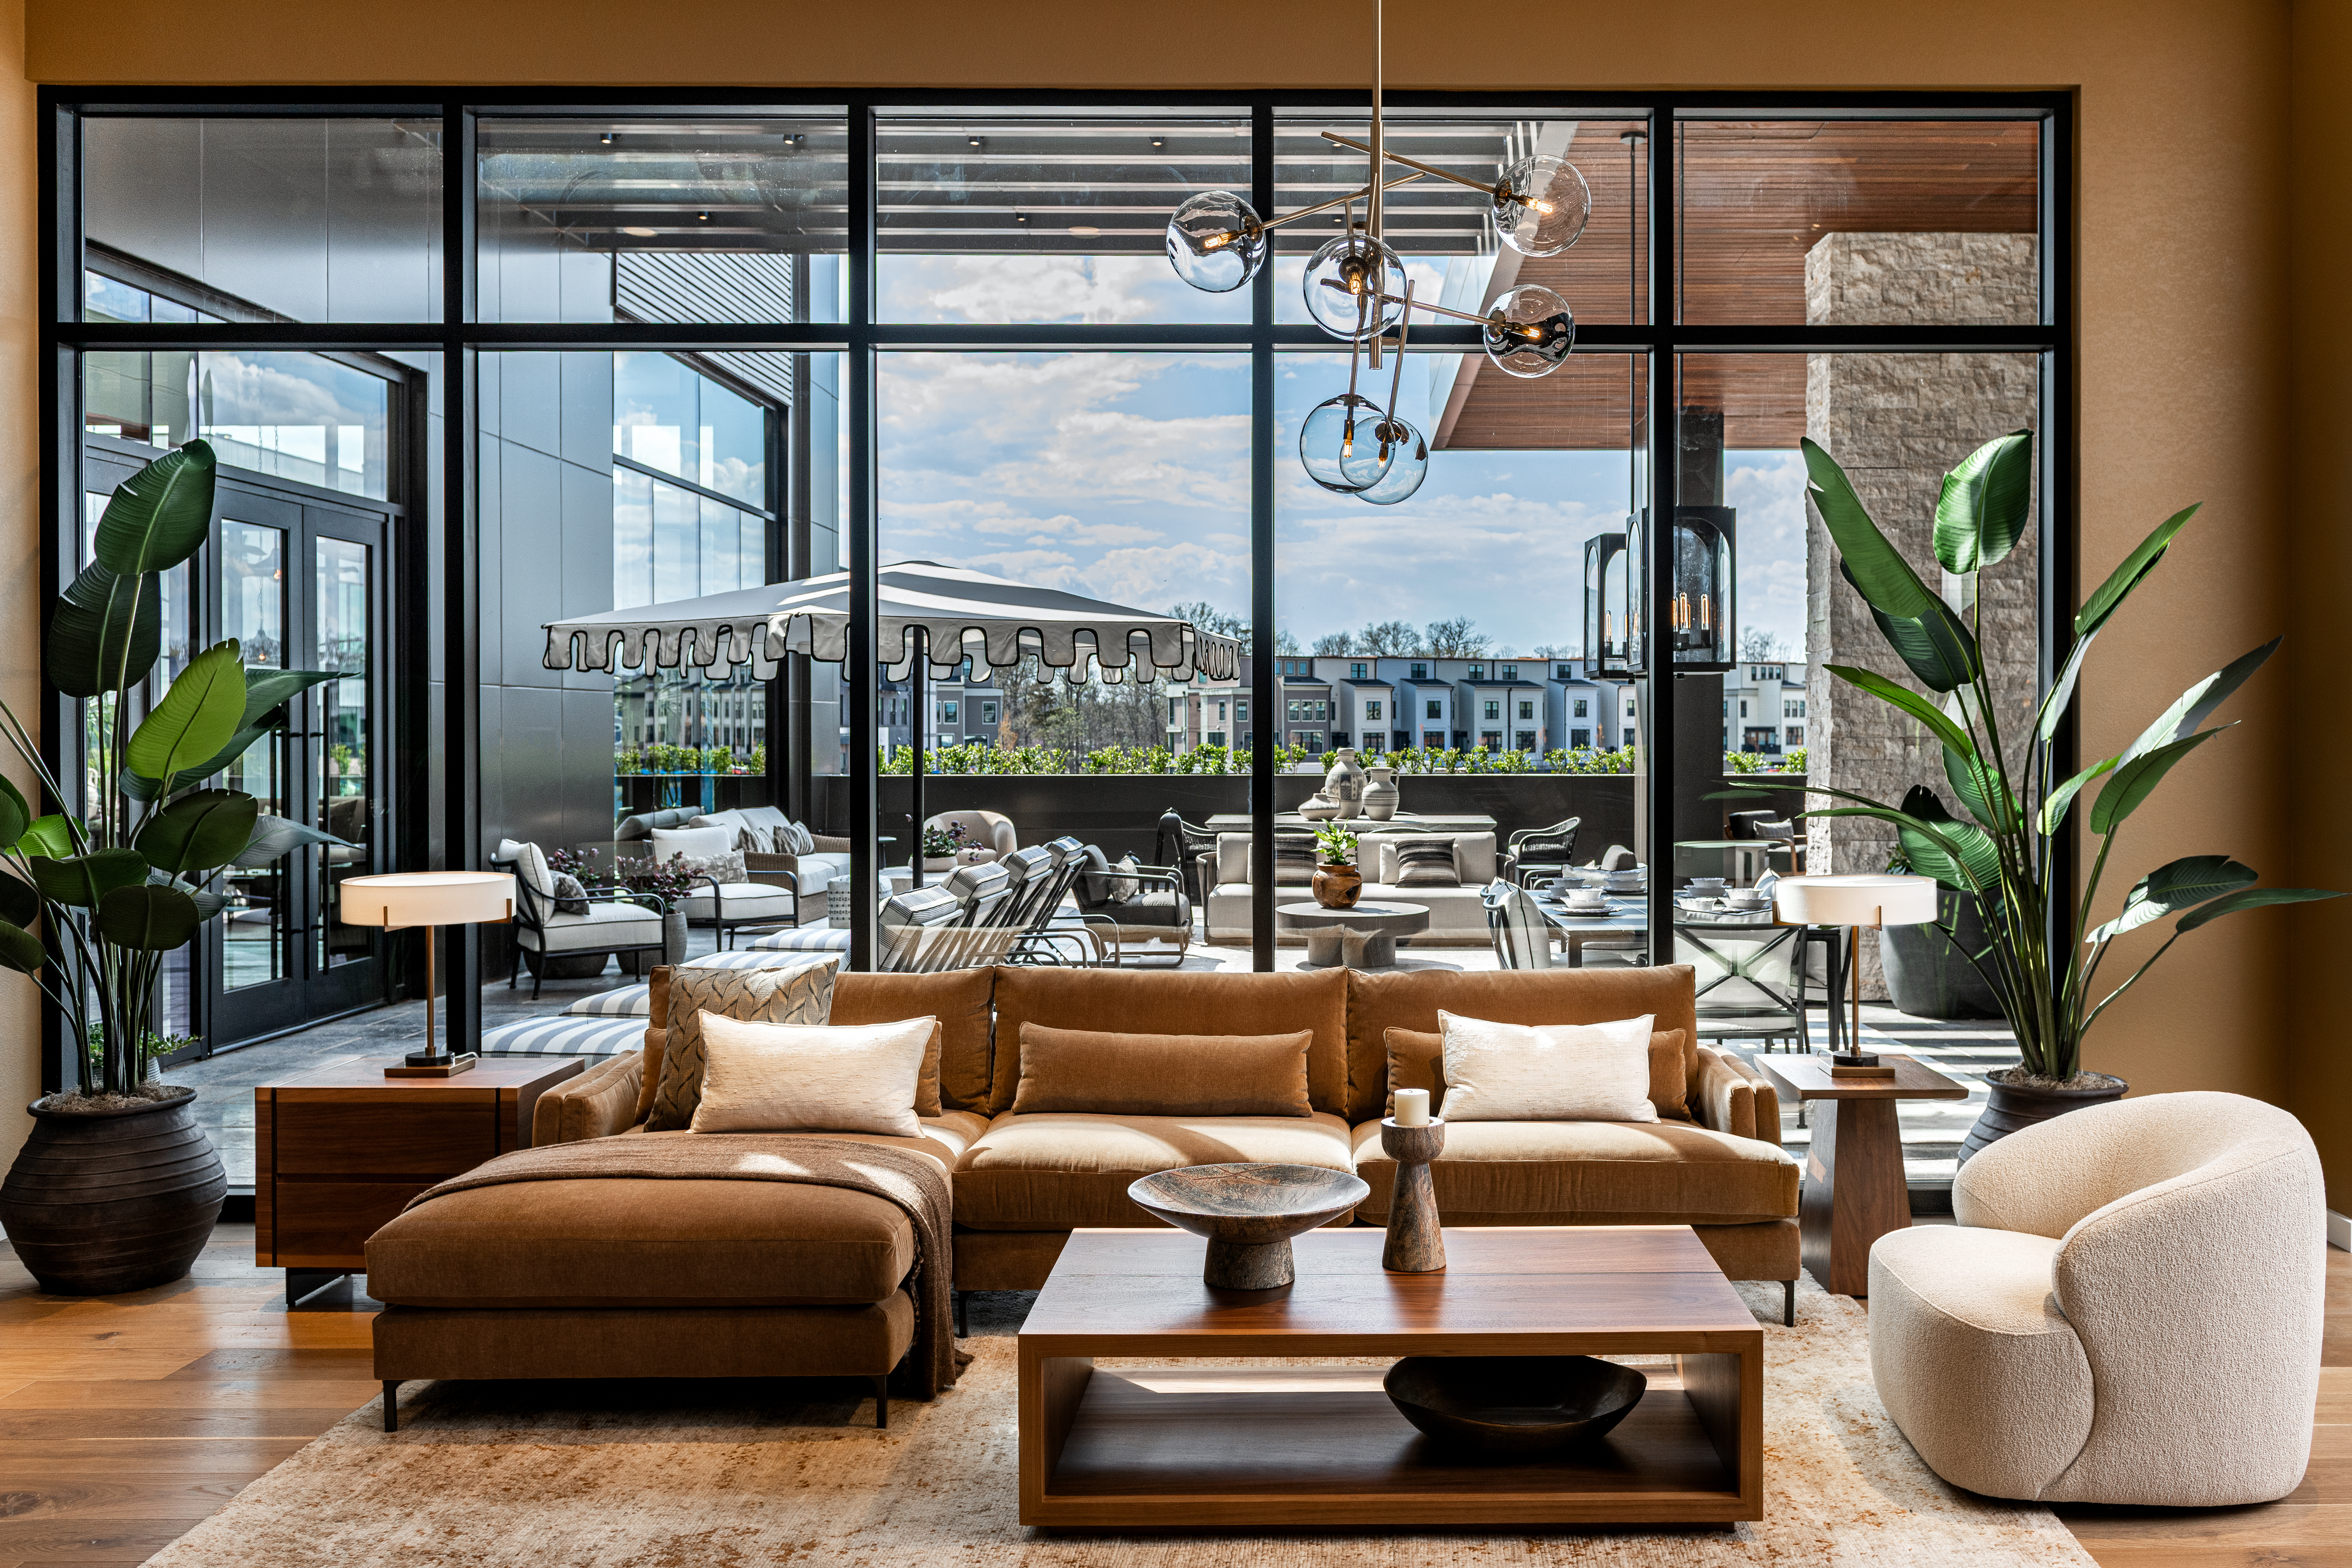
PDF Version BOSTON HEIGHTS, Ohio, May 07, 2026 (GLOBE NEWSWIRE) -- Arhaus, Inc. (“Arhaus” or the “Company”) (NASDAQ: ARHS), a premium home furnishing brand known for responsibly sourced, artisan-crafted products and heirloom-quality design,…
PDF Version
BOSTON HEIGHTS, Ohio, May 07, 2026 (GLOBE NEWSWIRE) -- Arhaus, Inc. (“Arhaus” or the “Company”) (NASDAQ: ARHS), a premium home furnishing brand known for responsibly sourced, artisan-crafted products and heirloom-quality design, reported first quarter results for the period ended March 31, 2026.
First Quarter 2026 HighlightsCompared to the first quarter of 2025:
- Net revenue increased 0.9% to $314 million
- Gross margin decreased 1.0% to $114 million
- Selling, general and administrative expenses increased 1.9% to $112 million
- Net and comprehensive income decreased 54.5% to $2 million
- Adjusted EBITDA decreased 3.1% to $18 million
- Comparable Delivered Sales(1) decreased 1.7%
- Comparable Written Sales(2) decreased 5.7%
John Reed, Co-Founder and Chief Executive Officer, said:
“We achieved the highest first-quarter net revenue in Arhaus history, reflecting the strength of our operating model, the resilience of our client base, and the disciplined execution of our team. While broader macro uncertainty created some near-term pressure on Comparable Written Sales, we saw meaningful improvement as the quarter progressed and remain confident in our long-term strategy, differentiated product leadership, and the significant opportunity ahead for Arhaus.”
**Michael Lee, Chief Financial Officer, said:
**“While the operating environment is challenging, we remain disciplined in how we are managing the business, with a focus on controlling costs, prioritizing high-return investments, and maintaining flexibility while continuing to invest in the long-term growth of Arhaus. Based on the strength of our business and improving Comparable Written Sales trends, we remain confident in our full-year 2026 outlook and we are reaffirming our guidance. We want to thank our teams across Arhaus for their continued dedication and execution, and our shareholders for their ongoing support as we remain focused on driving long-term shareholder value.”
**Business Highlights
**First quarter net revenue was $314 million, an increase of 0.9% year-over-year and above the midpoint of the Company’s guidance range.
Comparable Delivered Sales(1) decreased 1.7% in the first-quarter, above the midpoint of the Company’s guidance range. Comparable Written Sales(2) decreased 5.7% in the first-quarter.
**Showroom Highlights
**At the end of the first quarter of 2026, Arhaus operated 107 Showrooms across 31 states. In April, the Company opened a new Traditional Showroom in Ashburn, Virginia and in early May, Arhaus completed an expansion of its Park Meadows, Colorado showroom.
For 2026, the Company continues to expect to complete approximately 10 to 14 Total Showroom Projects(3), consisting of 4 to 6 new openings and 6 to 8 relocations, renovations, or expansions, representing Net Unit Growth(4) of mid-single-digits for the year.
**Balance Sheet and Liquidity
**As of March 31, 2026, the Company reported the following:
- No long-term debt.
- Cash and cash equivalents totaled $177 million, a 30.1% decrease from December 31, 2025 to March 31, 2026. This primarily reflects the $49 million special cash dividend paid in March.
- Net merchandise inventory of $369 million, a 9.0% increase from December 31, 2025 to March 31, 2026.
- Client deposits of $271 million, a 15.0% increase from December 31, 2025 to March 31, 2026.
- Net cash used in operating activities totaled $10 million for the three months ended March 31, 2026.
- Net cash used in investing activities was $16 million for the three months ended March 31, 2026. Company-funded capital expenditures(5) were $13 million and landlord contributions were $3 million.
Special Cash Dividend On February 17, 2026, the Board of Directors of the Company declared a special cash dividend on the Company’s Class A and Class B common stock of $0.35 per share. This was paid on March 31, 2026, to shareholders of record at the close of business on March 18, 2026.
**Outlook
**The Company is reaffirming its full-year 2026 outlook and providing second quarter 2026 guidance. While the Company continues to operate in a challenging environment, the Company remains confident in its full-year 2026 outlook.
As a reminder, the Company is also lapping a particularly strong second quarter in the prior year, where the Company successfully brought operations of its Dallas Distribution Center in-house which ramped ahead of schedule. This transition enabled the Company to convert strong first quarter demand into net revenue more efficiently and at a higher volume than expected. As a result, second quarter performance should be viewed in the context of this strong prior-year comparison.
Additionally, the Company’s current outlook does not include any benefit from potential IEEPA tariff refunds. As there is greater clarity and confirmation regarding those refunds, the Company will evaluate any impact and update guidance if necessary.
|
|
|
|
|
|
|
Full-Year 2026 |
|
Q2 2026 |
| Net revenue |
|
$1.43 billion to $1.47 billion |
|
$350 million to $370 million |
| Net revenue growth |
|
3.7% to 6.6% |
|
(2.4)% to 3.2% |
| Comparable delivered sales(1) |
|
0% to 3% |
|
(5)% to 0% |
| Net income(6) |
|
$66 million to $75 million |
|
$19 million to $24 million |
| Adjusted EBITDA(7) |
|
$150 million to $161 million |
|
$40 million to $49 million |
|
|
|
|
|
| Other Estimates |
|
|
|
|
| Company-funded capital expenditures(5) |
|
$70 million to $90 million |
|
|
| Depreciation & amortization |
|
$50 million to $55 million |
|
|
| Fully diluted shares |
|
~ 142 million |
|
|
| Effective tax rate |
|
~ 28.2% |
|
|
| Showroom openings |
|
4 to 6 new Showrooms |
|
|
| Total Showroom Projects(3) |
|
10 to 14 Showroom Projects |
|
|
| Net Unit Growth(4) |
|
Mid-Single-Digit |
|
|
|
|
|
|
|
(1) Comparable Delivered Sales previously referred to as “Comparable Growth” is a key performance indicator and is defined as the year-over-year percentage change of the dollar value of orders delivered (based on purchase price), net of the dollar value of returns (based on amount credited to client), from our comparable Showrooms and eCommerce, including through our catalogs and other mailings.
(2) Comparable Written Sales previously referred to as “Demand Comparable Growth” is a key performance indicator and is defined as the year-over-year percentage change of written sales from our comparable Showrooms and eCommerce, including through our catalogs and other mailings.
(3) Total Showroom Projects is defined as the number of Showroom projects completed during the period, including new Showroom openings, relocations, remodels, and expansions. The Company considers all Showroom projects integral to its long-term growth strategy, with each evaluated based on strategic relevance and expected return on investment.
(4) Net Unit Growth reflects the percentage change in total Showroom count during the period, calculated as new Showroom openings net of Showroom closures or relocations that do not increase total unit count.
(5) Company-funded capital expenditures is defined as total net cash used in investing activities less landlord contributions.
(6) U.S. GAAP net income (loss).
(7) We have not reconciled guidance for Adjusted EBITDA to the corresponding GAAP financial measure because we do not provide guidance for the various reconciling items. These items include, but are not limited to, future share-based compensation expense, income taxes, interest income, and transaction costs. We are unable to provide guidance for these reconciling items because we cannot determine their probable significance, as certain items are outside of our control and cannot be reasonably predicted due to the fact that these items could vary significantly from period to period. Accordingly, reconciliations to the corresponding GAAP financial measure is not available without unreasonable effort.
**Updates to Disclosures and Reporting
**Investor Relations Materials
An Investor Relations presentation has been issued in conjunction with the Company’s first-quarter results in alignment with the Company’s earnings. This can be accessed online at http://ir.arhaus.com
.
Comparable Sales Metrics
As previously shared, the Company refined the naming and presentation of its comparable sales metrics.
Comparable Delivered Sales(1) previously referred to as “Comparable Growth” is a key performance indicator and is defined as the year-over-year percentage change of the dollar value of orders delivered (based on purchase price), net of the dollar value of returns (based on amount credited to client), from our comparable Showrooms and eCommerce, including through our catalogs and other mailings.
Comparable Written Sales(2) previously referred to as “Demand Comparable Growth” is a key performance indicator and is defined as the year-over-year percentage change of written sales from our comparable Showrooms and eCommerce, including through our catalogs and other mailings.
Showroom Growth and Real Estate Disclosures
As previously shared, the Company has made enhancements to its Showroom growth and real estate disclosures. These updates provide additional context on the Company’s long-term Showroom strategy and economics.
Additional detail is provided in the Company’s Investor Relations presentation which is available on the Company’s website at http://ir.arhaus.com
. Supporting schedules are included in this earnings release.
Additional Schedules
As previously shared, the Company is providing additional schedules. Supplemental schedules related to Showroom growth, real estate activity, and comparable sales metrics are included in the earnings release and Investor Relations presentation.
**Conference Call
**You are invited to listen to Arhaus’ conference call to discuss the first quarter 2026 financial results scheduled for today, May 7, 2026, at 8:30 a.m. Eastern Time. The call will be available over the Internet on our website (http://ir.arhaus.com
) or by dialing (877) 407-3982 within the U.S., or 1 (201) 493-6780, outside the U.S. The conference ID number is 13758506.
A recorded replay of the conference call will be available within approximately three hours of the conclusion of the call and can be accessed online at http://ir.arhaus.com
for approximately twelve months.
**About Arhaus
**Founded in 1986 by Chief Executive Officer John Reed and his father, Arhaus is a premium home furnishings brand built on a simple idea: furniture and décor should be responsibly sourced, lovingly made, and built to last. Arhaus operates a vertically integrated model, designing and sourcing products directly from skilled artisans and carefully selected manufacturing partners around the world, including domestic upholstery production at its own North Carolina manufacturing facility. This approach enables Arhaus to offer a highly exclusive and customizable assortment of heirloom-quality furniture and décor designed to be used and enjoyed for generations.
With more than 100 Showroom locations across the United States, Arhaus’ integrated omni-channel model connects every client touchpoint, from Showroom and interior design to eCommerce and catalog, allowing Arhaus to meet clients wherever and however they choose to shop while delivering a highly personalized client-first experience from discovery through delivery.