November 05, 2026
-- SaaS and license revenue increased 9.0% to $191.2 million --
-- GAAP net income was $34.3 million --
-- Non-GAAP adjusted EBITDA was $66.2 million --
TYSONS, Va.--(BUSINESS WIRE)-- Alarm.com Holdings, Inc. (Nasdaq: ALRM), the leading platform for intelligently connected properties, today reported financial results for its third quarter ended September 30, 2026. Alarm.com also provided its financial outlook for SaaS and license revenue for the fourth quarter of 2026 and increased its guidance for the full year of 2026.
Third Quarter 2026 Financial Results as Compared to Third Quarter 2025
- SaaS and license revenue increased 9.0% to $191.2 million, compared to $175.4 million.
- Total revenue increased 9.0% to $279.4 million, compared to $256.4 million.
- GAAP net income was $34.3 million, compared to $35.1 million.
- GAAP net income attributable to common stockholders was $34.4 million, or $0.66 per diluted share, compared to $35.3 million, or $0.65 per diluted share.
- Non-GAAP adjusted EBITDA(*) was $66.2 million, compared to $55.5 million(^).
- Non-GAAP adjusted net income attributable to common stockholders(*) was $48.3 million, or $0.90 per diluted share, compared to $39.5 million(^), or $0.71 per diluted share(^).
Balance Sheet and Cash Flow
- Total cash and cash equivalents was $534.7 million as of September 30, 2026, compared to $960.6 million as of December 31, 2025. The decrease in cash and cash equivalents was primarily due to the payment and full settlement of the $500.0 million aggregate principal amount of the 0% convertible senior notes on January 14, 2026.
- For the nine months ended September 30, 2026, cash flows from operating activities was $167.6 million, compared to $117.4 million for the nine months ended September 30, 2025. For the nine months ended September 30, 2026, non-GAAP free cash flow(*) was $156.3 million, compared to $102.0 million for the nine months ended September 30, 2025.
Recent Business Highlights
- Acquired CellGate, expanding Alarm.com’s reach through an established fence and gate channel: CellGate provides cellular-powered gate access control and video intercom solutions for commercial, small business, multifamily, ranches and estate properties. The acquisition is expected to add a growing recurring revenue business with established distributor relationships, complementing Alarm.com’s connected property offerings.
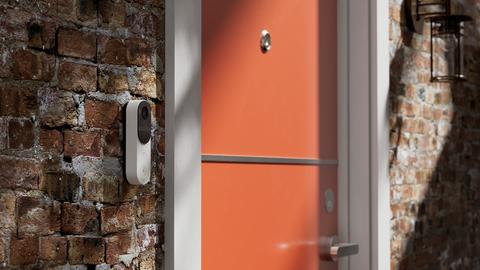
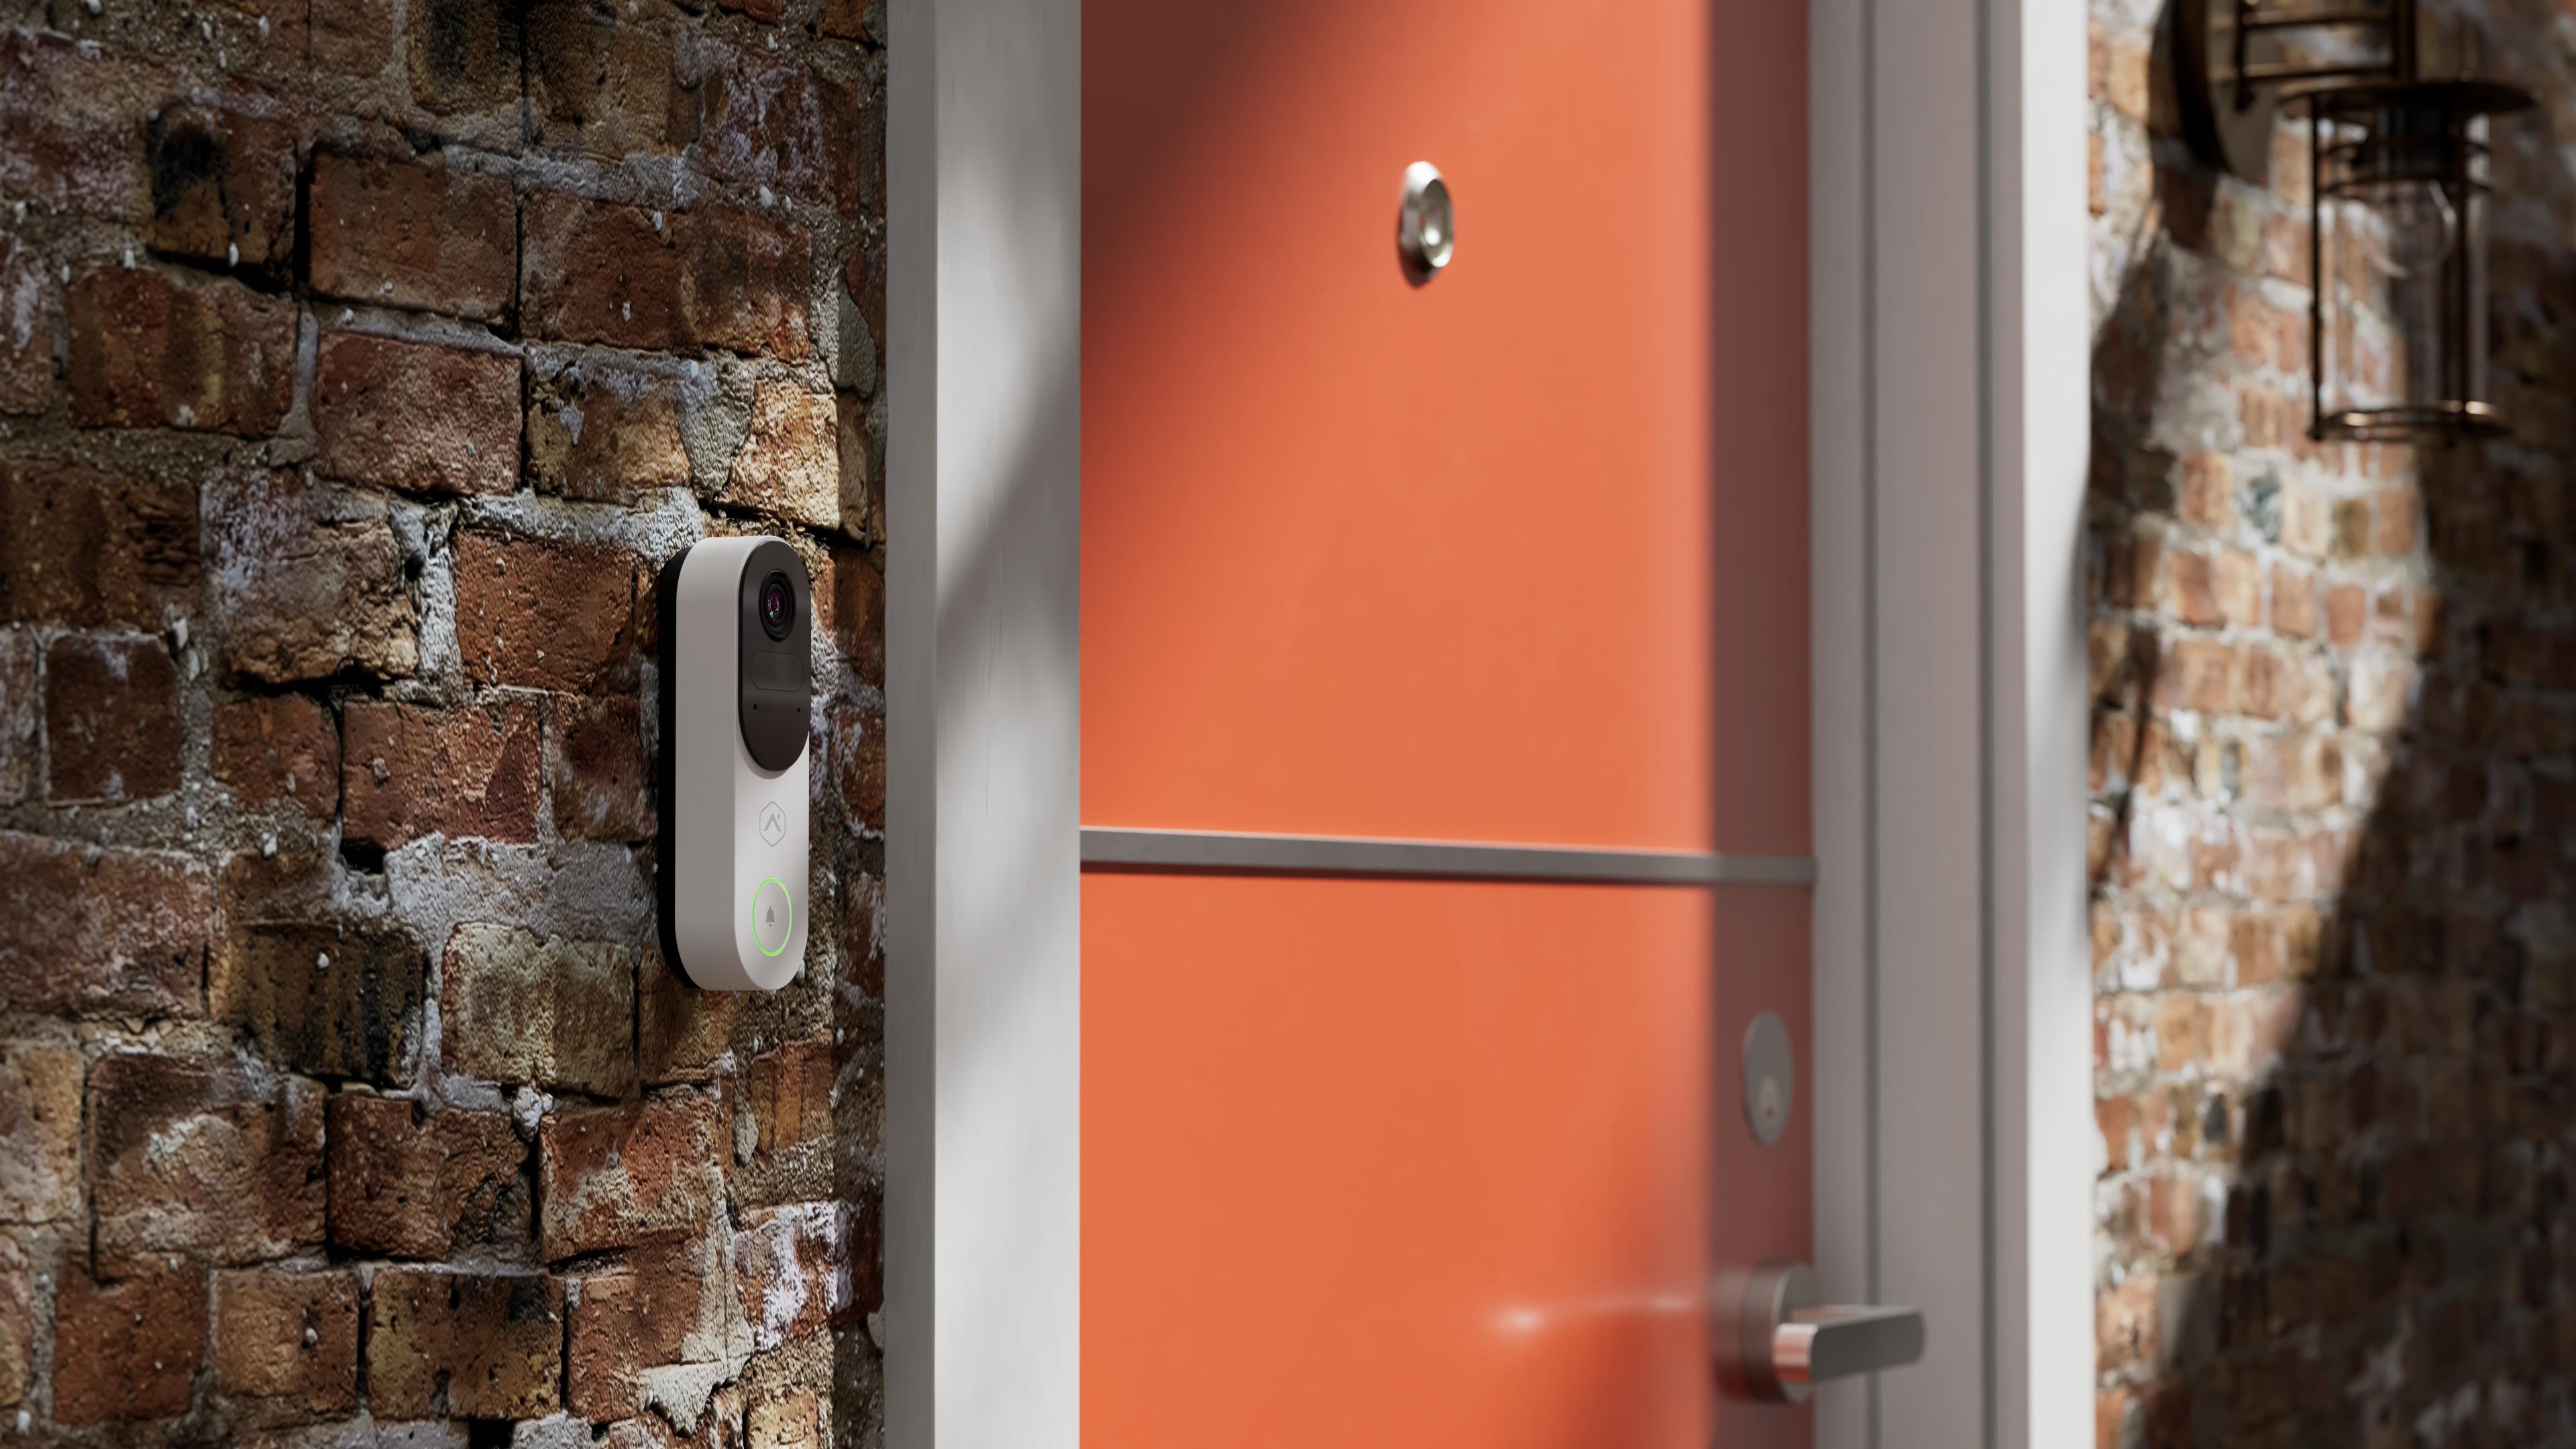
- Expanded video portfolio with new doorbell and indoor cameras: The new offerings give service provider partners more options to match customer installation requirements and bring Alarm.com’s video analytics and proactive deterrence services to more locations. The new products include a new battery-powered video doorbell that supports additional video analytics capabilities and two new indoor cameras, including a premium model with 4MP resolution, an integrated illumination for deterrence and a physical privacy shutter.
- Expanded AI-powered video intelligence: The release of AI Video Clip Summaries gives commercial and residential subscribers more informative video notifications through concise, plain-language descriptions of recorded video content. This helps subscribers quickly understand what happened without reviewing every video clip.
Financial Outlook
Alarm.com is providing its outlook for SaaS and license revenue for the fourth quarter of 2026 and increasing its guidance for the full year of 2026 based upon current management expectations.
For the fourth quarter of 2026:
- SaaS and license revenue is expected to be in the range of $194.6 million to $194.8 million.
For the full year of 2026:
- SaaS and license revenue is now expected to be in the range of $756.1 million to $756.3 million, up $12.2 million from the midpoint of the full year of 2026 SaaS and license revenue guidance provided in February 2026.
- Total revenue is expected to be in the range of $1.1011 billion to $1.1113 billion, which includes anticipated hardware and other revenue in the range of $345.0 million to $355.0 million.
- Non-GAAP adjusted EBITDA expectations are being increased to a range of $227.0 million to $229.0 million.
- Non-GAAP adjusted net income attributable to common stockholders is expected to be in the range of $161.2 million to $162.6 million, based on an estimated tax rate of 21.0%.
- Based on an expected 56.3 million weighted average diluted shares outstanding, non-GAAP adjusted net income attributable to common stockholders is expected to be $3.02 to $3.04 per diluted share.
The 2026 guidance provided above is forward-looking in nature. Actual results may differ materially. See the cautionary note regarding “Forward-Looking Statements” below. The guidance provided above is based on expectations as of the date of this press release and Alarm.com undertakes no obligation to update guidance after such date.
Conference Call and Webcast Information
Alarm.com will host a conference call to discuss its third quarter 2026 financial results and its outlook for the fourth quarter and full year of 2026. A live audio webcast is scheduled to begin at 4:30 p.m. ET on November 5, 2026. To participate on the live call, analysts and investors should pre-register to obtain a dial-in number and individual passcode by visiting: https://register-conf.media-server.com/register/BI318977ee3f384df7843a4b93571f0a02 . Alarm.com will also offer a live and archived webcast of the conference call accessible on Alarm.com’s Investor Relations website at http://investors.alarm.com . The information contained on any referenced website is not incorporated herein.
About Alarm.com Holdings, Inc.
Alarm.com is the leading platform for intelligently connected properties. Millions of homeowners and businesses rely on Alarm.com's technology to secure, monitor and manage their environments from anywhere. Our comprehensive suite of solutions — including security, video surveillance, access control, active shooter detection, intelligent automation, energy management and wellness — is delivered exclusively through a trusted network of thousands of professional service providers and commercial integrators across North America and worldwide. Alarm.com's common stock is traded on Nasdaq under the ticker symbol ALRM. Alarm.com delivers serious security. To learn more, visit www.alarm.com .
| (*) Reconciliations of the non-GAAP measures are set forth at the end of this press release. |
| (^) During the first quarter of 2026, the Company revised its definition of certain non-GAAP metrics to exclude gains and losses on investments with readily determinable fair value. Comparable information for the prior periods presented has been updated to conform to the current presentation. Further details are set forth at the end of this press release. |
Non-GAAP Financial Measures
To supplement our consolidated selected financial data presented on a basis consistent with GAAP, this press release contains certain non-GAAP financial measures, including non-GAAP adjusted EBITDA, non-GAAP adjusted net income, non-GAAP adjusted net income attributable to common stockholders, non-GAAP adjusted net income attributable to common stockholders per share and non-GAAP free cash flow. We have included non-GAAP measures in this press release because they are financial, operating or liquidity measures used by our management to (i) understand and evaluate our core operating performance and trends and generate future operating plans, (ii) make strategic decisions regarding the allocation of capital and investments in initiatives that are focused on cultivating new markets for our solutions and (iii) provide useful information to management about the amount of cash generated by the business after necessary capital expenditures. We also use non-GAAP adjusted EBITDA as a performance measure under our executive bonus plan. Further, we believe that these non-GAAP measures of our financial results provide useful information to investors and others in understanding and evaluating our results of operations, business trends and financial condition. While we believe the use of these non-GAAP measures provides useful information to investors and management in analyzing our financial performance, non-GAAP measures have inherent limitations in that they do not reflect all of the amounts and transactions that are included in our financial statements prepared in accordance with GAAP. Non-GAAP measures do not serve as an alternative to GAAP nor do we consider our non-GAAP measures in isolation. Accordingly, we present non-GAAP financial measures only in connection with GAAP results. We urge investors to consider non-GAAP measures only in conjunction with our GAAP financials and to review the reconciliation of our non-GAAP financial measures to the most directly comparable GAAP financial measures, which are included in this press release.
We consider non-GAAP free cash flow to be a liquidity measure, which we define as cash flows from operating activities less purchases of property and equipment.
With respect to our expectations under “Financial Outlook” above, reconciliation of non-GAAP adjusted EBITDA and non-GAAP adjusted net income attributable to common stockholders guidance to the closest corresponding GAAP measure is not available without unreasonable efforts on a forward-looking basis due to the high variability, complexity and low visibility with respect to the charges excluded from these non-GAAP measures. In particular, non-ordinary course litigation expense, acquisition-related expense and tax adjustments can have unpredictable fluctuations based on unforeseen activity that is out of our control and/or cannot reasonably be predicted. We expect the above charges to have a significant and potentially highly variable impact on our future GAAP financial results.
We exclude one or more of the following items from non-GAAP financial and operating measures:
Interest expense: We record interest expense primarily related to the January 2021 issuance of $500.0 million aggregate principal amount of 0% convertible senior notes due January 15, 2026, or the 2026 Notes, and the May 2024 issuance of $500.0 million aggregate principal amount of 2.25% convertible senior notes due June 1, 2029, or the 2029 Notes. We exclude interest expense in calculating our non-GAAP adjusted EBITDA. For non-GAAP adjusted net income, non-GAAP adjusted net income attributable to common stockholders and non-GAAP adjusted net income attributable to common stockholders per share, basic and diluted, we do not exclude interest expense other than the interest expense related to the amortization of debt issuance costs related to the 2026 Notes and 2029 Notes as discussed below.
Interest income and certain activity within other income / (expense), net: We exclude interest income as well as certain activity within other income / (expense), net including gains, losses or impairments on investments with readily determinable fair values and without readily determinable fair values and on other assets, gains on settlement fees as well as losses on the early extinguishment of the debt, when applicable, from our non-GAAP financial measures because we do not consider it part of our ongoing results of operations.
Provision for income taxes: We exclude the impact related to our provision for income taxes from our non-GAAP adjusted EBITDA calculation. We do not consider this tax adjustment to be part of our ongoing results of operations.
Loss / (income) from equity method investments, net: We exclude loss / (income) from equity method investments, net from our non-GAAP financial measures because we do not consider it part of our ongoing results of operations.
Amortization expense: GAAP requires that operating expenses include the amortization of acquired intangible assets, which principally include acquired customer relationships, developed technology and trade names. We exclude amortization of intangibles from our non-GAAP financial measures because we do not consider amortization expense when we evaluate our ongoing business operations, nor do we factor amortization expense into our evaluation of potential acquisitions, or our measurement of the performance of those acquisitions. We believe that the exclusion of amortization expense enables the comparison of our performance to other companies in our industry as other companies may be more or less acquisitive than we are and therefore, amortization expense may vary significantly by company based on their acquisition history. Although we exclude amortization of acquired intangible assets from our non-GAAP financial measures, management believes that it is important for investors to understand that such intangible assets were recorded as part of purchase accounting and contribute to revenue generation.
Depreciation expense: We record depreciation primarily for investments in property and equipment. We exclude depreciation in calculating non-GAAP adjusted EBITDA because we do not consider depreciation when we evaluate our ongoing business operations. For non-GAAP adjusted net income, non-GAAP adjusted net income attributable to common stockholders and non-GAAP adjusted net income attributable to common stockholders per share, basic and diluted, we do not exclude depreciation.
Amortization of debt issuance costs: We record amortization of debt issuance costs related to the 2026 Notes and 2029 Notes as interest expense. We exclude amortization of debt issuance costs from our non-GAAP adjusted net income, non-GAAP adjusted net income attributable to common stockholders and non-GAAP adjusted net income attributable to common stockholders per share, basic and diluted, because we believe that the exclusion of this non-cash interest expense will provide for more meaningful information about our financial performance.
Stock-based compensation expense: We exclude stock-based compensation expense, which relates to restricted stock units and other forms of equity incentives primarily awarded to employees of Alarm.com, because they are non-cash charges that we do not consider when assessing the operating performance of our business. Additionally, the determination of stock-based compensation expense can be calculated using various methodologies and is dependent upon subjective assumptions and other factors that vary on a company-by-company basis. Therefore, we believe that excluding stock-based compensation expense from our non-GAAP financial measures improves the comparability of our results to the results of other companies in our industry.
Acquisition-related expense: Included in operating expenses are incremental costs directly related to business and asset acquisitions as well as changes in the fair value of contingent consideration liabilities, when applicable. We exclude acquisition-related expense from our non-GAAP financial measures because we believe that the exclusion of this expense allows us to better provide meaningful information about our operating performance, facilitates comparisons to our historical operating results, improves the comparability of our results to the results of other companies in our industry, and ultimately, we believe helps investors better understand the acquisition-related expense and the effects of the transaction on our results of operations.
Litigation expense: We exclude non-ordinary course litigation expense because we do not consider legal costs and settlement fees incurred and received in litigation and litigation-related matters of non-ordinary course lawsuits and other disputes, particularly costs incurred in ongoing intellectual property litigation, to be indicative of our core operating performance. We do not adjust for ordinary course legal expenses, including those expenses resulting from maintaining and enforcing our intellectual property portfolio and license agreements.
Forward-Looking Statements
This press release includes forward-looking statements within the meaning of the Private Securities Litigation Reform Act of 1995. These forward-looking statements may be identified by their use of terms and phrases such as “anticipate,” “believe,” “continue,” “designed,” “enable,” “ensure,” “expect,” “intend,” “will,” and other similar terms and phrases, and such forward-looking statements include, but are not limited to, the statements regarding the Company’s opportunities, positioning, the benefits of recently launched offerings, acquisitions and investments, and the Company’s guidance for the fourth quarter and full year of 2026 described under “Financial Outlook” above and key assumptions related thereto. The events described in these forward-looking statements involve known and unknown risks, uncertainties and other factors that could cause actual results to differ materially from the results anticipated by these forward-looking statements, including, but not limited to: impact of the global economic uncertainty and financial market conditions caused by significant worldwide events, including public health crises, and geopolitical upheaval (including the ongoing conflicts in Ukraine and in the Middle East and surrounding areas), disruptions to global supply chains, fluctuations in interest rates, tariffs, risk of recession and inflation (collectively, the Macroeconomic Conditions) on the Company's business, results of operations and financial condition, including on the Company's hardware sales and Software-as-a-Service, or SaaS, and license revenue growth rate; the Company's business strategy, plans and objectives for future operations; continued enhancements of the Company's platform and offerings; the potential impact of trade policies and new or increased tariffs on the Company's cost of hardware revenue and hardware revenue margins; and the Company's future financial and business performance; and other risks and uncertainties discussed in the “Risk Factors” section of the Company’s Quarterly Report on Form 10-Q filed with the Securities and Exchange Commission on August 6, 2026 and other subsequent filings the Company makes with the Securities and Exchange Commission from time to time, including its Form 10-Q for the quarter ended September 30, 2026. In addition, the forward-looking statements included in this press release represent the Company’s views and expectations as of the date hereof and are based on information currently available to the Company. The Company anticipates that subsequent events and developments may cause the Company’s views to change. However, while the Company may elect to update these forward-looking statements at some point in the future, the Company specifically disclaims any obligation to do so except as required by law. These forward-looking statements should not be relied upon as representing the Company’s views as of any date subsequent to the date hereof.
| ALARM.COM HOLDINGS, INC. | |||||||||||||||
| Consolidated Statements of Operations | |||||||||||||||
| (in thousands, except share and per share data) | |||||||||||||||
| (unaudited) | |||||||||||||||
| Three Months Ended September 30, | **Nine Months Ended **September 30, | ||||||||||||||
| 2026 | 2025 | 2026 | 2025 | ||||||||||||
| Revenue: | |||||||||||||||
| SaaS and license revenue | $ | 191,163 | $ | 175,372 | $ | 561,465 | $ | 509,165 | |||||||
| Hardware and other revenue | 88,275 | 81,028 | 260,900 | 240,365 | |||||||||||
| Total revenue | 279,438 | 256,400 | 822,365 | 749,530 | |||||||||||
| Cost of revenue(1): | |||||||||||||||
| Cost of SaaS and license revenue | 29,438 | 24,233 | 87,250 | 69,454 | |||||||||||
| Cost of hardware and other revenue | 63,224 | 63,329 | 191,576 | 183,804 | |||||||||||
| Total cost of revenue | 92,662 | 87,562 | 278,826 | 253,258 | |||||||||||
| Operating expenses: | |||||||||||||||
| Sales and marketing | 33,386 | 29,498 | 100,799 | 89,183 | |||||||||||
| General and administrative | 31,396 | 27,889 | 95,496 | 81,974 | |||||||||||
| Research and development | 69,726 | 66,637 | 212,793 | 204,074 | |||||||||||
| Amortization and depreciation | 8,415 | 7,793 | 26,471 | 22,351 | |||||||||||
| Total operating expenses | 142,923 | 131,817 | 435,559 | 397,582 | |||||||||||
| Operating income | 43,853 | 37,021 | 107,980 | 98,690 | |||||||||||
| Interest expense | (3,548 | ) | (4,326 | ) | (10,763 | ) | (12,961 | ) | |||||||
| Interest income | 4,878 | 11,274 | 14,300 | 35,453 | |||||||||||
| Other income / (expense), net | 1,521 | 3,538 | (4,724 | ) | 703 | ||||||||||
| Income before income taxes | 46,704 | 47,507 | 106,793 | 121,885 | |||||||||||
| Provision for income taxes | 11,912 | 15,200 | 25,505 | 27,965 | |||||||||||
| Loss / (income) from equity method investments, net | 496 | (2,793 | ) | (598 | ) | (3,109 | ) | ||||||||
| Net income | 34,296 | 35,100 | 81,886 | 97,029 | |||||||||||
| Net loss attributable to redeemable noncontrolling interests | 140 | 238 | 379 | 811 | |||||||||||
| Net income attributable to common stockholders | $ | 34,436 | $ | 35,338 | $ | 82,265 | $ | 97,840 | |||||||
| Per share information attributable to common stockholders: | |||||||||||||||
| Net income attributable to common stockholders per share: | |||||||||||||||
| Basic | $ | 0.70 | $ | 0.71 | $ | 1.67 | $ | 1.97 | |||||||
| Diluted | $ | 0.66 | $ | 0.65 | $ | 1.61 | $ | 1.80 | |||||||
| Weighted average common shares outstanding: | |||||||||||||||
| Basic | 49,213,438 | 49,896,117 | 49,379,098 | 49,788,187 | |||||||||||
| Diluted | 55,982,554 | 58,461,103 | 56,162,705 | 59,630,170 | |||||||||||
| ______________________________ | |||||||||||||||
| (1) Exclusive of amortization and depreciation shown in operating expenses below. | |||||||||||||||
| Stock-based compensation expense data: | Three Months Ended September 30, | **Nine Months Ended **September 30, | |||||||||||||
| 2026 | 2025 | 2026 | 2025 | ||||||||||||
| Sales and marketing | $ | 587 | $ | 642 | $ | 1,921 | $ | 1,742 | |||||||
| General and administrative | 2,903 | 2,721 | 9,035 | 8,167 | |||||||||||
| Research and development | 4,531 | 4,858 | 12,690 | 16,704 | |||||||||||
| Total stock-based compensation expense | $ | 8,021 | $ | 8,221 | $ | 23,646 | $ | 26,613 | |||||||
| ALARM.COM HOLDINGS, INC. | |||||||
| Consolidated Balance Sheets | |||||||
| (in thousands, except share and per share data) | |||||||
| (unaudited) | |||||||
| September 30, 2026 | December 31, 2025 | ||||||
| Assets | |||||||
| Current assets: | |||||||
| Cash and cash equivalents | $ | 534,743 | $ | 960,584 | |||
| Accounts receivable, net | 151,322 | 141,852 | |||||
| Inventory | 100,791 | 94,429 | |||||
| Other current assets, net | 79,926 | 75,646 | |||||
| Total current assets | 866,782 | 1,272,511 | |||||
| Property and equipment, net | 66,216 | 64,799 | |||||
| Intangible assets, net | 81,997 | 99,352 | |||||
| Goodwill | 224,494 | 224,987 | |||||
| Deferred tax assets | 141,246 | 152,255 | |||||
| Operating lease right-of-use assets | 50,933 | 52,636 | |||||
| Investments in unconsolidated entities | 229,169 | 226,931 | |||||
| Other assets, net | 44,306 | 43,120 | |||||
| Total assets | $ | 1,705,143 | $ | 2,136,591 | |||
| Liabilities, redeemable noncontrolling interests and stockholders’ equity | |||||||
| Current liabilities: | |||||||
| Accounts payable, accrued expenses and other current liabilities | $ | 120,119 | $ | 107,195 | |||
| Accrued compensation | 30,304 | 31,126 | |||||
| Deferred revenue | 20,093 | 16,428 | |||||
| Convertible senior notes, net | — | 499,867 | |||||
| Operating lease liabilities | 8,942 | 8,524 | |||||
| Total current liabilities | 179,458 | 663,140 | |||||
| Deferred revenue | 13,920 | 13,456 | |||||
| Convertible senior notes, net, noncurrent | 491,829 | 489,641 | |||||
| Operating lease liabilities | 66,186 | 67,609 | |||||
| Other liabilities | 11,976 | 11,735 | |||||
| Total liabilities | 763,369 | 1,245,581 | |||||
| Redeemable noncontrolling interests | 48,256 | 42,847 | |||||
| Stockholders’ equity | |||||||
| Preferred stock, $0.001 par value, 10,000,000 shares authorized; no shares issued and outstanding as of September 30, 2026 and December 31, 2025 | — | — | |||||
| Common stock, $0.01 par value, 300,000,000 shares authorized; 54,129,457 and 53,540,939 shares issued; and 48,980,592 and 49,630,714 shares outstanding as of September 30, 2026 and December 31, 2025, respectively | 542 | 536 | |||||
| Additional paid-in capital | 572,404 | 549,913 | |||||
| Treasury stock, at cost; 5,148,865 and 3,910,225 shares as of September 30, 2026 and December 31, 2025, respectively | (286,311 | ) | (227,852 | ) | |||
| Accumulated other comprehensive income | 1,742 | 2,690 | |||||
| Retained earnings | 605,141 | 522,876 | |||||
| Total stockholders’ equity | 893,518 | 848,163 | |||||
| Total liabilities, redeemable noncontrolling interests and stockholders’ equity | $ | 1,705,143 | $ | 2,136,591 | |||
| ALARM.COM HOLDINGS, INC. | |||||||
| Consolidated Statements of Cash Flows | |||||||
| (in thousands) | |||||||
| (unaudited) | |||||||
| Nine Months Ended September 30, | |||||||
| Cash flows from operating activities: | 2026 | 2025 | |||||
| Net income | $ | 81,886 | $ | 97,029 | |||
| Adjustments to reconcile net income to net cash flows from operating activities: | |||||||
| Provision for credit losses on accounts receivable | 1,635 | 1,399 | |||||
| Reserve for product returns | 1,477 | 2,444 | |||||
| Provision for credit losses on notes receivable | 2 | 748 | |||||
| Amortization and depreciation | 26,471 | 22,351 | |||||
| Amortization of debt issuance costs | 2,321 | 4,513 | |||||
| Amortization of operating leases | 11,268 | 11,657 | |||||
| Deferred income taxes | 12,758 | 18,713 | |||||
| Stock-based compensation | 23,646 | 26,613 | |||||
| Distributions on investments in unconsolidated entities | 11,281 | 4,014 | |||||
| Loss / (gain) on investments in unconsolidated entities | 3,080 | (3,077 | ) | ||||
| Other adjustments | 1,074 | 794 | |||||
| Changes in operating assets and liabilities (net of business acquisitions): | |||||||
| Accounts receivable | (12,590 | ) | 11,645 | ||||
| Inventory | (6,503 | ) | (3,485 | ) | |||
| Other current and non-current assets | (8,204 | ) | (19,858 | ) | |||
| Accounts payable and other current liabilities | 25,493 | (48,290 | ) | ||||
| Deferred revenue | 4,129 | 1,404 | |||||
| Operating lease liabilities | (11,894 | ) | (9,884 | ) | |||
| Other liabilities | 255 | (1,329 | ) | ||||
| Cash flows from operating activities | 167,585 | 117,401 | |||||
| Cash flows used in investing activities: | |||||||
| Business acquisitions, net of cash acquired | — | (35,733 | ) | ||||
| Additions to property and equipment | (11,322 | ) | (15,421 | ) | |||
| Issuances of notes receivable and revolving loan | (6,142 | ) | (24,305 | ) | |||
| Receipt of payments on notes receivable | 90 | 86 | |||||
| Capitalized software development costs | (825 | ) | (1,032 | ) | |||
| Proceeds from sale of investments in unconsolidated entities | 6,039 | 1,459 | |||||
| Purchase of investments in unconsolidated entities | (16,424 | ) | (175,057 | ) | |||
| Purchases of other intangible assets | (90 | ) | — | ||||
| Cash flows used in investing activities | (28,674 | ) | (250,003 | ) | |||
| Cash flows used in financing activities: | |||||||
| Repayments of convertible senior notes | (500,000 | ) | — | ||||
| Payments of deferred consideration for acquisitions and investments in unconsolidated entities | (13,354 | ) | (1,741 | ) | |||
| Purchases of treasury stock, including transaction costs | (58,459 | ) | (22,419 | ) | |||
| Purchases of redeemable noncontrolling interest | — | (750 | ) | ||||
| Issuances of common stock from equity-based plans | 5,031 | 3,440 | |||||
| Cash flows used in financing activities | (566,782 | ) | (21,470 | ) | |||
| Effect of exchange rate changes on cash, cash equivalents and restricted cash | (61 | ) | (161 | ) | |||
| Net decrease in cash, cash equivalents and restricted cash | (427,932 | ) | (154,233 | ) | |||
| Cash, cash equivalents and restricted cash at beginning of the period | 968,807 | 1,229,132 | |||||
| Cash, cash equivalents and restricted cash at end of the period | $ | 540,875 | $ | 1,074,899 | |||
| Reconciliation of cash, cash equivalents and restricted cash: | |||||||
| Cash and cash equivalents | $ | 534,743 | $ | 1,066,583 | |||
| Restricted cash included in other current assets, net, and other assets, net | 6,132 | 8,316 | |||||
| Total cash, cash equivalents and restricted cash | $ | 540,875 | $ | 1,074,899 | |||
| ALARM.COM HOLDINGS, INC. | |||||||||||||||
| Reconciliation of Non-GAAP Measures | |||||||||||||||
| (in thousands) | |||||||||||||||
| (unaudited) | |||||||||||||||
| Three Months Ended September 30, | **Nine Months Ended **September 30, | ||||||||||||||
| 2026 | 2025 | 2026 | 2025 | ||||||||||||
| Non-GAAP adjusted EBITDA: | |||||||||||||||
| Net income | $ | 34,296 | $ | 35,100 | $ | 81,886 | $ | 97,029 | |||||||
| Adjustments: | |||||||||||||||
| Interest expense, interest income and certain activity within other expense, net1 | (3,169 | ) | (10,686 | ) | 141 | (22,460 | ) | ||||||||
| Provision for income taxes | 11,912 | 15,200 | 25,505 | 27,965 | |||||||||||
| Loss / (income) from equity method investments, net | 496 | (2,793 | ) | (598 | ) | (3,109 | ) | ||||||||
| Amortization and depreciation expense | 8,415 | 7,793 | 26,471 | 22,351 | |||||||||||
| Stock-based compensation expense | 8,021 | 8,221 | 23,646 | 26,613 | |||||||||||
| Acquisition-related expense | — | 898 | 92 | 958 | |||||||||||
| Litigation expense | 6,278 | 1,789 | 16,383 | 1,897 | |||||||||||
| Total adjustments | 31,953 | 20,422 | 91,640 | 54,215 | |||||||||||
| Non-GAAP adjusted EBITDA | $ | 66,249 | $ | 55,522 | $ | 173,526 | $ | 151,244 | |||||||
| Three Months Ended September 30, | **Nine Months Ended **September 30, | ||||||||||||||
| 2026 | 2025 | 2026 | 2025 | ||||||||||||
| Non-GAAP adjusted net income: | |||||||||||||||
| Net income, as reported | $ | 34,296 | $ | 35,100 | $ | 81,886 | $ | 97,029 | |||||||
| Provision for income taxes | 11,912 | 15,200 | 25,505 | 27,965 | |||||||||||
| Loss / (income) from equity method investments, net | 496 | (2,793 | ) | (598 | ) | (3,109 | ) | ||||||||
| Income before income taxes | 46,704 | 47,507 | 106,793 | 121,885 | |||||||||||
| Adjustments: | |||||||||||||||
| Interest income and certain activity within other expense, net1 | (6,717 | ) | (15,012 | ) | (10,622 | ) | (35,421 | ) | |||||||
| Amortization expense | 6,013 | 4,874 | 18,069 | 14,163 | |||||||||||
| Amortization of debt issuance costs | 735 | 1,511 | 2,321 | 4,513 | |||||||||||
| Stock-based compensation expense | 8,021 | 8,221 | 23,646 | 26,613 | |||||||||||
| Acquisition-related expense | — | 898 | 92 | 958 | |||||||||||
| Litigation expense | 6,278 | 1,789 | 16,383 | 1,897 | |||||||||||
| Total adjustments | 14,330 | 2,281 | 49,889 | 12,723 | |||||||||||
| Income taxes 2 | (12,817 | ) | (10,455 | ) | (32,903 | ) | (28,267 | ) | |||||||
| Non-GAAP adjusted net income | $ | 48,217 | $ | 39,333 | $ | 123,779 | $ | 106,341 | |||||||
| 1 During the three months ended March 31, 2026, the Company revised its definition of non-GAAP adjusted EBITDA and non-GAAP adjusted net income to exclude gains and losses on investments with readily determinable fair value, in addition to gains and losses on investments without readily determinable fair value, which the Company has historically excluded. The Company believes this change provides a consistent and useful view of its core operating performance, as such gains and losses are not reflective of the Company’s underlying business operations, are driven by market price fluctuations that are outside of management’s control and can vary significantly from period to period in ways that may obscure trends in operating results. For comparability and to conform the prior period to the current presentation, the Company has revised non-GAAP adjusted EBITDA and non-GAAP adjusted net income for the three and nine months ended September 30, 2025. As a result, the Company adjusted for losses on investments with readily determinable fair value of a gain of $3.6 million and a loss of $0.1 million during the three and nine months ended September 30, 2025, respectively, within “Interest expense, interest income and certain activity within other expense, net” and “Interest income and certain activity within other expense, net.” | |||||||||||||||
| 2 Income taxes are calculated using a rate of 21.0% for each of the three and nine months ended September 30, 2026 and 2025. The 21.0% effective tax rate for each of the three and nine months ended September 30, 2026 and 2025 excludes the income tax effect on the non-GAAP adjustments and reflects the estimated long-term corporate tax rate. | |||||||||||||||
| ALARM.COM HOLDINGS, INC. | |||||||||||||||
| Reconciliation of Non-GAAP Measures - continued | |||||||||||||||
| (in thousands) | |||||||||||||||
| (unaudited) | |||||||||||||||
| Three Months Ended September 30, | **Nine Months Ended **September 30, | ||||||||||||||
| 2026 | 2025 | 2026 | 2025 | ||||||||||||
| Non-GAAP adjusted net income attributable to common stockholders: | |||||||||||||||
| Net income attributable to common stockholders, as reported | $ | 34,436 | $ | 35,338 | $ | 82,265 | $ | 97,840 | |||||||
| Provision for income taxes | 11,912 | 15,200 | 25,505 | 27,965 | |||||||||||
| Loss / (income) from equity method investments, net | 496 | (2,793 | ) | (598 | ) | (3,109 | ) | ||||||||
| Income attributable to common stockholders before income taxes | 46,844 | 47,745 | 107,172 | 122,696 | |||||||||||
| Adjustments: | |||||||||||||||
| Interest income and certain activity within other expense, net1 | (6,717 | ) | (15,012 | ) | (10,622 | ) | (35,421 | ) | |||||||
| Amortization expense | 6,013 | 4,874 | 18,069 | 14,163 | |||||||||||
| Amortization of debt issuance costs | 735 | 1,511 | 2,321 | 4,513 | |||||||||||
| Stock-based compensation expense | 8,021 | 8,221 | 23,646 | 26,613 | |||||||||||
| Acquisition-related expense | — | 898 | 92 | 958 | |||||||||||
| Litigation expense | 6,278 | 1,789 | 16,383 | 1,897 | |||||||||||
| Total adjustments | 14,330 | 2,281 | 49,889 | 12,723 | |||||||||||
| Income taxes 2 | (12,847 | ) | (10,505 | ) | (32,983 | ) | (28,438 | ) | |||||||
| Non-GAAP adjusted net income attributable to common stockholders | $ | 48,327 | $ | 39,521 | $ | 124,078 | $ | 106,981 | |||||||
| 1 During the three months ended March 31, 2026, the Company revised its definition of non-GAAP adjusted net income attributable to common stockholders to exclude gains and losses on investments with readily determinable fair value. For comparability and to conform the prior period to the current presentation, the Company has revised non-GAAP adjusted net income attributable to common stockholders for the three and nine months ended September 30, 2025. As a result, the Company adjusted for losses on investments with readily determinable fair value of a gain of $3.6 million and a loss of $0.1 million during the three and nine months ended September 30, 2025, respectively, within “Interest income and certain activity within other expense, net.” | |||||||||||||||
| 2 Income taxes are calculated using a rate of 21.0% for each of the three and nine months ended September 30, 2026 and 2025. The 21.0% effective tax rate for each of the three and nine months ended September 30, 2026 and 2025 excludes the income tax effect on the non-GAAP adjustments and reflects the estimated long-term corporate tax rate. | |||||||||||||||
| ALARM.COM HOLDINGS, INC. | |||||||||||||||
| Reconciliation of Non-GAAP Measures - continued | |||||||||||||||
| (in thousands, except share and per share data) | |||||||||||||||
| (unaudited) | |||||||||||||||
| Three Months Ended September 30, | **Nine Months Ended **September 30, | ||||||||||||||
| 2026 | 2025 | 2026 | 2025 | ||||||||||||
| Non-GAAP adjusted net income attributable to common stockholders per share: | |||||||||||||||
| Net income attributable to common stockholders per share - basic, as reported | $ | 0.70 | $ | 0.71 | $ | 1.67 | $ | 1.97 | |||||||
| Provision for income taxes | 0.24 | 0.30 | 0.52 | 0.56 | |||||||||||
| Loss / (income) from equity method investments, net | 0.01 | (0.06 | ) | (0.01 | ) | (0.06 | ) | ||||||||
| Income attributable to common stockholders before income taxes | 0.95 | 0.95 | 2.18 | 2.47 | |||||||||||
| Adjustments: | |||||||||||||||
| Interest income and certain activity within other expense, net1 | (0.14 | ) | (0.30 | ) | (0.22 | ) | (0.71 | ) | |||||||
| Amortization expense | 0.12 | 0.10 | 0.36 | 0.28 | |||||||||||
| Amortization of debt issuance costs | 0.01 | 0.03 | 0.05 | 0.09 | |||||||||||
| Stock-based compensation expense | 0.17 | 0.16 | 0.48 | 0.53 | |||||||||||
| Acquisition-related expense | — | 0.02 | — | 0.02 | |||||||||||
| Litigation expense | 0.13 | 0.04 | 0.33 | 0.04 | |||||||||||
| Total adjustments | 0.29 | 0.05 | 1.00 | 0.25 | |||||||||||
| Income taxes 2 | (0.26 | ) | (0.21 | ) | (0.67 | ) | (0.57 | ) | |||||||
| Non-GAAP adjusted net income attributable to common stockholders per share - basic | $ | 0.98 | $ | 0.79 | $ | 2.51 | $ | 2.15 | |||||||
| Non-GAAP adjusted net income attributable to common stockholders per share - diluted 3 | $ | 0.90 | $ | 0.71 | $ | 2.32 | $ | 1.90 | |||||||
| Weighted average common shares outstanding: | |||||||||||||||
| Basic, as reported | 49,213,438 | 49,896,117 | 49,379,098 | 49,788,187 | |||||||||||
| Diluted, as reported | 55,982,554 | 58,461,103 | 56,162,705 | 59,630,170 | |||||||||||
| 1 During the three months ended March 31, 2026, the Company revised its definition of non-GAAP adjusted net income attributable to common stockholders per share – basic and diluted, to exclude gains and losses on investments with readily determinable fair value. For comparability and to conform the prior period to the current presentation, the Company has revised non-GAAP adjusted net income attributable to common stockholders for the three and nine months ended September 30, 2025. As a result, the Company adjusted for losses on investments with readily determinable fair value of a gain of $3.6 million and a loss of $0.1 million during the three and nine months ended September 30, 2025, respectively, within “Interest income and certain activity within other expense, net,” impacting the per share amounts. | |||||||||||||||
| 2 Income taxes are calculated using a rate of 21.0% for each of the three and nine months ended September 30, 2026 and 2025. The 21.0% effective tax rate for each of the three and nine months ended September 30, 2026 and 2025 excludes the income tax effect on the non-GAAP adjustments and reflects the estimated long-term corporate tax rate. | |||||||||||||||
| 3 Non-GAAP adjusted net income attributable to common stockholders per diluted share includes the add back of cash interest expense, net of tax, attributable to convertible senior notes of $2.1 million and $6.4 million for each of the three and nine months ended September 30, 2026 and 2025. | |||||||||||||||
| Three Months Ended September 30, | **Nine Months Ended **September 30, | ||||||||||||||
| 2026 | 2025 | 2026 | 2025 | ||||||||||||
| Non-GAAP free cash flow: | |||||||||||||||
| Cash flows from operating activities | $ | 75,063 | $ | 70,628 | $ | 167,585 | $ | 117,401 | |||||||
| Additions to property and equipment | (5,563 | ) | (4,754 | ) | (11,322 | ) | (15,421 | ) | |||||||
| Non-GAAP free cash flow | $ | 69,500 | $ | 65,874 | $ | 156,263 | $ | 101,980 |
Investor & Media Relations:
Matthew Zartman
Alarm.com
[email protected]
Source: Alarm.com Holdings, Inc.
Solutions
Products & Services
Our Company
Partners
Get Started
Solutions
Products & Services
Our Company
Partners
Get Started
8281 Greensboro Drive, Suite 100 - Tysons, VA 22102
(877) 389-4033 - [email protected]


Copyright © 2000-2026, Alarm.com. All rights reserved
Alarm.com and the Alarm.com Logo are registered trademarks of Alarm.com.