| * Revenue increased 18% to a quarterly record $164.4 million; on a constant currency basis, revenue grew 19% organically * Gross margin expanded 330 basis points to a record 36.6%, reflecting higher volume, favorable mix and operational improvements under Simplify to Accelerate NOW (STAN) * Operating income increased 83% to $22.3 million, with operating margin expanding 480 basis points to a record 13.6% * Net income climbed 137% to $15.3 million, or $0.91 per diluted share, while adjusted net income rose 82% to $18.0 million, or $1.07 per diluted share * Adjusted EBITDA increased 46% to $29.7 million, with margin expanding 340 basis points to a record 18.0% * Record orders of $218.1 million grew 64% year-over-year and 8% sequentially, generating a book-to-bill ratio of 1.33x; backlog reached a record $351.5 million at quarter end * Cash and cash equivalents were $39.6 million; total debt was $173.4 million, down $7.0 million from year-end 2025, and the leverage ratio improved to 1.49x, as described in the reconciliation of non-GAAP financial measures BUFFALO, N.Y.--(BUSINESS WIRE)--Nov. 4, 2026-- Allient Inc. (Nasdaq: ALNT) (“Allient” or the “Company”), a global designer and manufacturer of precision and specialty Motion, Controls and Power products and solutions for targeted industries and applications, today reported financial results for its third quarter ended September 30, 2026. “We delivered an outstanding third quarter, with record revenue and margins demonstrating the earnings power of a stronger, more efficient Allient,” commented Dick Warzala, Chairman and CEO. “Higher volume, favorable mix and continued operational improvements drove an 83% increase in operating income and more than doubled net income. Our Simplify to Accelerate NOW strategy is helping us translate stronger demand into improved profitability while continuing to invest in capacity, technology and productivity. “Industrial and Aerospace & Defense remained important drivers of growth, and Vehicle also contributed meaningfully to the revenue increase. Across the organization, we remain focused on higher-value motion, controls and power applications where our engineering capabilities and solutions-oriented approach can deepen customer relationships and support attractive long-term returns.” Mr. Warzala added, “Record orders of $218 million and backlog of $351 million provide us with a positive outlook as we move into the fourth quarter and early 2027. Our priorities are to execute against that demand, provide full support for our internal growth opportunities and to maintain our disciplined approach on investments. While customer schedules, mix and the trade environment can affect quarterly performance, we believe our stronger operating model and financial flexibility position us well to build on our progress.” Third Quarter 2026 Results(Narrative compares with prior-year period unless otherwise noted) Revenue increased 18%, or $25.7 million, to $164.4 million, compared with $138.7 million. Foreign currency translation provided an unfavorable impact of $0.9 million; on a constant currency basis, revenue grew 19% organically. See the attached table for a description of non-GAAP financial measures and reconciliation of revenue excluding foreign currency exchange rate fluctuations. Sales to U.S. customers were 57% of total revenue, consistent with the third quarter of 2025, with the balance of sales to customers primarily in Europe, Canada and Asia-Pacific. The Company continues to benefit from its diversified geographic footprint and balanced exposure across end markets. Market Performance: * Industrial revenue increased 15% to $81.7 million, driven by continued demand for industrial automation and solutions supporting data center and infrastructure and other critical facility applications. * Vehicle revenue increased 27% to $27.3 million, primarily reflecting stronger commercial automotive demand, including shipments accelerated ahead of a customer’s model changeover. * Aerospace & Defense revenue increased 36% to $25.5 million, reflecting strong defense-related demand for mission-critical platforms and systems, as well as favorable program timing. * Medical revenue decreased 2% to $21.3 million, as higher demand for surgical precision motion applications was more than offset by lower demand for medical mobility applications. * Distribution channel sales, while representing a smaller portion of total revenue, increased 39%, reflecting broad-based growth across the channel. Gross profit increased 30% to $60.2 million. Gross margin expanded 330 basis points to 36.6%, reflecting higher sales volume, improved product mix and operational improvements under STAN. Operating costs and expenses were $37.9 million, compared with $34.0 million. The increase reflected higher sales commissions, personnel-related expenses, software licensing and information technology consulting costs, and sales and marketing activity. As a percentage of revenue, operating costs were 23.0%, an improvement of 150 basis points year-over-year, demonstrating operating leverage on the higher revenue base. Restructuring and business realignment costs declined to $15,000 from $0.8 million in the prior-year quarter, primarily reflecting lower costs associated with the transfer of assembly operations from the Company’s Dothan, Alabama facility and the timing of other STAN actions. The Company expects approximately $2 million of restructuring and business realignment costs for full-year 2026. Operating income increased 83% to $22.3 million, compared with $12.2 million. Operating margin expanded 480 basis points to a record 13.6%, reflecting higher gross margin, operating expense leverage and lower restructuring costs. Interest expense decreased 27% to $2.5 million from $3.4 million, primarily reflecting lower average debt balances. The effective income tax rate was 22.2% for the third quarter of 2026, consistent with the prior-year period. The Company expects its income tax rate for the full year 2026 to be approximately 21% to 23%. Net income increased 137% to $15.3 million, or $0.91 per diluted share, compared with $6.5 million, or $0.39 per diluted share. Adjusted net income, which excludes amortization of intangible assets related to acquisitions, acquisition and integration-related costs, restructuring and business realignment costs, and other non-recurring items, was $18.0 million, or $1.07 per diluted share, up 82% from $9.9 million, or $0.59 per diluted share. See the attached tables for a description of non-GAAP financial measures and reconciliation table for Adjusted Net Income and Diluted Earnings per Share. Earnings before interest, taxes, depreciation, amortization, stock-based compensation expense, acquisition and integration-related costs, restructuring and business realignment costs, and foreign currency gains/losses (“Adjusted EBITDA”) was $29.7 million, or 18.0% of revenue, compared with $20.3 million, or 14.6% of revenue. The Company believes that, when used in conjunction with measures prepared in accordance with U.S. generally accepted accounting principles, Adjusted EBITDA, which is a non-GAAP measure, helps in the understanding of its operating performance. See the attached table for a description of non-GAAP financial measures and reconciliation table for Adjusted EBITDA. Balance Sheet and Cash Flow Review Cash and cash equivalents were $39.6 million at September 30, 2026, compared with $40.7 million at December 31, 2025. Net cash provided by operating activities was $22.1 million for the first nine months of 2026, compared with $43.1 million in the prior-year period. The change was primarily due to accounts receivable timing and investments in inventory to support rapid growth and strategic buys of critical materials to mitigate supply constraints. Working capital management and cash conversion remain priorities as the Company supports higher business activity. Capital expenditures were $10.6 million for the first nine months of 2026, compared with $5.1 million in the prior-year period, as the Company continued to invest in capacity, technology and productivity in support of long‑term growth. The Company expects full-year 2026 capital expenditures to be approximately $12.0 million to $15.0 million. Total debt was $173.4 million at September 30, 2026, down $7.0 million from December 31, 2025. Debt, net of cash, decreased to $133.7 million, resulting in a net debt-to-capitalization ratio of 29.0%. The Company had $162.0 million of unused revolving credit capacity at quarter end. The Company’s leverage ratio, defined as total net debt divided by trailing twelve months Adjusted EBITDA, improved to 1.49x from 1.82x at December 31, 2025. The bank leverage ratio, as defined under the Company’s credit agreement and excluding foreign cash and certain other adjustments, was 1.89x at quarter-end, well within covenant requirements. See the attached table for a description of non-GAAP financial measures and reconciliation table for Total Net Debt and Leverage Ratio. Orders and Backlog Summary($ in thousands) | | Q3 2026 | Q2 2026 | Q1 2026 | Q4 2025 | Q3 2025 | | Orders | $ | 218,057 | $ | 201,302 | $ | 158,080 | $ | 145,088 | $ | 133,119 | | Backlog | $ | 351,489 | $ | 298,031 | $ | 250,991 | $ | 232,925 | $ | 230,984 | Third quarter orders increased 64% year-over-year and 8% sequentially to a record $218.1 million, resulting in a book-to-bill ratio of 1.33x. The increase reflected broad-based demand across key targeted markets, led by Industrial and Aerospace & Defense. Foreign currency translation provided an unfavorable impact of $0.8 million compared with the prior-year period. Backlog increased 52% year-over-year and 18% from June 30, 2026, to $351.5 million. The higher backlog provides improved visibility into the fourth quarter of 2026 and early 2027. The majority is expected to convert to revenue within six to twelve months, reflecting revised order patterns to ensure critical material availability on a longer-term basis. Conference Call and Webcast The Company will host a conference call and webcast on Thursday, November 5, 2026, at 10:00 am ET. During the conference call, management will review the financial and operating results and discuss Allient’s corporate strategy and outlook. A question-and-answer session will follow. To listen to the live call, dial (201) 389-0908. In addition, the webcast and slide presentation may be found at: www.allient.com/investors. A telephonic replay will be available from 2:00 pm ET on the day of the call through Thursday, November 19, 2026. To listen to the archived call, dial (412) 317-6671 and enter replay pin number 13762680 or access the webcast replay via the Company’s website. About Allient Inc. Allient (Nasdaq: ALNT) is a global engineering and manufacturing enterprise that develops solutions to drive the future of market-moving industries, including medical, life sciences, aerospace and defense, industrial automation, robotics, semi-conductor, transportation, agriculture, construction and facility infrastructure. A family of globally responsible companies, Allient takes a One-Team approach to “Connect What Matters” and provides the most robust, reliable, and high-value products and systems by utilizing its core Motion, Controls, and Power technologies and platforms. Headquartered in Buffalo, N.Y., Allient employs more than 2,500 team members around the world. To learn more, visit www.allient.com. Safe Harbor Statement The statements in this news release that relate to future plans, events or performance are “forward-looking statements” within the meaning of the Private Securities Litigation Reform Act of 1995. Forward-looking statements include, without limitation, any statement that may predict, forecast, indicate, or imply future results, performance, or achievements. Examples of forward-looking statements include, among others, statements the Company makes regarding expected savings from restructuring and simplifying actions, the cost of implementing such actions, operating results, expectations for the level of sales, the Company’s belief that it has sufficient liquidity to fund its business operations, and expectations with respect to the conversion of backlog to sales. Forward-looking statements are neither historical facts nor assurances of future performance. Instead, they are based only on the Company’s current beliefs, expectations and assumptions regarding the future of the Company’s business, future plans and strategies, projections, anticipated events and trends, the economy and other future conditions. Because forward-looking statements relate to the future, they are subject to inherent uncertainties, risks and changes in circumstances that are difficult to predict and many of which are outside of the Company’s control. The Company’s actual results and financial condition may differ materially from those indicated in the forward-looking statements. Therefore, you should not rely on any of these forward-looking statements. Important factors that could cause our actual results and financial condition to differ materially from those indicated in the forward-looking statements include, among others, general economic and business conditions, conditions affecting the industries served by the Company and its subsidiaries, conditions affecting the Company's customers and suppliers, competitor responses to the Company's products and services, the overall market acceptance of such products and services, the pace of bookings relative to shipments, the ability to expand into new markets and geographic regions, the success in acquiring new business, the impact of changes in income tax rates or policies, commercial activity and demand across our and our customers’ businesses, global supply chains, the prices of our securities and the achievement of our strategic objectives, the ability to attract and retain qualified personnel, the ability to successfully integrate an acquired business into our business model without substantial costs, delays, or problems, and other factors disclosed in the Company's periodic reports filed with the Securities and Exchange Commission. Any forward-looking statement speaks only as of the date on which it is made. New risks and uncertainties arise over time, and it is not possible for us to predict the occurrence of those matters or the manner in which they may affect us. The Company has no obligation or intent to release publicly any revisions to any forward looking statements, whether as a result of new information, future events, or otherwise. FINANCIAL TABLES FOLLOW | ALLIENT INC. CONDENSED CONSOLIDATED STATEMENTS OF INCOME (In thousands, except per share data) (Unaudited) | | | | | | For the three months ended | | For the nine months ended | | | | | September 30, | | September 30, | | | | | 2026 | | 2025 | | 2026 | | 2025 | | | Revenue | | $ | 164,399 | | $ | 138,743 | | $ | 457,084 | | $ | 411,124 | | | Cost of goods sold | | | 104,214 | | | 92,562 | | | 297,932 | | | 275,835 | | | Gross profit | | | 60,185 | | | 46,181 | | | 159,152 | | | 135,289 | | | Operating costs and expenses: | | | | | | | | | | | | | | | Selling | | | 7,421 | | | 6,217 | | | 22,030 | | | 18,257 | | | General and administrative | | | 17,078 | | | 14,112 | | | 48,421 | | | 42,364 | | | Engineering and development | | | 10,254 | | | 9,687 | | | 30,579 | | | 29,185 | | | Acquisition and integration-related costs | | | — | | | 17 | | | — | | | 40 | | | Restructuring and business realignment costs | | | 15 | | | 836 | | | 1,518 | | | 3,457 | | | Amortization of intangible assets | | | 3,117 | | | 3,132 | | | 9,373 | | | 9,350 | | | Total operating costs and expenses | | | 37,885 | | | 34,001 | | | 111,921 | | | 102,653 | | | Operating income | | | 22,300 | | | 12,180 | | | 47,231 | | | 32,636 | | | Other expense, net: | | | | | | | | | | | | | | | Interest expense | | | 2,494 | | | 3,401 | | | 7,570 | | | 10,588 | | | Other expense, net | | | 110 | | | 457 | | | 163 | | | 1,964 | | | Total other expense, net | | | 2,604 | | | 3,858 | | | 7,733 | | | 12,552 | | | Income before income taxes | | | 19,696 | | | 8,322 | | | 39,498 | | | 20,084 | | | Income tax provision | | | (4,371) | | | (1,845) | | | (8,425) | | | (4,433) | | | Net income | | $ | 15,325 | | $ | 6,477 | | $ | 31,073 | | $ | 15,651 | | | Basic earnings per share: | | | | | | | | | | | | | | | Earnings per share | | $ | 0.91 | | $ | 0.39 | | $ | 1.85 | | $ | 0.94 | | | Basic weighted average common shares | | | 16,800 | | | 16,695 | | | 16,771 | | | 16,658 | | | Diluted earnings per share: | | | | | | | | | | | | | | | Earnings per share | | $ | 0.91 | | $ | 0.39 | | $ | 1.84 | | $ | 0.94 | | | Diluted weighted average common shares | | | 16,903 | | | 16,780 | | | 16,886 | | | 16,708 | | | | | | | | | | | | | | | | | | ALLIENT INC. CONDENSED CONSOLIDATED BALANCE SHEETS (In thousands) (Unaudited) | | | | | | September 30, | | December 31, | | | | | 2026 | | 2025 | | | Assets | | | | | | | | | Current assets: | | | | | | | | | Cash and cash equivalents | | $ | 39,646 | | $ | 40,705 | | | Trade receivables, net of provision for credit losses of $951 and $887 at September 30, 2026 and December 31, 2025, respectively | | | 109,633 | | | 88,775 | | | Inventories | | | 126,966 | | | 109,198 | | | Prepaid expenses and other assets | | | 18,952 | | | 14,759 | | | Total current assets | | | 295,197 | | | 253,437 | | | Property, plant, and equipment, net | | | 63,191 | | | 61,771 | | | Deferred income taxes | | | 10,082 | | | 10,509 | | | Intangible assets, net | | | 78,403 | | | 88,391 | | | Goodwill | | | 133,137 | | | 134,332 | | | Operating lease assets | | | 25,800 | | | 21,030 | | | Other long-term assets | | | 8,928 | | | 8,125 | | | Total Assets | | $ | 614,738 | | $ | 577,595 | | | Liabilities and Stockholders’ Equity | | | | | | | | | Current liabilities: | | | | | | | | | Accounts payable | | $ | 39,676 | | $ | 28,433 | | | Accrued liabilities | | | 44,788 | | | 40,890 | | | Total current liabilities | | | 84,464 | | | 69,323 | | | Long-term debt | | | 173,372 | | | 180,389 | | | Deferred income taxes | | | 2,922 | | | 3,241 | | | Operating lease liabilities | | | 20,056 | | | 16,431 | | | Other long-term liabilities | | | 6,708 | | | 6,756 | | | Total liabilities | | | 287,522 | | | 276,140 | | | Stockholders’ Equity: | | | | | | | | | Common stock, no par value, authorized 50,000 shares; 16,989 and 16,936 shares issued and outstanding at September 30, 2026 and December 31, 2025, respectively | | | 115,523 | | | 113,936 | | | Preferred stock, par value $1.00 per share, authorized 5,000 shares; no shares issued or outstanding | | | — | | | — | | | Retained earnings | | | 226,273 | | | 197,046 | | | Accumulated other comprehensive loss | | | (14,580) | | | (9,527) | | | Total stockholders’ equity | | | 327,216 | | | 301,455 | | | Total Liabilities and Stockholders’ Equity | | $ | 614,738 | | $ | 577,595 | | | | | | | | | | | | ALLIENT INC. CONDENSED CONSOLIDATED STATEMENTS OF CASH FLOWS (In thousands) (Unaudited) | | | | | | For the nine months ended | | | | | September 30, | | | | | 2026 | | 2025 | | | Cash Flows From Operating Activities: | | | | | | | | | Net income | | $ | 31,073 | | $ | 15,651 | | | Adjustments to reconcile net income to net cash provided by operating activities | | | | | | | | | Depreciation and amortization | | | 18,495 | | | 19,105 | | | Deferred income taxes | | | 179 | | | 287 | | | Stock-based compensation expense | | | 2,829 | | | 2,590 | | | Debt issue cost amortization recorded in interest expense | | | 487 | | | 485 | | | Other | | | 2,261 | | | 3,729 | | | Changes in operating assets and liabilities, net of acquisitions: | | | | | | | | | Trade receivables | | | (22,137) | | | (10,679) | | | Inventories | | | (21,026) | | | 1,863 | | | Prepaid expenses and other assets | | | (4,271) | | | (3,372) | | | Accounts payable | | | 10,936 | | | 5,583 | | | Accrued liabilities | | | 3,258 | | | 7,874 | | | Net cash provided by operating activities | | | 22,084 | | | 43,116 | | | | | | | | | | | | Cash Flows From Investing Activities: | | | | | | | | | Purchase of property and equipment | | | (10,640) | | | (5,090) | | | Net cash used in investing activities | | | (10,640) | | | (5,090) | | | | | | | | | | | | Cash Flows From Financing Activities: | | | | | | | | | Borrowings on long-term debt | | | 2,000 | | | — | | | Principal payments of long-term debt and finance lease obligations | | | (9,343) | | | (34,334) | | | Payment of debt issuance costs | | | — | | | (41) | | | Dividends paid to stockholders | | | (1,848) | | | (1,501) | | | Tax withholdings related to net share settlements of restricted stock | | | (2,708) | | | (1,121) | | | Net cash used in financing activities | | | (11,899) | | | (36,997) | | | Effect of foreign exchange rate changes on cash | | | (604) | | | 2,345 | | | Net (decrease) increase in cash and cash equivalents | | | (1,059) | | | 3,374 | | | Cash and cash equivalents at beginning of period | | | 40,705 | | | 36,102 | | | Cash and cash equivalents at end of period | | $ | 39,646 | | $ | 39,476 | | | | | | | | | | | ALLIENT INC.Reconciliation of Non-GAAP Financial Measures(In thousands, Unaudited) In addition to reporting revenue and net income, which are U.S. generally accepted accounting principle (“GAAP”) measures, the Company presents Revenue excluding foreign currency exchange rate impacts, Organic revenue, EBITDA and Adjusted EBITDA (earnings before interest, income taxes, depreciation and amortization, stock-based compensation expense, acquisition and integration-related costs, restructuring and business realignment costs, and foreign currency gains/losses), total net debt, and leverage ratio, which are non-GAAP measures. The Company believes that Revenue excluding foreign currency exchange rate impacts is a useful measure in analyzing organic sales results. The Company excludes the effect of currency translation from revenue for this measure because currency translation is not fully under management’s control, is subject to volatility and can obscure underlying business trends. The portion of revenue attributable to currency translation is calculated as the difference between the current period revenue and the current period revenue after applying foreign exchange rates from the prior period. Organic revenue is reported revenues adjusted for the impact of foreign currency and the revenue contribution from acquisitions. The Company believes EBITDA and Adjusted EBITDA are often a useful measure of a Company’s operating performance and are a significant basis used by the Company’s management to evaluate and compare the core operating performance of its business from period to period by removing the impact of the capital structure (interest), tangible and intangible asset base (depreciation and amortization), taxes, stock-based compensation expense, acquisition and integration-related costs, restructuring and business realignment costs, foreign currency gains/losses on short-term assets and liabilities, and other items that are not indicative of the Company’s core operating performance. EBITDA and Adjusted EBITDA do not represent and should not be considered as an alternative to net income, operating income, net cash provided by operating activities or any other measure for determining operating performance or liquidity that is calculated in accordance with GAAP. In addition to the performance measures identified above, we believe that total net debt and leverage ratio provide meaningful measures of liquidity and a useful basis for assessing our ability to fund our activities, including the financing of acquisitions and debt repayments. Total net debt is calculated as total debt less cash and cash equivalents. Leverage ratio is total net debt divided by adjusted EBITDA for the trailing twelve months. The Company’s calculation of Revenue excluding foreign currency exchange impacts for the three and nine months ended September 30, 2026 is as follows: | | | Three months ended | | Nine months ended | | | | September 30, 2026 | | September 30, 2026 | | Revenue as reported | | $ | 164,399 | | $ | 457,084 | | Less: Foreign currency impact - (favorable) / unfavorable | | | 850 | | | (5,491) | | Revenue excluding foreign currency exchange impacts | | $ | 165,249 | | $ | 451,593 | | | | | | | | | The Company’s calculation of organic revenue for the three and nine months ended September 30, 2026 is as follows: | | | Three months ended | | Nine months ended | | | | September 30, 2026 | | September 30, 2026 | | Revenue change over prior year | | 18.5 | % | | 11.2 | % | | Less: Impact of acquisitions and foreign currency | | 0.6 | | | (1.4) | | | Organic growth | | 19.1 | % | | 9.8 | % | | | | | | | | | ALLIENT INC.Reconciliation of Non-GAAP Financial Measures(In thousands, Unaudited) The Company’s calculation of Adjusted EBITDA for the three and nine months ended September 30, 2026, and 2025, and for the trailing twelve months ended September 30, 2026 and December 31, 2025 is as follows: | | | Three months ended | | Nine months ended | TTM ended | | | | September 30, | | September 30, | September 30, | December 31, | | | | 2026 | | 2025 | | 2026 | | 2025 | | 2026 | | 2025 | | Net income as reported | | $ | 15,325 | | $ | 6,477 | | $ | 31,073 | | $ | 15,651 | $ | 37,456 | $ | 22,034 | | Interest expense | | | 2,494 | | | 3,401 | | | 7,570 | | | 10,588 | | 10,157 | | 13,175 | | Provision for income tax | | | 4,371 | | | 1,845 | | | 8,425 | | | 4,433 | | 10,692 | | 6,700 | | Depreciation and amortization | | | 6,094 | | | 6,423 | | | 18,495 | | | 19,105 | | 24,797 | | 25,407 | | EBITDA | | | 28,284 | | | 18,146 | | | 65,563 | | | 49,777 | | 83,102 | | 67,316 | | Stock-based compensation expense | | | 983 | | | 835 | | | 2,829 | | | 2,590 | | 3,668 | | 3,430 | | Acquisition and integration-related costs | | | — | | | 17 | | | — | | | 40 | | 12 | | 47 | | Restructuring and business realignment costs | | | 15 | | | 836 | | | 1,518 | | | 3,457 | | 2,049 | | 3,993 | | Foreign currency loss | | | 370 | | | 465 | | | 733 | | | 1,974 | | 838 | | 2,079 | | Adjusted EBITDA | | $ | 29,652 | | $ | 20,299 | | $ | 70,643 | | $ | 57,838 | $ | 89,669 | $ | 76,865 | | | | | | | | | | | | | | | | | | | The Company’s calculation of Total Net Debt and Leverage Ratio as of September 30, 2026, and December 31, 2025, is as follows: | | September 30, 2026 | December 31, 2025 | | Total debt | $ | 173,372 | $ | 180,389 | | Less: cash and cash equivalents | $ | 39,646 | $ | 40,705 | | Total net debt (Non-GAAP) | $ | 133,726 | $ | 139,684 | | | | | | Trailing twelve months Adjusted EBITDA (Non-GAAP) | $ | 89,669 | $ | 76,865 | | | | | | Leverage Ratio (Non-GAAP) | | 1.49 | | 1.82 | | | | | | | ALLIENT INC.Reconciliation of GAAP Net Income and Diluted Earnings per Share toNon-GAAP Adjusted Net Income and Adjusted Diluted Earnings per Share**(In thousands, except per share data)****(Unaudited)** The Company’s calculation of Adjusted net income and Adjusted diluted earnings per share for the three and nine months ended September 30, 2026, and 2025 is as follows: | | | For the three months ended | | | | September 30, | | | | | | | Per diluted | | | | | Per diluted | | | | 2026 | | share | | 2025 | | share | | Net income as reported | | $ | 15,325 | | $ | 0.91 | | $ | 6,477 | | $ | 0.39 | | Non-GAAP adjustments, net of tax (1) | | | | | | | | | | | | | | Amortization of intangible assets – net | | | 2,388 | | | 0.14 | | | 2,399 | | | 0.14 | | Foreign currency loss – net | | | 283 | | | 0.02 | | | 356 | | | 0.02 | | Acquisition and integration-related costs – net | | | — | | | — | | | 13 | | | — | | Restructuring and business realignment costs – net | | | 11 | | | 0.00 | | | 640 | | | 0.04 | | Non-GAAP adjusted net income and adjusted diluted earnings per share | | $ | 18,007 | | $ | 1.07 | | $ | 9,885 | | $ | 0.59 | | Weighted average diluted shares outstanding | | | | 16,903 | | | 16,780 | | _______________________________ | | (1) | | Applies a blended federal, state, and foreign tax rate of 23% applicable to the non-GAAP adjustments. | | | | For the nine months ended | | | | September 30, | | | | | | | Per diluted | | | | | Per diluted | | | | 2026 | | share | | 2025 | | share | | Net income as reported | | $ | 31,073 | | $ | 1.84 | | $ | 15,651 | | $ | 0.94 | | Non-GAAP adjustments, net of tax (1) | | | | | | | | | | | | | | Amortization of intangible assets – net | | | 7,180 | | | 0.43 | | | 7,162 | | | 0.43 | | Foreign currency loss – net | | | 561 | | | 0.03 | | | 1,512 | | | 0.09 | | Acquisition and integration-related costs – net | | | — | | | — | | | 31 | | | — | | Restructuring and business realignment costs – net | | | 1,163 | | | 0.07 | | | 2,647 | | | 0.16 | | Non-GAAP adjusted net income and adjusted diluted earnings per share | | $ | 39,977 | | $ | 2.37 | | $ | 27,003 | | $ | 1.62 | | Weighted average diluted shares outstanding | | | | 16,886 | | | 16,708 | | _______________________________ | | (1) | | Applies a blended federal, state, and foreign tax rate of 23% applicable to the non-GAAP adjustments. | Adjusted net income and diluted EPS are defined as net income as reported, adjusted for certain items, including amortization of intangible assets and unusual non-recurring items. Adjusted net income and diluted EPS are not a measure determined in accordance with GAAP in the United States, and may not be comparable to the measure as used by other companies. Nevertheless, the Company believes that providing non-GAAP information, such as adjusted net income and diluted EPS are important for investors and other readers of the Company’s financial statements and assists in understanding the comparison of the current quarter’s and current year’s net income and diluted EPS to the historical periods’ net income and diluted EPS. View source version on businesswire.com: https://www.businesswire.com/news/home/20261104005937/en/ Investor Contacts: Craig P. Mychajluk Alliance Advisors IR 716-843-3832 [email protected] Source: Allient Inc. |
|
Allient Inc. designs, manufactures, and sells precision controlled motion components and systems, operating through three technology pillars: Allied Motion, Allient Controls, and Allient Power. The company provides servo control systems, motion controllers, digital servo amplifiers, brushless and coreless motors, gear motors, optical encoders, and power quality solutions including active and passive filters. Allient serves end customers and original equipment manufacturers in the industrial, vehicle, medical, and aerospace & defense sectors. The company operates globally with production facilities in the United States, Canada, Mexico, Europe, and Asia-Pacific, and sells through direct sales forces and authorized distributors. Allient was established in 1962 and changed its name from Allied Motion Technologies Inc. in 2023. Recent acquisitions include SNC Manufacturing Co., Inc. and Sierramotion Inc., expanding its capabilities in electrical transformers and mechatronic solutions. Summarised from the company's own disclosures, fiscal year ended Mar 2026 |
Industry Electrical Equipment & Parts | Homepage allient.com |
| Sector Industrials | IR page allient.com/investors | |
|
Tags
servo motors, motion control, power quality, electromagnetic systems, precision positioning, industrial automation, aerospace components, medical devices, mechatronics, electrical transformers, Allied Motion, Allient Controls, Allient Power, SNC Manufacturing Co. Inc., Sierramotion Inc., Allient Defense, ORMEC, Spectrum Controls, ALIO Industries, FPH, Thin Gap, TCI, Heidrive, Dynamic Controls
|
Press page allient.com/press-releases |
Metrics
| Valuation | |
|---|---|
| Market cap | $ 1.896B |
| Market cap (USD) | $ 1.896B |
| P/E | 50.27 |
| PEG | 6.12 |
| P/BV | 5.79 |
| P/S | 3.16 |
| P/OCF | 53.19 |
| P/FCF | 82.06 |
| Dividend yield | — |
| Turnover / mcap | — |
| Returns | |
|---|---|
| ROE | 7.8% |
| ROI | 4.6% |
| ROIC | 7.0% |
| Profit margin | 4.0% |
| Growth | |
|---|---|
| Revenue growing | No |
| Profits growing | No |
| Revenue up 3y | No |
| Revenue up 5y | No |
| Earnings growth 3y (net profit CAGR) | 8.2% |
| Quality | |
|---|---|
| Profitable | Yes |
| Margin expanding | Yes |
| Buying back stock | No |
| Diluting (TTM) | No |
| Debt/Equity | 53.0% |
| Podcast bulls (TTM) | Sign up |
| Podcast bears (TTM) | Sign up |
| Podcast sentiment (TTM) | Sign up |
| Podcast sentiment % (TTM) | Sign up |
| News sentiment (TTM) | 57 |
| Quality score | -35.3% |
| Insiders | |
|---|---|
| Buys, 1w | Sign up |
| Buys, 1m | Sign up |
| Buys, 1y | Sign up |
| Sells, 1w | Sign up |
| Sells, 1m | Sign up |
| Sells, 1y | Sign up |
Sign up to see this company's insider trades
| Figure | FY 2025 | FY 2024 | FY 2023 | FY 2022 | FY 2021 | FY 2020 | FY 2019 | FY 2018 | FY 2017 | FY 2016 | FY 2015 | FY 2014 | FY 2013 | FY 2012 | FY 2011 | FY 2010 | FY 2009 | FY 2008 | FY 2007 | FY 2006 | FY 2005 | FY 2004 | FY 2003 | FY 2002 | FY 2001 | FY 2000 |
|---|---|---|---|---|---|---|---|---|---|---|---|---|---|---|---|---|---|---|---|---|---|---|---|---|---|---|
| Revenue | 554.478M | 529.968M | 578.634M | 502.988M | 403.516M | 366.694M | 371.084M | 310.611M | 252.012M | 245.893M | 232.434M | 249.682M | 125.502M | 101.968M | 110.941M | 80.591M | 61.24M | 85.967M | 84.559M | 82.768M | 74.302M | — | — | 42.059M | 48.386M | 45.133M |
| Net profit | 22.034M | 13.166M | 24.097M | 17.389M | 24.094M | 13.643M | 17.022M | 15.925M | 8.036M | 9.078M | 11.074M | 13.86M | 3.953M | 5.397M | 6.967M | 3.585M | -12.449M | 2.909M | 2.396M | 1.931M | 923K | — | — | -266K | 1.996M | 1.475M |
| Free cash flow | 49.686M | 32.167M | 33.435M | -10.314M | 11.686M | 15.467M | 19.648M | 3.119M | 19.206M | 9.115M | 15.343M | 16.25M | 7.692M | 2.007M | 7.032M | 5.955M | 1.954M | 4.562M | 4.572M | 2.212M | 1.575M | — | — | -351K | -188K | -149K |
| Figure | FY 2025 | FY 2024 | FY 2023 | FY 2022 | FY 2021 | FY 2020 | FY 2019 | FY 2018 | FY 2017 | FY 2016 | FY 2015 | FY 2014 | FY 2013 | FY 2012 | FY 2011 | FY 2010 | FY 2009 | FY 2008 | FY 2007 | FY 2006 | FY 2005 | FY 2004 | FY 2003 | FY 2002 | FY 2001 | FY 2000 |
|---|---|---|---|---|---|---|---|---|---|---|---|---|---|---|---|---|---|---|---|---|---|---|---|---|---|---|
| Share price | 53.75 | 24.28 | 30.21 | 34.81 | 36.49 | 51.1 | 48.5 | 44.69 | 33.09 | 21.39 | 26.18 | 23.69 | 12.45 | 5.99 | 4.96 | — | — | — | — | — | — | — | — | — | — | — |
| Price performance 12m | 1.21 | -0.2 | -0.13 | -0.05 | -0.29 | 0.05 | 0.09 | 0.35 | 0.55 | -0.18 | 0.11 | 0.9 | 1.08 | 0.21 | — | — | — | — | — | — | — | — | — | — | — | — |
Filed figures
Lines the statements and their notes report beside the headline figures, read from the filings' XBRL as filed (no restatement applied), with figures computed from one filing's own lines. Cash-flow lines carry their cash direction: an outflow is negative. Each period links to its filing; a figure's period, report date and tag are in its tooltip.
| Figure | Dec 2016 | Dec 2017 | Dec 2018 | Dec 2019 | Dec 2020 | Dec 2021 | Dec 2022 | Dec 2023 | Dec 2024 | Dec 2025 |
|---|---|---|---|---|---|---|---|---|---|---|
| Balance sheet detail | ||||||||||
| Trade receivables (USD) | 26.1M | 31.8M | 43.2M | 44.4M | 47.4M | 51.2M | 76.2M | 85.1M | 78.8M | 88.8M |
| ↳ YoY growth | +14.9% | +21.9% | +35.9% | +2.7% | +6.6% | +8.2% | +48.7% | +11.7% | -7.5% | +12.7% |
| ↳ 5y CAGR | +17.4% | +24.1% | +9.8% | +9.9% | +15.8% | +14.4% | +19.1% | +14.5% | +12.1% | +13.4% |
| Borrowings, current (USD) | 936,000 | 461,000 | — | — | — | — | — | — | — | — |
| Borrowings, non-current (USD) | 70.5M | 52.7M | 123M | 110M | 120M | 159M | 235M | 218M | 224M | 180M |
| Lease liabilities (USD) | — | — | — | 16.9M | 19.6M | 17.3M | 32.4M | 33.7M | 33.1M | 30M |
| Cash and deposits (USD) | 15.5M | 15.6M | 8.67M | 13.4M | 23.1M | 22.5M | 30.6M | 31.9M | 36.1M | 40.7M |
| Intangible assets (USD) | 34.3M | 32.1M | 68.4M | 62.5M | 65.9M | 104M | 119M | 111M | 99.7M | 88.4M |
| Right-of-use assets (USD) | — | — | — | 16.4M | 19M | 17M | 22.8M | 24M | 23.7M | 21M |
| Net debt (borrowings + leases - cash) (USD) | 55.9M | 37.6M | 114M | 113M | 117M | 154M | 237M | 220M | 221M | 170M |
| Cash flow detail | ||||||||||
| Operating cash flow (USD) | 14.3M | 25.4M | 17.5M | 34.5M | 24.8M | 25.4M | 5.6M | 45M | 41.9M | 56.7M |
| Purchases of property, plant and equipment (USD) | -5.19M | -6.2M | -14.3M | -14.9M | -9.37M | -13.7M | -15.9M | -11.6M | -9.68M | -6.99M |
| Change in receivables (cash effect) (USD) | -3.72M | -4.05M | -4.11M | -1.46M | 2.71M | -170,000 | -22.2M | -5.57M | 7.46M | -7.89M |
| Change in inventories (cash effect) (USD) | -928,000 | 18,000 | -17.3M | 70,000 | -4.69M | -22.9M | -27.8M | -1.78M | 7.36M | 3.32M |
| Change in payables (cash effect) (USD) | -956,000 | 1.28M | 6.53M | -1.81M | -1.87M | 8.29M | 2.79M | -935,000 | -12.8M | 175,000 |
| Dividends paid (cash effect) (USD) | -942,000 | -959,000 | -1.08M | -1.17M | -1.16M | -1.37M | -1.54M | -1.83M | -1.98M | -2M |
| Interest paid (cash effect) (USD) | -5.05M | -2.26M | -2.27M | -5.34M | -3.59M | -3.06M | -7.3M | -12.2M | -12.1M | -13M |
| Income taxes paid (cash effect) (USD) | -1.15M | -2.09M | -7.01M | -2.05M | -8.56M | -3.87M | -7.5M | -12.7M | -7.8M | -8.99M |
| Share-based compensation (USD) | — | — | — | 3.2M | 3.55M | 4.16M | 5.07M | 5.48M | 4.15M | 3.43M |
| Operating cash flow before change in receivables (USD) | 18M | 29.5M | 21.6M | 36M | 22.1M | 25.6M | 27.8M | 50.6M | 34.4M | 64.6M |
| Free cash flow (OCF - PPE - intangibles) (USD) | 9.12M | 19.2M | 3.12M | 19.6M | 15.5M | 11.7M | -10.3M | 33.4M | 32.2M | 49.7M |
| Income detail | ||||||||||
| Total comprehensive income (USD) | 6.95M | 14.5M | 13M | 15M | 20.9M | 19.3M | 13.5M | 25.9M | 158,000 | 35.7M |
| Comprehensive income to owners (USD) | 6.95M | 14.5M | 13M | 15M | 20.9M | 19.3M | 13.5M | 25.9M | 158,000 | 35.7M |
| Provision for credit losses (USD) | 167,000 | 39,000 | 192,000 | -5,000 | 91,000 | 174,000 | 803,000 | 267,000 | 562,000 | 343,000 |
| Credit cost ratio (credit losses / average receivables) (%) | 0.7% | 0.1% | 0.5% | 0.0% | 0.2% | 0.4% | 1.3% | 0.3% | 0.7% | 0.4% |
| Reported | Mar 13, 2017 | Mar 14, 2018 | Mar 13, 2019 | Mar 9, 2022 | Mar 9, 2022 | Mar 9, 2022 | Mar 5, 2025 | Mar 5, 2025 | Mar 5, 2025 | Mar 5, 2026 |
Sign up to see institutional holdings
Sign UpPodcast Mentions
Sign up to see podcast mentions and sentiment
Sign UpMaterial events reported to the SEC on Form 8-K or 6-K, newest first. The link opens the filing itself on EDGAR. Press releases from the company's own website, newest first.
| BUFFALO, N.Y.--(BUSINESS WIRE)--Nov. 4, 2026-- Allient Inc. (Nasdaq: ALNT) (“Allient” or the “Company”), a global designer and manufacturer of precision and specialty Motion, Controls and Power products and solutions for targeted industries and applications, announced that its Board of Directors approved a quarterly cash dividend payment of $0.04 per share. The dividend will be payable on December 2, 2026, to stockholders of record as of the close of business on November 18, 2026. Allient has approximately 17.0 million shares outstanding. About Allient Inc. Allient (Nasdaq: ALNT) is a global engineering and manufacturing enterprise that develops solutions to drive the future of market-moving industries, including medical, life sciences, aerospace and defense, industrial automation, robotics, semi-conductor, transportation, agriculture, construction and facility infrastructure. A family of globally responsible companies, Allient takes a One-Team approach to “Connect What Matters” and provides the most robust, reliable, and high-value products and systems by utilizing its core Motion, Controls, and Power technologies and platforms. Headquartered in Buffalo, N.Y., Allient employs more than 2,500 team members around the world. To learn more, visit www.allient.com. View source version on businesswire.com: https://www.businesswire.com/news/home/20261104750353/en/ Investor Contacts: Craig P. Mychajluk Alliance Advisors IR 716-843-3832 [email protected] Source: Allient Inc. |

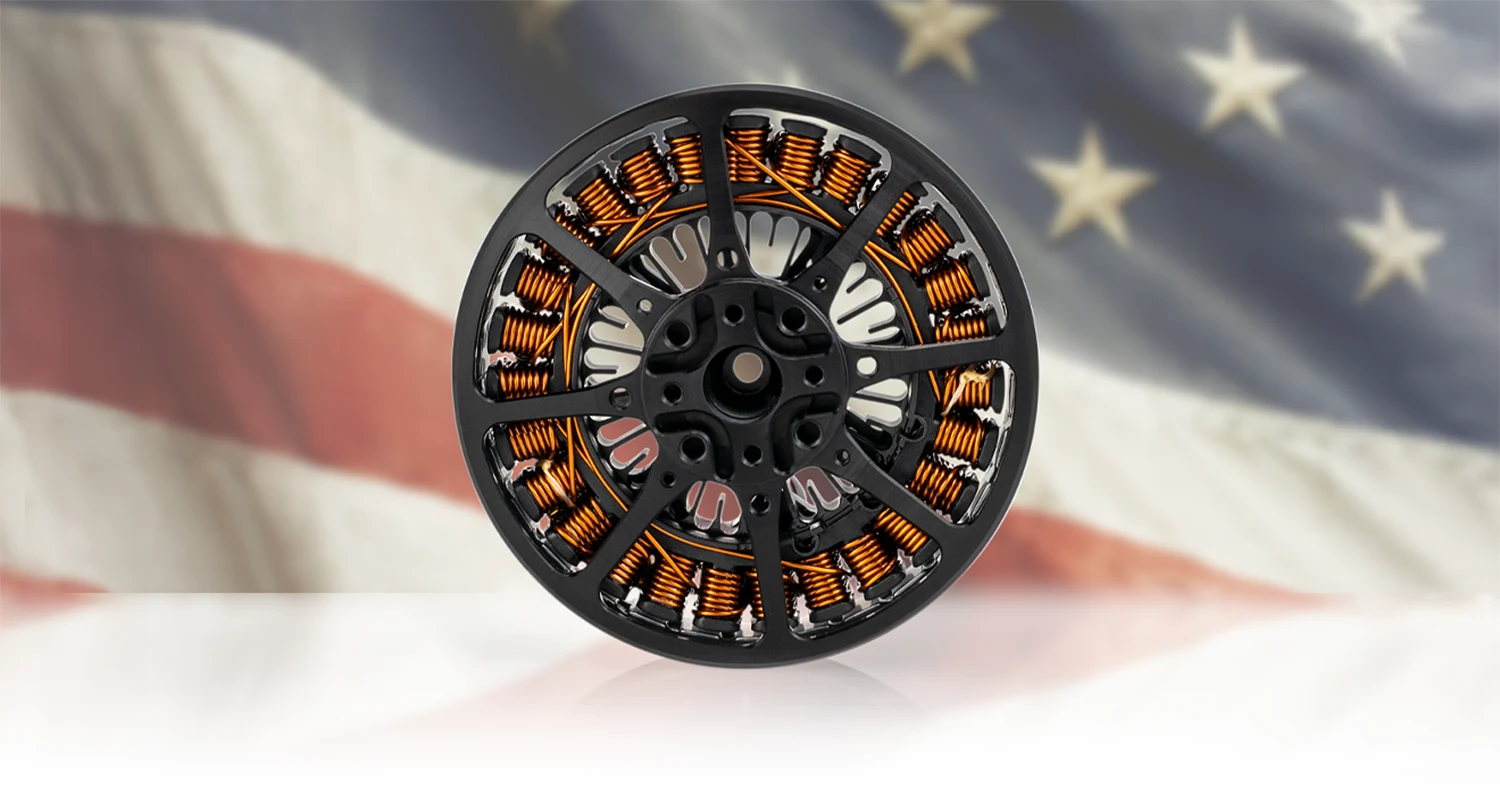
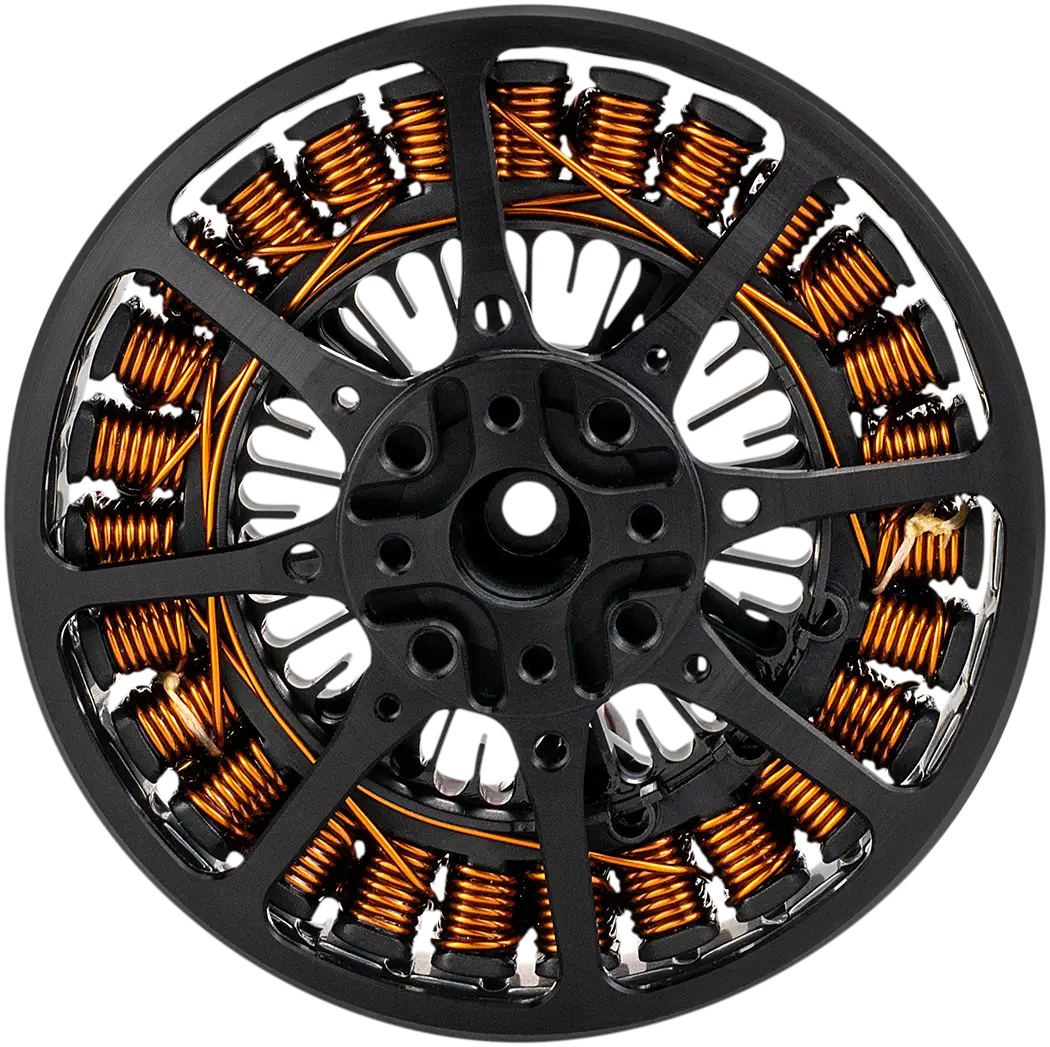
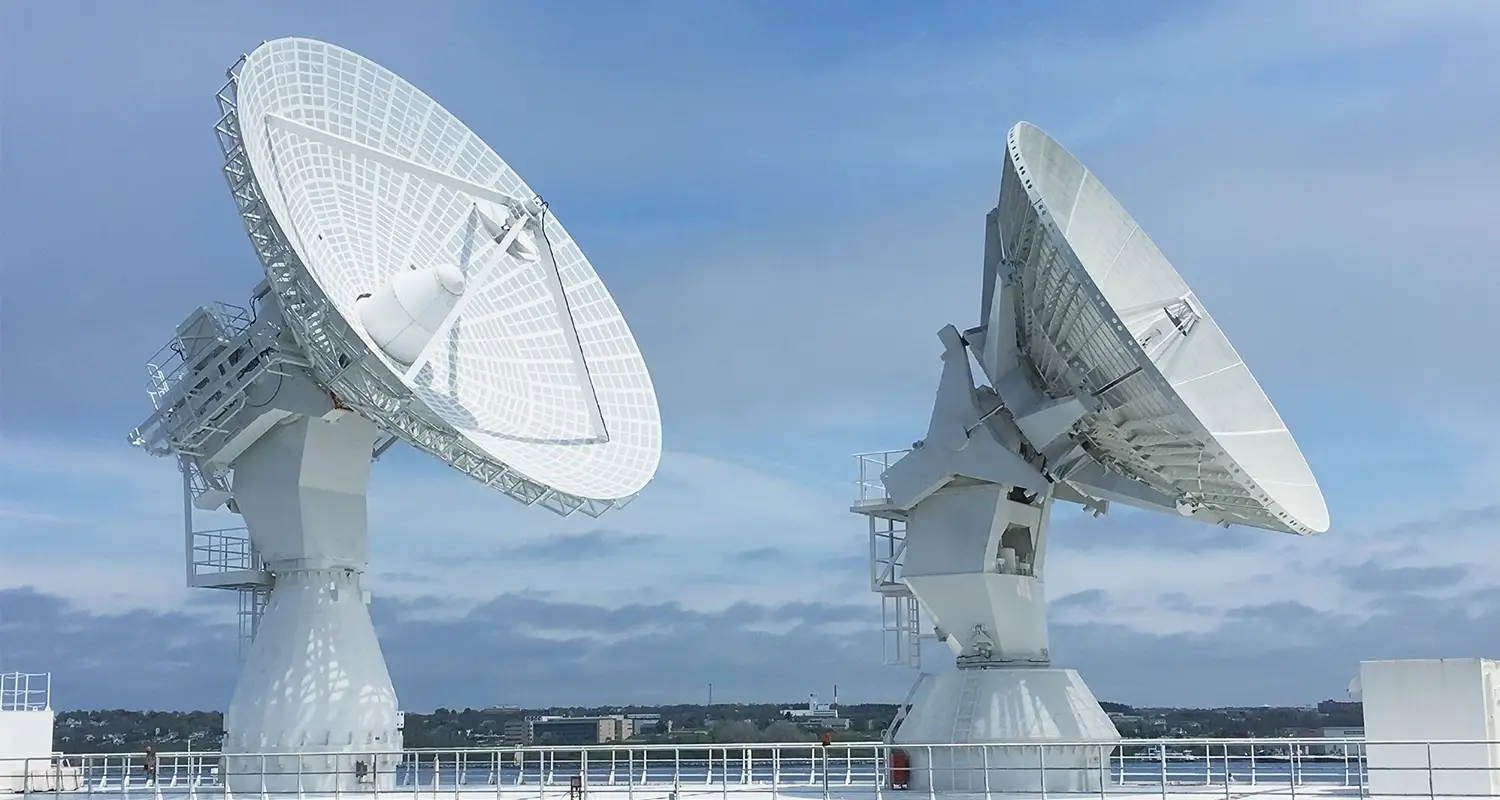
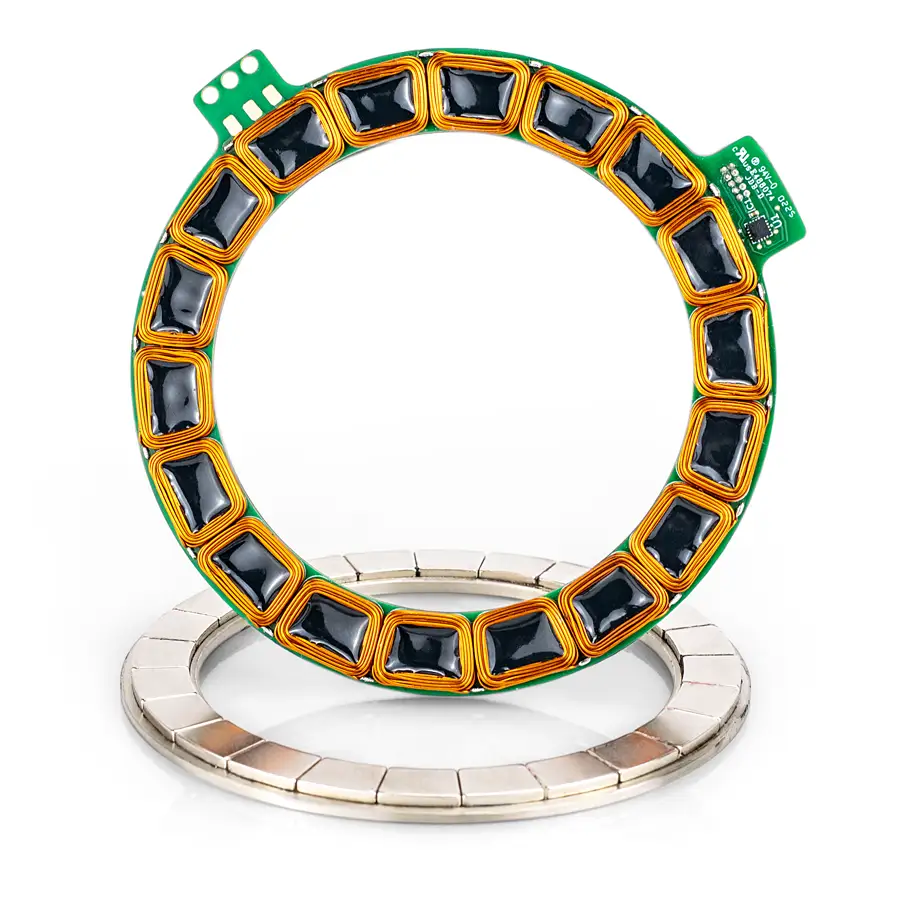
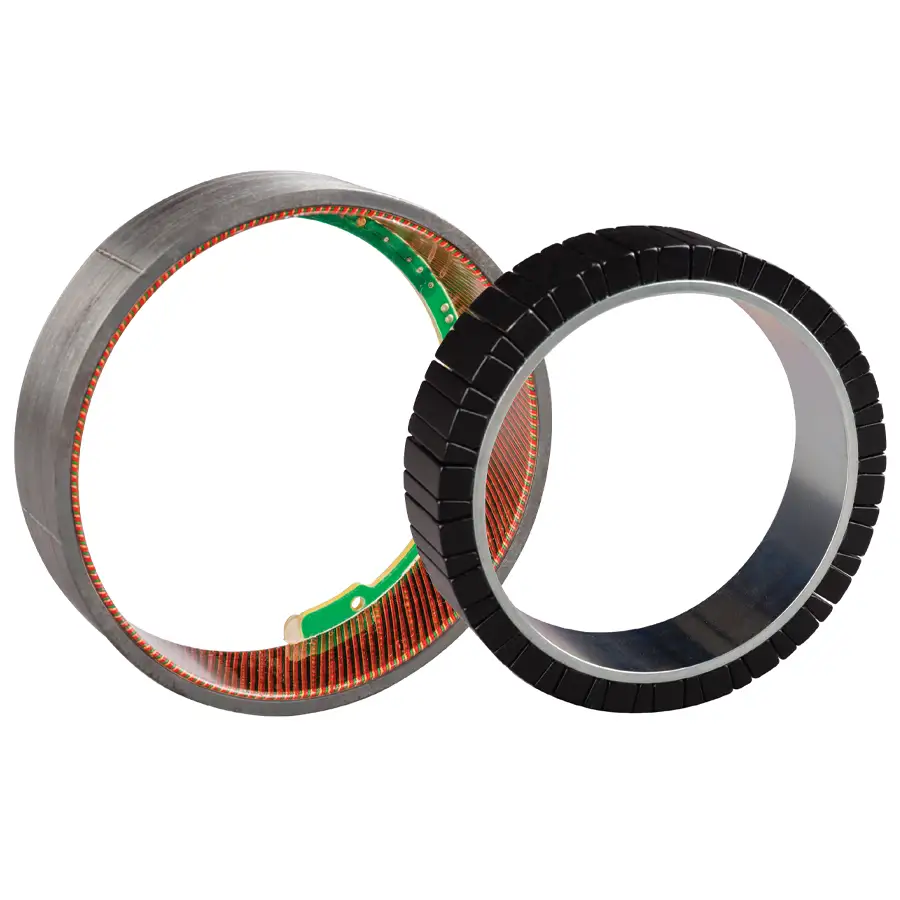
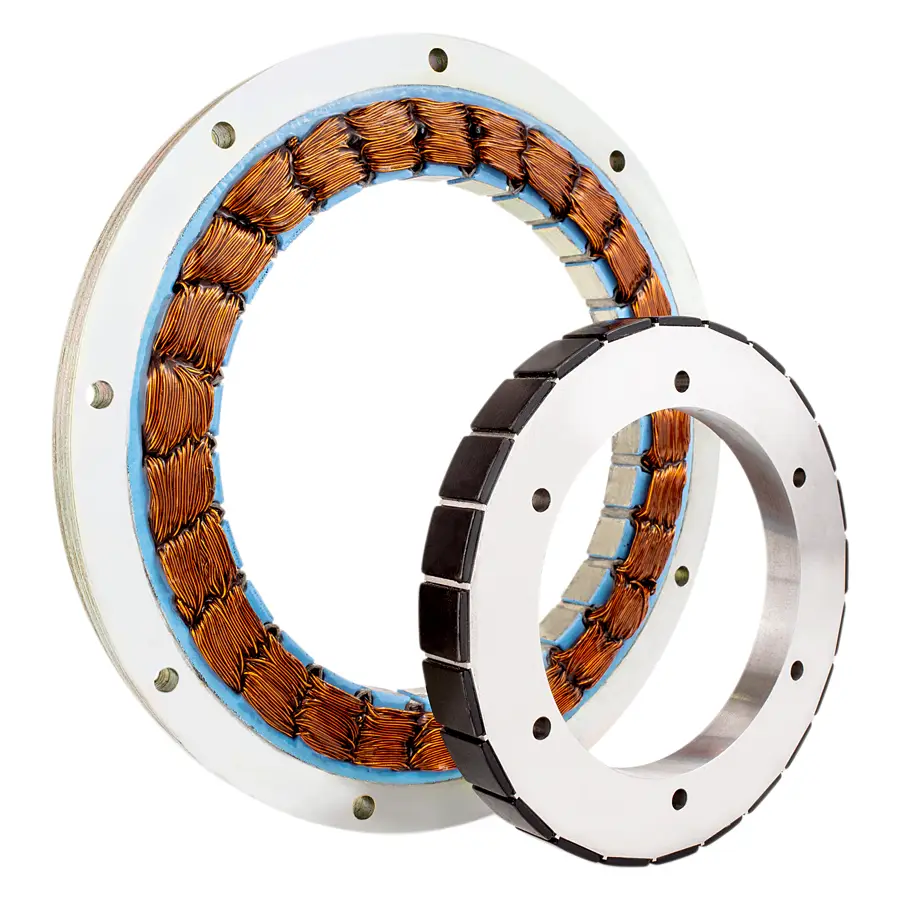
Low Earth Orbit (LEO) satellites are changing the motion control requirements of SATCOM systems, and with them, the demands placed on motors(opens in new tab).
Download our Technical Guide to Motors for SATCOM Systems to learn more about the motor technologies used in SATCOM systems and what to consider when choosing a motor.
Satellite communication has developed in stages. At first, a dish was pointed at a geosynchronous satellite and, because that satellite moved with the Earth, only small adjustments were needed. Mobile platforms such as ships and aircraft came next. When aircraft began using satellite connections for onboard Wi-Fi, they needed a gimbal that could keep the antenna pointed at a single satellite as the aircraft moved.
With today’s LEO constellations, the motion control required is far more complex than tracking a single geosynchronous satellite from a moving ship, because the satellites are moving, many terminals are moving and, in many constellations, the satellites also communicate with each other.
Direct Drive and Geared Systems in SATCOM
Larger systems generally use geared solutions, while smaller systems generally use direct drive. Large ground station dishes, for example, have traditionally used motors with gearing because of their size. In LEO systems, the trend is toward direct drive motors integrated into the gimbal. In these applications, direct drive removes the need to manage how gears and their lubrication behave across temperature differences, and can offer greater reliability and better control.
Speed also matters. A ground system tracking LEO satellites follows one satellite across the sky, then needs to move back quickly to pick up the next one coming into view. Accuracy remains essential too, because the greater the distance, the larger the error caused by a small change in angle. Precision and accuracy continue to drive decisions in SATCOM motion systems.
Thermal Challenges for Motors in LEO Satellites
In the past, much of the engineering effort for space hardware went into surviving the vibration and temperature of launch. Once in orbit, the environment was relatively well understood. LEO satellites, however, remain subject to a great deal of variability that needs to be engineered for.
In space there is no convection, so there is no surrounding air to carry heat away as there would be on the ground. Instead, heat has to be removed largely through conduction, out through the motors and moving parts. As a LEO satellite’s position relative to the sun changes, its components can also cycle from very cold to very hot multiple times a day. This challenges the selection of bearings, epoxies and traditional assembly methods, as materials expand and contract. The same system must work in hot conditions on the ground, or in a rocket before launch.
Temperature cycling is one of the most overlooked factors. Datasheets often do not state how many temperature cycles a motor can withstand before it degrades, as many motors are used in factory settings, where they run for years.
A high motor constant, which describes how much torque a motor can produce for the amount of heat it generates, allows a motor to deliver its performance with less heat and, generally, less weight. However, performance can also depend on the application. In the eyes of the customer, a motor that runs too hot may be seen as a low-performance motor.
Why Analysis Matters in SATCOM Motor Selection
With information so easy to find online, it can be tempting to select a component and test it without carrying out the analysis first. In SATCOM, this is rarely an option, as it costs a great deal to put a component into space and then find out it does not perform. Today’s tools make analysis much faster, but it still needs to be done, so that engineers understand why a design works, not simply that it works.
Get in touch to speak with a Solutions Engineer about the right motor for your LEO or SATCOM application, or download our Technical Guide to Motors for SATCOM Systems.
Notifications
Download our Technical Guide to Motors for SATCOM Systems today!
Download more information










Prompts
Click prompts to add them under the company line, click again to take one out, then copy the result into your AI chat. Shared by Asian Century Stocks and Uncovered Thai Stocks. Thank you.
Company History
Name and ticker changes, and re-registrations under a new regulatory id. When a ticker stopped being used is not recorded, so former tickers are undated.
| Date | Change | Detail |
|---|---|---|
| Aug 23, 2023 | Renamed | ALLIED MOTION TECHNOLOGIES INC → ALLIENT INC |
| Mar 31, 2003 | Renamed | HATHAWAY CORP → ALLIED MOTION TECHNOLOGIES INC |
| — | Former tickers | AMOT |
ETFs Holding Allient Inc.
Exchange-traded funds whose newest published daily portfolio holds one of the company's listings, largest weight first.
| ETF | Weight in ETF | Shares | Market value | As of |
|---|---|---|---|---|
| HVAC | 4.79% | 6,372 | $ 482.36K | Nov 17, 2026 |
| SMIZ | 0.92% | 26,753 | $ 2.515M | Aug 31, 2026 |
| EHLS | 0.40% | 2,780 | $ 212.781K | Nov 17, 2026 |
| RUSC | 0.20% | 1,551 | $ 159.644K | Jun 30, 2026 |
| FTKI | 0.12% | 401 | $ 30.693K | Nov 16, 2026 |
| VFMO | 0.11% | 22,999 | $ 2.162M | Aug 31, 2026 |
| PSC | 0.11% | 24,968 | $ 2.57M | Jun 30, 2026 |
| FSEV | 0.09% | 56 | $ 5,764.08 | Jun 30, 2026 |
| RESM | 0.07% | 25 | $ 2,573.25 | Jun 30, 2026 |
| AVSC | 0.07% | 29,098 | $ 2.227M | Nov 16, 2026 |
| VFMF | 0.04% | 4,144 | $ 389.577K | Aug 31, 2026 |
| FSEG | 0.04% | 21 | $ 2,161.53 | Jun 30, 2026 |
| DFAS | 0.04% | 144,012 | $ 12.155M | Nov 12, 2026 |
| VFQY | 0.03% | 1,766 | $ 166.022K | Aug 31, 2026 |
| FESM | 0.02% | 8,486 | $ 873.464K | Jun 30, 2026 |
| DFAC | 0.01% | 71,174 | $ 6.007M | Nov 12, 2026 |
| MSSM | 0.01% | 494 | $ 46.441K | Aug 31, 2026 |
| EBI | 0.00% | 277 | $ 26.041K | Aug 31, 2026 |
| DCOR | 0.00% | 19,792 | $ 1.67M | Nov 12, 2026 |
| DFSU | 0.00% | 729 | $ 61.528K | Nov 12, 2026 |
| DFAU | 0.00% | 3,513 | $ 296.497K | Nov 12, 2026 |
| DXUV | 0.00% | 1,624 | $ 137.066K | Nov 12, 2026 |
| DFUV | 0.00% | 4,016 | $ 338.95K | Nov 12, 2026 |
| DFUS | 0.00% | 4,383 | $ 369.925K | Nov 12, 2026 |
| AVUS | 0.00% | 2,938 | $ 224.875K | Nov 16, 2026 |
| AVSU | 0.00% | 14 | $ 1,071.56 | Nov 16, 2026 |