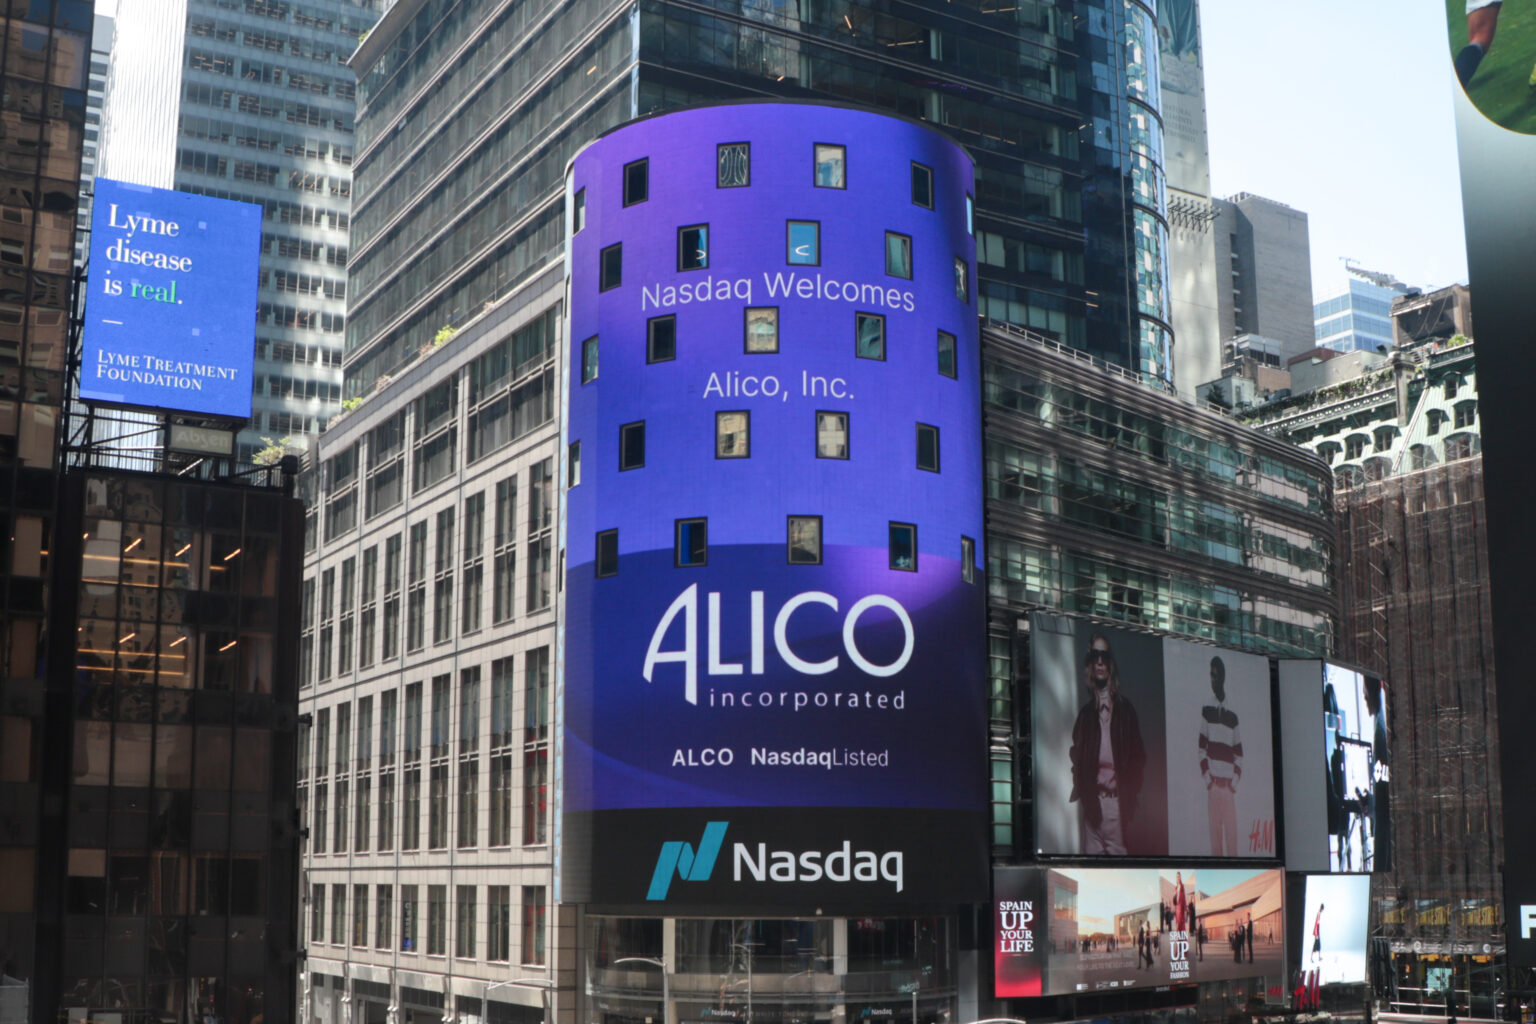
Download as PDF May 11, 2026 Related Documents Audio Earnings Webcast 10-Q Filing PDF HTML XBRL ZIP HTML Company Closed $26.9 million Land Sale in Second Quarter; Total Land Sales Reach $34.6 million Year-to-Date Company Repurchased 245,399 Shares…
Download as PDF
May 11, 2026
Related Documents
Audio
Earnings Webcast
10-Q Filing
PDF
HTML
XBRL
ZIP
HTML
Company Closed $26.9 million Land Sale in Second Quarter; Total Land Sales Reach $34.6 million Year-to-Date
Company Repurchased 245,399 Shares for $10.0 million_, Through April 2026_
Cash and Cash Equivalents of $52.9 million at March 31, 2026_, Extending Cash Runway Another Year Through Fiscal Year 2028_
Collier County Local Entitlement Approvals Secured in April 2026; Federal and State Entitlements Progressing as Expected for Corkscrew Grove Villages
FORT MYERS, Fla., May 11, 2026 (GLOBE NEWSWIRE) -- Alico, Inc. (“Alico”, the “Company”, “we”, “us” or “our”) (Nasdaq: ALCO) today announced financial results for the second quarter ended March 31, 2026.
Management Comments
John Kiernan, President and Chief Executive Officer of the Company, stated, “We believe our second quarter results, including net income attributable to Alico, Inc. common stockholders of $11.4 million and Adjusted EBITDA of $16.9 million demonstrate the continued execution of our Strategic Transformation and our commitment to delivering on our stated goals. The $26.9 million land sale for 2,950 acres of citrus grove that we closed in January, combined with the $10.0 million of common shares that were repurchased through our stock repurchase program, reflect our balanced approach to capital allocation and value creation. We're particularly pleased that our strengthened cash position extends our expected financial runway through fiscal year 2028, providing the liquidity, stability and flexibility to advance our long-term real estate development initiatives.”
Mr. Kiernan continued, “The Collier County entitlement approvals in April represent a significant regulatory milestone for Corkscrew Grove East Villages. With local approvals now secured, we're focused on the remaining federal and state permitting processes. Our diversified land utilization strategy continues to perform as intended, with approximately 97% of our farmable acreage generating revenue through agricultural partnerships. We believe this combination of near-term cash generation and long-term development optionality positions Alico to pursue substantial value creation from our approximately 46,000-acre Florida portfolio while maintaining our commitment to responsible land stewardship and conservation. We believe our track record of consistent execution, financial discipline, and strategic progress validates the business model we've built."
Another important milestone for Alico this quarter was the election of a new member of our Board of Directors. Eric Speron has proven expertise in real estate and finance. Mr. Speron has worked at First Foundation, a financial services firm, and currently serves as its Managing Director of Equities. Previously, Mr. Speron was a member of J.P. Morgan’s Institutional Equity division. He has served on the board of directors of Keweenaw Land Association, Limited since May 2021 and on the board of Tejon Ranch Company since November 2024. Mr. Speron was also a director for Tandy Leather Factory, Inc. from April 2023 to January 2025 and for Vidler Water Company, Inc. from January 2016 through May 2022. Mr. Speron received his B.A. in Government and History from Georgetown University and is a Chartered Financial Analyst.
Results of Operations for the Second Quarter 2026:
|
|
|
|
|
|
|
|
|
|
|
|
|
|
|
|
|
|
|
|
|
|
|
|
| (in thousands, except for per share amounts and percentages) |
|
|
|
|
|
|
|
|
|
|
|
|
|
|
|
|
|
|
|
|
|
|
|
|
(Unaudited) |
|
|
|
|
|
|
|
|
|
|
|
(Unaudited) |
|
|
|
|
|
|
|
|
|
|
|
Three Months Ended March 31, |
|
|
|
|
|
|
|
|
|
|
|
Six Months Ended March 31, |
|
|
|
|
|
|
|
|
|
|
|
2026 |
|
|
|
2025 |
|
|
|
% Change |
|
|
|
2026 |
|
|
|
2025 |
|
|
|
% Change |
|
|
| Revenue |
$ |
5,340 |
|
|
$ |
17,980 |
|
|
(70.3 |
|
)% |
|
$ |
7,227 |
|
|
$ |
34,874 |
|
|
(79.3 |
|
)% |
| Net income (loss) attributable to Alico, Inc. common stockholders |
$ |
11,381 |
|
|
$ |
(111,385 |
) |
|
|
110.2 |
% |
|
$ |
7,900 |
|
|
$ |
(120,552 |
) |
|
|
106.6 |
% |
| Gain (loss) per diluted common share |
$ |
1.49 |
|
|
$ |
(14.58 |
) |
|
|
110.2 |
% |
|
$ |
1.03 |
|
|
$ |
(15.79 |
) |
|
|
106.5 |
% |
| EBITDA(1) |
$ |
16,718 |
|
|
$ |
(14,742 |
) |
|
|
213.4 |
% |
|
$ |
19,130 |
|
|
$ |
(21,414 |
) |
|
|
189.3 |
% |
| Adjusted EBITDA(1) |
$ |
16,880 |
|
|
$ |
12,729 |
|
|
|
32.6 |
% |
|
$ |
19,601 |
|
|
$ |
6,057 |
|
|
|
223.6 |
% |
| Net cash provided by (used in) operating activities |
$ |
660 |
|
|
$ |
7,026 |
|
|
(90.6 |
|
)% |
|
$ |
(4,809 |
) |
|
$ |
(571 |
) |
|
(742.2 |
|
)% |
|
|
|
|
|
|
|
|
|
|
|
|
|
|
|
|
|
|
|
|
|
|
|
|
|
March 31, 2026 |
|
|
|
September 30, 2025 |
|
|
|
$ Change |
|
|
|
|
|
|
|
March 31, 2026 |
|
|
|
September 30, 2025 |
|
|
|
(Unaudited) |
|
|
|
|
|
|
|
|
|
|
|
|
|
|
|
(Unaudited) |
|
|
|
|
|
|
| Balance Sheet Items |
|
|
|
|
|
|
|
|
|
|
|
|
|
|
|
|
|
|
|
|
|
|
|
| Cash and cash equivalents |
$ |
52,879 |
|
|
$ |
38,128 |
|
|
$ |
14,751 |
|
|
Current ratio |
|
|
|
9.63 to 1 |
|
|
|
9.56 to 1 |
|
|
| Current portion of long-term debt |
$ |
250 |
|
|
$ |
250 |
|
|
$ |
— |
|
|
Net Debt(1) |
|
|
|
$ |
32,579 |
|
|
$ |
47,419 |
|
| Long-term debt, net |
$ |
82,708 |
|
|
$ |
82,797 |
|
|
$ |
(89 |
) |
|
|
|
|
|
|
|
|
|
|
|
|
| Lines of credit |
$ |
2,500 |
|
|
$ |
2,500 |
|
|
$ |
— |
|
|
|
|
|
|
|
|
|
|
|
|
|
| Total Alico stockholders’ equity |
$ |
102,382 |
|
|
$ |
103,032 |
|
|
$ |
(650 |
) |
|
|
|
|
|
|
|
|
|
|
|
|
|
|
|
|
|
|
|
|
|
|
|
|
|
|
|
|
|
|
|
|
|
|
|
|
| (1) “EBITDA,” “Adjusted EBITDA” and “Net Debt” are non-GAAP financial measures. See “Non-GAAP Financial Measures” at the end of this earnings release for details regarding these measures, including reconciliations of the Non-GAAP Financial Measures to their most directly comparable GAAP measures. |
|
|
|
|
|
|
|
|
|
|
|
|
|
|
|
|
|
|
|
|
|
|
|
|
|
|
|
|
|
|
|
|
|
|
|
|
|
|
|
|
|
|
|
|
|
|
|
For the three months ended March 31, 2026 and 2025, the Company reported net income (loss) attributable to Alico common stockholders of $11.4 million and $(111.4) million, respectively. The shift from a net loss to net income attributable to Alico common stockholders for the three months ended March 31, 2026 was principally the result of the sale of approximately 2,950 acres of land for $26,859 in gross proceeds during the quarter, compared to the sale of approximately 2,100 acres of land for $17,872 in gross proceeds during the three months ended March 31, 2025. For the three months ended March 31, 2026, the Company had a gain of $1.49 per diluted common share, compared to a loss of $(14.58) per diluted common share for the three months ended March 31, 2025.
For the three months ended March 31, 2026 and 2025, the Company had EBITDA of $16.7 million and $(14.7) million, respectively and Adjusted EBITDA of $16.9 million and $12.7 million, respectively.
These quarterly financial results reflect the evolving nature of the Company’s business as it executes its strategic transformation. Historically, the Company was primarily engaged in citrus production and sales, which created significant seasonal patterns with the first and second quarters typically generating most annual revenue and higher working capital requirements in the third and fourth quarters coinciding with harvesting cycles. As part of the Company’s strategic transformation, the Company has made the decision to wind down its citrus operations and focus on land sales, land leasing, and land development activities. The Company completed its last significant citrus harvest in April 2025. While the Company expects the historical seasonal patterns to diminish over time as this transition progresses, the Company’s financial results may continue to reflect some seasonality during the wind-down period. Additionally, the Company’s new focus on land sales, leasing, and development may introduce different timing patterns for revenue recognition based on transaction closings and development project milestones. Given this business transformation, results for any quarter may not be indicative of results for the full year, and historical seasonal patterns may not be predictive of future quarterly performance as the Company completes the transition to its new business model.
Business Segment Results
Alico Citrus
|
|
|
|
|
|
|
|
|
|
|
|
|
|
|
|
|
|
|
|
|
|
|
|
|
|
|
|
|
|
|
| (in thousands) |
|
|
|
|
|
|
|
|
|
|
|
|
|
|
|
|
|
|
|
|
|
|
|
|
|
|
|
|
|
|
|
|
Three Months Ended March 31, |
|
|
|
|
|
|
|
Change |
|
|
|
|
|
|
Six Months Ended March 31, |
|
|
|
|
|
|
|
Change |
|
|
|
|
|
|
|
2026 |
|
|
|
2025 |
|
|
|
Unit |
|
|
|
% |
|
|
2026 |
|
|
|
2025 |
|
|
|
Unit |
|
|
|
% |
|
| Operating Revenues: |
|
|
|
|
|
|
|
|
|
|
|
|
|
|
|
|
|
|
|
|
|
|
|
|
|
|
|
|
|
|
| Early and Mid-Season |
|
$ |
1,633 |
|
|
$ |
648 |
|
|
$ |
985 |
|
|
152.0 |
% |
|
$ |
1,915 |
|
|
$ |
15,577 |
|
|
$ |
(13,662 |
) |
|
(87.7 |
)% |
| Valencias |
|
|
2,158 |
|
|
|
16,293 |
|
|
|
(14,135 |
) |
|
(86.8 |
)% |
|
|
2,158 |
|
|
|
16,293 |
|
|
|
(14,135 |
) |
|
(86.8 |
)% |
| Fresh Fruit and Other |
|
|
— |
|
|
|
202 |
|
|
|
(202 |
) |
|
(100.0 |
)% |
|
|
588 |
|
|
|
828 |
|
|
|
(240 |
) |
|
(29.0 |
)% |
| Grove Management Services |
|
|
— |
|
|
|
110 |
|
|
|
(110 |
) |
|
(100.0 |
)% |
|
|
13 |
|
|
|
881 |
|
|
|
(868 |
) |
|
(98.5 |
)% |
| Total |
|
$ |
3,791 |
|
|
$ |
17,253 |
|
|
$ |
(13,462 |
) |
|
(78.0 |
)% |
|
$ |
4,674 |
|
|
$ |
33,579 |
|
|
$ |
(28,905 |
) |
|
(86.1 |
)% |
| Operating Expenses: |
|
|
|
|
|
|
|
|
|
|
|
|
|
|
|
|
|
|
|
|
|
|
|
|
|
|
|
|
|
|
| Cost of Sales |
|
$ |
8,752 |
|
|
$ |
167,106 |
|
|
$ |
(158,354 |
) |
|
(94.8 |
)% |
|
$ |
15,991 |
|
|
$ |
187,614 |
|
|
$ |
(171,623 |
) |
|
(91.5 |
)% |
| Harvesting and Hauling |
|
|
142 |
|
|
|
4,410 |
|
|
|
(4,268 |
) |
|
(96.8 |
)% |
|
|
295 |
|
|
|
8,505 |
|
|
|
(8,210 |
) |
|
(96.5 |
)% |
| Fresh Fruit and Other |
|
|
— |
|
|
|
(3,902 |
) |
|
|
3,902 |
|
|
(100.0 |
)% |
|
|
— |
|
|
|
(3,852 |
) |
|
|
3,852 |
|
|
(100.0 |
)% |
| Grove Management Services |
|
|
— |
|
|
|
(7 |
) |
|
|
7 |
|
|
(100.0 |
)% |
|
|
— |
|
|
|
451 |
|
|
|
(451 |
) |
|
(100.0 |
)% |
| Total |
|
$ |
8,894 |
|
|
$ |
167,607 |
|
|
$ |
(158,713 |
) |
|
(94.7 |
)% |
|
$ |
16,286 |
|
|
$ |
192,718 |
|
|
$ |
(176,432 |
) |
|
(91.5 |
)% |
| Gross Loss |
|
$ |
(5,103 |
) |
|
$ |
(150,354 |
) |
|
$ |
145,251 |
|
|
(96.6 |
)% |
|
$ |
(11,612 |
) |
|
$ |
(159,139 |
) |
|
$ |
147,527 |
|
|
(92.7 |
)% |
|
|
|
|
|
|
|
|
|
|
|
|
|
|
|
|
|
|
|
|
|
|
|
|
|
|
|
|
|
|
|
Alico Citrus segment results for the three and six months ended March 31, 2026 reflect the Company’s ongoing wind-down of citrus operations, which began in 2025 as part of the Company’s strategic pivot to focus on its diversified land usage and real estate development. Revenue decreased $13.5 million and $28.9 million for the three and six months ended March 31, 2026, respectively, from the prior year period, while cost of sales declined $158.4 million and $171.6 million, respectively.
Land Management and Other Operations
Land Management and Other Operations includes lease income from leases for grazing rights, hunting, and farming; royalty agreements with third parties of aggregate miners; and other miscellaneous income.
Land Management and Other Operations revenue for the three months ended March 31, 2026 increased 113.1%, as compared to the same period in the prior year due to an increase in farm lease and sod revenue as we change our focus to long-term diversified land usage as part of the Strategic Transformation. The 97.1% increase in revenues from Land Management and Other Operations for the six months ended March 31, 2026, as compared to the same period in the prior year, is primarily due to an increase in farm lease revenue, rock sand royalty and sod revenue.
The increase in operating expenses from Land Management and Other Operations for the three and six months ended March 31, 2026 of $964 and $992, respectively, as compared to the three and six months ended March 31, 2025 is the result of our focusing on our diversified land usage strategy.
The Company's diversified land management programs now include fee-generating or revenue-sharing agreements with citrus growers, cattle operators, mining operators, sugarcane producers, and sod farming operations. These programs have created diversified revenue streams that reduce operational complexity while maintaining productive agricultural use of the land. Approximately 97% of Alico's roughly 32,500 farmable agricultural acres are now utilized, representing approximately 89% of its total 46,000 agricultural acres.
Other Corporate Financial Information
General and administrative expense decreased $155 for the three months ended March 31, 2026, compared to the three months ended March 31, 2025 due to lower depreciation expense due to the acceleration of depreciation in the prior year, partially offset by an increase in contract labor costs and the provision for credit losses on certain citrus receivables.
General and administrative expense increased $260 for the six months ended March 31, 2026, compared to the six months ended March 31, 2025 due to an increase in contract labor costs and the provision for credit losses on certain citrus receivables, partially offset by lower depreciation expense.
Dividend
On April 17, 2026, the Company paid a second quarter cash dividend of $0.05 per share on its outstanding common stock to stockholders of record as of April 3, 2026.
Balance Sheet and Liquidity
The Company continues to demonstrate financial strength within its balance sheet, as highlighted below:
- The Company’s working capital was $52.2 million at March 31, 2026, representing a 9.63 to 1.00 current ratio.
- Total debt was $85.5 million and net debt was $32.6 million at March 31, 2026, compared to $85.5 million and $47.4 million, respectively, at September 30, 2025.
- Available borrowings under the Company’s line of credit were approximately $92.5 million at March 31, 2026.
- The Company's Minimum Liquidity Requirement under its Credit Agreement was $5.8 million at March 31, 2026.
Real Estate and Land Development
In January 2025, Alico sought legislative approval from the Florida Legislature to establish the Corkscrew Grove Stewardship District. Stewardship districts are independent special districts authorized to plan, finance, construct, operate and maintain public infrastructure in planned developments, operating on the principle that growth pays for itself. Similar districts are used in communities like Ave Maria and Lakewood Ranch.
In March 2025, the Company announced the creation of Corkscrew Grove Villages located on approximately 4,660 acres at the northwest corner of Collier County on the border of Lee and Hendry counties. These two master planned developments are expected to comply with the County’s 1,500 acre cap for Villages, and be accompanied by more than 6,000 acres of permanent conservation areas. The plan for these villages is to feature approximately 9,000 homes total, including approximately 750 affordable housing units total for essential workers, and approximately 480,000 square feet of total commercial space offering retail, dining, office, and medical uses. The East Village includes an additional 100,000 square feet for indoor self-storage, and a minimum of 45,000 square feet of civic uses, and the West Village may include similar additional uses depending on County requirements and future site planning.
Alico launched its multi-year entitlement process for Corkscrew Grove Villages by submitting an application to Collier County for local approval for the first of the two villages, the East Village. The Company has also submitted permits to the South Florida Water Management District and the U.S. Army Corps of Engineers for both villages.
In April 2026, Alico received final local entitlement approvals from the Collier County Board of County Commissioners for the East Village component of Corkscrew Grove Villages. This advances the project toward the remaining federal permits from the U.S. Army Corps of Engineers and U.S. Fish and Wildlife Service, as well as state permits from the South Florida Water Management District. Construction on the first village could begin in 2028 or 2029 if all approvals are granted.
Alico maintains a strong commitment to regional conservation, having transferred lands over the past 40 years that became part of the Corkscrew Regional Ecosystem Watershed (CREW), Tiger Creek Preserve and Okaloacoochee Slough Wildlife Management Area. In 2023, Alico sold more than 17,000 acres of land from central Hendry County, commonly referred to as Devil’s Garden, to the Florida Department of Environmental Protection as part of the Florida Forever program. Since Devil’s Garden was added to the Florida Forever Priority List in 2002, Alico has sold or entered easements to protect more than 46,800 acres within the project boundaries. Combined with the more than 6,000 acres expected to be placed in conservation as part of the Corkscrew Grove Villages proposal, these efforts support the implementation of the Florida Wildlife Corridor.
The plan for Corkscrew Grove Villages aligns with the Collier Rural Land Stewardship Area (RLSA) program, an innovative, incentive-based approach to sustainable rural growth that has received national recognition. The villages will enhance public infrastructure and provide significant economic benefit to the region at no additional cost to taxpayers.
Fiscal Year 2026 Guidance
The Company expects to realize in fiscal year 2026 Adjusted EBITDA of approximately $14 million and end the fiscal year with cash of approximately $40 million and net debt of approximately $45 million, with only the minimum required balance of $2.5 million on its revolving line of credit. This cash guidance reflects the deployment of $10.0 million for the stock repurchase program through April 2026. In the event that any additional capital is returned to shareholders through increased common dividends, special dividends, tender offers or open market share repurchases during the 2026 fiscal year, the Company’s cash balance could be further reduced and net debt could be correspondingly increased.
Conference Call Information
The Company will host a conference call to discuss its financial results on May 12, 2026, at 8:30 am Eastern Time. Interested parties may join the conference call by dialing 1-800-343-4849 in the United States and 1-203-518-9848 from outside of the United States. The participant identification to join the conference call is “ALICO”. A telephone replay will be available approximately three hours after the call concludes, and will be available through May 26, 2026. Listeners in the United States may dial 1-844-512-2921 and international listeners may dial 1-412-317-6671. The passcode for the playback is 11161326.
About Alico
Alico, Inc. (Nasdaq: ALCO) is a Florida-based agribusiness and land management company with over 125 years of experience. Following its strategic transformation in 2025, Alico operates as a diversified land company with approximately 46,000 acres across 7 Florida counties. The Company focuses on strategic land development opportunities and diversified agricultural operations, leveraging its extensive land portfolio to create long-term shareholder value while maintaining its commitment to responsible land stewardship and conservation. Learn more about Alico at www.alicoinc.com.
Forward-Looking Statements
This press release contains forward-looking statements within the meaning of Section 27A of the Securities Act of 1933, as amended, and Section 21E of the Securities Exchange Act of 1934, as amended. Forward-looking statements include, but are not limited to, statements regarding our strategic transformation and business model, our guidance, outlook, projections, targets and expectations for fiscal year 2026 and subsequent periods, including Adjusted EBITDA, EBITDA, cash, cash flow, financial runway, liquidity, borrowing availability, minimum liquidity requirements, capital expenditures, debt, net debt and potential uses of capital, including dividends, share repurchases, tender offers or other returns of capital; our land sales, land monetization strategy and expected proceeds and timing; our leasing, utilization of acreage and expected revenues from agricultural and other partnerships; our real estate entitlement, permitting and development activities and timelines, including the Corkscrew Grove Villages, related stewardship district matters, anticipated regulatory decisions and potential commencement of construction; the future use, conservation and estimated value of our land holdings and any other statements relating to our future activities events or conditions. These statements are based on our current expectations, estimates and projections about our business based, in part, on assumptions made by our management and can be identified by terms such as “if,” “will,” “should,” “expects,” “plans,” “hopes,” “anticipates,” “could,” “intends,” “targets,” “projects,” “contemplates,” “believes,” “estimates,” “forecasts,” “predicts,” “potential” or “continue” or the negative of these terms or other similar expressions.
These forward-looking statements are not guarantees of future performance and involve risks, uncertainties and assumptions that are difficult to predict. Therefore, actual outcomes and results may differ materially from what is expressed or forecasted in the forward-looking statements due to numerous factors, including, but not limited to: our ability to successfully develop and execute our strategic growth initiatives, including our Strategic Transformation, which may not achieve intended outcomes and may entail unintended consequences or additional costs; our planned shift in revenue mix toward real estate development and diversified farming operations and the risk that adverse events in these areas could disproportionately affect our business; the highly competitive nature of the land development and agricultural industries and our ability to maintain market share; our reputation and any harm thereto; the risk that any transaction intended to qualify as a Section 1031 Exchange is taxable or cannot be completed on a tax-deferred basis, and potential limitations on the use of our net operating loss carryforwards and other tax attributes; the possibility that significant corporate transactions do not achieve intended results or present unforeseen risks; sensitivity of our earnings to supply, demand and pricing for land sales, leasing and development activities and any remaining agricultural products; adverse weather conditions, natural disasters and other natural conditions (including hurricanes and tropical storms), and the effects of climate change or legal, regulatory or market measures to address climate change, particularly given our geographic concentration in Florida; Environmental, Social and Governance matters, including those related to our workforce and sustainability; changes in classification or valuation methods employed by county property appraisers that could materially increase our real estate taxes; compliance with environmental laws; our ability to attract, retain and develop key employees; potential future material weaknesses and other deficiencies in our internal control over financial reporting; macroeconomic conditions, including inflation, armed conflicts and geopolitical instability, and pandemics or health crises; the increased costs of being a publicly traded company; system security risks, cybersecurity incidents, data protection breaches and systems integration issues, as well as compliance with complex and evolving privacy and data protection laws; pricing volatility and unpredictability for our agricultural products, risks of product contamination and product liability, water use regulations and other restrictions on access to water, and changes in immigration laws affecting labor availability; increases in commodity and input costs (including fuel and chemicals) and transportation risks; our significant indebtedness, our ability to generate sufficient cash flow to service our debt and comply with covenants (including exposure to variable interest rates), and our relationships with lenders; the volatility of our common stock price; and our ability to continue to pay or maintain cash dividends; and certain of the other factors described under the sections "Risk Factors" and "Management's Discussion and Analysis of Financial Condition and Results of Operations" to be included in our Quarterly Report on Form 10-Q for the fiscal quarter ended March 31, 2026 that will be filed with the Securities and Exchange Commission (the “SEC”) and the Company’s Annual Report on Form 10-K for the year ended September 30, 2025 filed with the SEC on November 24, 2025. Except as required by law, we do not undertake an obligation to publicly update or revise any forward-looking statement, whether as a result of new information, future developments, or otherwise.
This press release also contains financial projections that are necessarily based upon a variety of estimates and assumptions which may not be realized and are inherently subject, in addition to the risks identified in the forward-looking statement disclaimer, to business, economic, competitive, industry, regulatory, market and financial uncertainties, many of which are beyond the Company’s control. There can be no assurance that the assumptions made in preparing the financial projections will prove accurate. Accordingly, actual results may differ materially from the financial projections.
Investor Contact:
|
|
|
|
|
|
|
|
|
|
|
|
|
|
|
|
| ALICO, INC. CONDENSED CONSOLIDATED BALANCE SHEETS (in thousands, except share amounts) |
|
|
|
|
|
|
|
|
|
|
|
|
|
|
|
|
March 31, 2026 |
|
|
|
September 30, 2025 |
|
|
|
(Unaudited) |
|
|
|
|
|
|
| ASSETS |
|
|
|
|
|
|
|
| Current assets: |
|
|
|
|
|
|
|
| Cash and cash equivalents |
$ |
52,879 |
|
|
$ |
38,128 |
|
| Accounts receivable, net |
|
2,189 |
|
|
|
1,014 |
|
| Inventories |
|
1,480 |
|
|
|
4,220 |
|
| Income tax receivable |
|
— |
|
|
|
338 |
|
| Assets held for sale |
|
— |
|
|
|
9,176 |
|
| Prepaid expenses and other current assets |
|
1,667 |
|
|
|
2,043 |
|
| Total current assets |
|
58,215 |
|
|
|
54,919 |
|
| Restricted cash |
|
762 |
|
|
|
762 |
|
| Property and equipment, net |
|
132,050 |
|
|
|
142,065 |
|
| Goodwill |
|
2,246 |
|
|
|
2,246 |
|
| Other non-current assets |
|
6,584 |
|
|
|
1,535 |
|
| Total assets |
$ |
199,857 |
|
|
$ |
201,527 |
|
|
|
|
|
|
|
|
|
| LIABILITIES AND STOCKHOLDERS’ EQUITY |
|
|
|
|
|
|
|
| Current liabilities: |
|
|
|
|
|
|
|
| Accounts payable |
$ |
1,006 |
|
|
$ |
403 |
|
| Accrued liabilities |
|
3,778 |
|
|
|
4,563 |
|
| Current portion of long-term debt |
|
250 |
|
|
|
250 |
|
| Income tax payable |
|
597 |
|
|
|
— |
|
| Other current liabilities |
|
412 |
|
|
|
527 |
|
| Total current liabilities |
|
6,043 |
|
|
|
5,743 |
|
| Long-term debt, net |
|
82,708 |
|
|
|
82,797 |
|
| Lines of credit |
|
2,500 |
|
|
|
2,500 |
|
| Deferred income tax liabilities, net |
|
1,475 |
|
|
|
2,455 |
|
| Other liabilities |
|
— |
|
|
|
38 |
|
| Total liabilities |
|
92,726 |
|
|
|
93,533 |
|
|
|
|
|
|
|
|
|
| Stockholders’ equity: |
|
|
|
|
|
|
|
| Preferred stock, no par value, 1,000,000 shares authorized; none issued |
|
— |
|
|
|
— |
|
| Common stock, $1.00 par value, 15,000,000 shares authorized; 8,416,145 shares issued and 7,451,988 and 7,645,360 shares outstanding at March 31, 2026 and September 30, 2025, respectively |
|
8,416 |
|
|
|
8,416 |
|
| Additional paid in capital |
|
20,544 |
|
|
|
20,410 |
|
| Treasury stock, at cost, 964,157 and 770,785 shares held at March 31, 2026 and September 30, 2025, respectively |
|
(34,103 |
) |
|
|
(26,185 |
) |
| Retained earnings |
|
107,525 |
|
|
|
100,391 |
|
| Total Alico stockholders’ equity |
|
102,382 |
|
|
|
103,032 |
|
| Noncontrolling interest |
|
4,749 |
|
|
|
4,962 |
|
| Total stockholders’ equity |
|
107,131 |
|
|
|
107,994 |
|
| Total liabilities and stockholders’ equity |
$ |
199,857 |
|
|
$ |
201,527 |
|
|
|
|
|
|
|
|
|
|
|
|
|
|
|
|
|
|
|
|
|
|
|
|
|
|
|
|
|
|
|
|
|
|
|
|
|
|
|
|
|
| ALICO, INC. CONDENSED CONSOLIDATED STATEMENTS OF OPERATIONS (UNAUDITED) (in thousands, except per share amounts) |
|
|
|
|
|
|
|
|
|
|
|
|
|
|
|
|
|
|
|
|
|
|
|
|
|
|
|
|
|
|
|
|
Three Months Ended March 31, |
|
|
|
|
|
|
|
Six Months Ended March 31, |
|
|
|
|
|
|
|
2026 |
|
|
|
2025 |
|
|
|
2026 |
|
|
|
2025 |
|
|
| Operating revenues: |
|
|
|
|
|
|
|
|
|
|
|
|
|
|
|
| Alico Citrus |
$ |
3,791 |
|
|
$ |
17,253 |
|
|
$ |
4,674 |
|
|
$ |
33,579 |
|
| Land Management and Other Operations |
|
1,549 |
|
|
|
727 |
|
|
|
2,553 |
|
|
|
1,295 |
|
| Total operating revenues |
|
5,340 |
|
|
|
17,980 |
|
|
|
7,227 |
|
|
|
34,874 |
|
| Operating expenses: |
|
|
|
|
|
|
|
|
|
|
|
|
|
|
|
| Alico Citrus |
|
8,894 |
|
|
|
167,607 |
|
|
|
16,286 |
|
|
|
192,718 |
|
| Land Management and Other Operations |
|
1,034 |
|
|
|
70 |
|
|
|
1,083 |
|
|
|
91 |
|
| Total operating expenses |
|
9,928 |
|
|
|
167,677 |
|
|
|
17,369 |
|
|
|
192,809 |
|
| Gross loss |
|
(4,588 |
) |
|
|
(149,697 |
) |
|
|
(10,142 |
) |
|
|
(157,935 |
) |
| General and administrative expenses |
|
3,233 |
|
|
|
3,388 |
|
|
|
6,234 |
|
|
|
5,974 |
|
| Loss from operations |
|
(7,821 |
) |
|
|
(153,085 |
) |
|
|
(16,376 |
) |
|
|
(163,909 |
) |
| Other income, net: |
|
|
|
|
|
|
|
|
|
|
|
|
|
|
|
| Interest income |
|
552 |
|
|
|
59 |
|
|
|
939 |
|
|
|
106 |
|
| Interest expense |
|
(959 |
) |
|
|
(1,159 |
) |
|
|
(1,924 |
) |
|
|
(2,057 |
) |
| Gain on sale of property and equipment |
|
19,729 |
|
|
|
15,847 |
|
|
|
24,669 |
|
|
|
15,847 |
|
| Other income, net |
|
(4 |
) |
|
|
11 |
|
|
|
(4 |
) |
|
|
255 |
|
| Total other income, net |
|
19,318 |
|
|
|
14,758 |
|
|
|
23,680 |
|
|
|
14,151 |
|
| Income (loss) before income taxes |
|
11,497 |
|
|
|
(138,327 |
) |
|
|
7,304 |
|
|
|
(149,758 |
) |
| Income tax (benefit) provision |
|
215 |
|
|
|
(26,894 |
) |
|
|
(383 |
) |
|
|
(29,074 |
) |
| Net income (loss) |
|
11,282 |
|
|
|
(111,433 |
) |
|
|
7,687 |
|
|
|
(120,684 |
) |
| Net loss attributable to noncontrolling interests |
|
99 |
|
|
|
48 |
|
|
|
213 |
|
|
|
132 |
|
| Net income (loss) attributable to Alico, Inc. common stockholders |
$ |
11,381 |
|
|
$ |
(111,385 |
) |
|
$ |
7,900 |
|
|
$ |
(120,552 |
) |
| Per share information attributable |
|
|
|
|
|
|
|
|
|
|
|
|
|
|
|
| income (loss) per common share: |
|
|
|
|
|
|
|
|
|
|
|
|
|
|
|
| Basic |
$ |
1.49 |
|
|
$ |
(14.58 |
) |
|
$ |
1.03 |
|
|
$ |
(15.79 |
) |
| Diluted |
$ |
1.49 |
|
|
$ |
(14.58 |
) |
|
$ |
1.03 |
|
|
$ |
(15.79 |
) |
| Weighted-average number of |
|
|
|
|
|
|
|
|
|
|
|
|
|
|
|
| Basic |
|
7,626 |
|
|
|
7,637 |
|
|
|
7,639 |
|
|
|
7,635 |
|
| Diluted |
|
7,640 |
|
|
|
7,637 |
|
|
|
7,645 |
|
|
|
7,635 |
|
|
|
|
|
|
|
|
|
|
|
|
|
|
|
|
|
| Cash dividends declared per common share |
$ |
0.05 |
|
|
$ |
0.05 |
|
|
$ |
0.10 |
|
|
$ |
0.10 |
|
|
|
|
|
|
|
|
|
|
|
|
|
|
|
|
|
|
|
|
|
|
|
|
|
|
|
|
|
|
|
|
|
| ALICO, INC. CONDENSED CONSOLIDATED STATEMENTS OF CASH FLOWS (UNAUDITED) (in thousands) |
|
|
|
|
|
|
|
|
|
|
|
|
|
|
|
|
Six Months Ended March 31, |
|
|
|
|
|
|
|
2026 |
|
|
|
2025 |
|
|
| Net cash used in operating activities |
|
|
|
|
|
|
|
| Net income (loss) |
$ |
7,687 |
|
|
$ |
(120,684 |
) |
| Adjustments to reconcile net loss to net cash used in operating activities: |
|
|
|
|
|
|
|
| Depreciation, depletion and amortization |
|
10,628 |
|
|
|
126,261 |
|
| Amortization of debt issue costs |
|
87 |
|
|
|
166 |
|
| Gain on sale of property and equipment |
|
(24,669 |
) |
|
|
(15,847 |
) |
| Impairment of long-lived assets |
|
— |
|
|
|
24,966 |
|
| Loss on disposal of long-lived assets |
|
— |
|
|
|
780 |
|
| Inventory net realizable value adjustment |
|
— |
|
|
|
9,895 |
|
| Deferred income tax benefit |
|
(980 |
) |
|
|
(29,073 |
) |
| Stock-based compensation expense |
|
316 |
|
|
|
364 |
|
| Other |
|
(24 |
) |
|
|
(302 |
) |
| Changes in operating assets and liabilities: |
|
|
|
|
|
|
|
| Accounts receivable |
|
(1,456 |
) |
|
|
(9,202 |
) |
| Inventories |
|
2,740 |
|
|
|
12,942 |
|
| Prepaid expenses |
|
376 |
|
|
|
377 |
|
| Income tax receivable |
|
338 |
|
|
|
900 |
|
| Other assets |
|
(2 |
) |
|
|
(106 |
) |
| Accounts payable and accrued liabilities |
|
(224 |
) |
|
|
(2,457 |
) |
| Income taxes payable |
|
597 |
|
|
|
— |
|
| Other liabilities |
|
(223 |
) |
|
|
449 |
|
| Net cash used in operating activities |
|
(4,809 |
) |
|
|
(571 |
) |
|
|
|
|
|
|
|
|
| Cash flows from investing activities: |
|
|
|
|
|
|
|
| Purchases of property and equipment |
|
(1,207 |
) |
|
|
(3,481 |
) |
| Net proceeds from sale of property and equipment |
|
34,829 |
|
|
|
18,874 |
|
| Notes receivable |
|
— |
|
|
|
570 |
|
| Advance to Corkscrew Grove Stewardship District |
|
(5,071 |
) |
|
|
— |
|
| Net cash provided by investing activities |
|
28,551 |
|
|
|
15,963 |
|
|
|
|
|
|
|
|
|
| Cash flows from financing activities: |
|
|
|
|
|
|
|
| Repayments on revolving lines of credit |
|
— |
|
|
|
(21,200 |
) |
| Borrowings on revolving lines of credit |
|
— |
|
|
|
19,300 |
|
| Principal payments on term loans |
|
(125 |
) |
|
|
(705 |
) |
| Purchases of common stock |
|
(8,372 |
) |
|
|
— |
|
| Exercise of stock options |
|
272 |
|
|
|
— |
|
| Dividends paid |
|
(766 |
) |
|
|
(764 |
) |
| Net cash used in financing activities |
|
(8,991 |
) |
|
|
(3,369 |
) |
|
|
|
|
|
|
|
|
| Net increase in cash and cash equivalents and restricted cash |
|
14,751 |
|
|
|
12,023 |
|
| Cash and cash equivalents and restricted cash at beginning of the period |
|
38,890 |
|
|
|
3,398 |
|
|
|
|
|
|
|
|
|
| Cash and cash equivalents and restricted cash at end of the period |
$ |
53,641 |
|
|
$ |
15,421 |
|
|
|
|
|
|
|
|
|
| Supplemental disclosure of cash flow information |
|
|
|
|
|
|
|
| Cash paid for interest, net of amounts capitalized |
$ |
1,624 |
|
|
$ |
1,792 |
|
| Cash (received) paid for income taxes, net of refunds |
$ |
(349 |
) |
|
$ |
(900 |
) |
|
|
|
|
|
|
|
|
| Non-cash investing and financing activities: |
|
|
|
|
|
|
|
| Assets received in exchange for services |
$ |
348 |
|
|
$ |
— |
|
| Dividends declared but unpaid |
$ |
383 |
|
|
$ |
382 |
|
|
|
|
|
|
|
|
|
Non-GAAP Financial Measures
In addition to the measurements prepared in accordance with accounting principles generally accepted in the United States (“U.S. GAAP”), Alico utilizes EBITDA, Adjusted EBITDA and Net Debt, which are non-GAAP financial measures within the meaning of Regulation G and Item 10(e) of Regulation S-K, to evaluate the performance of its business, in the case of EBITDA and Adjusted EBITDA, and liquidity, in the case of Net Debt, of its business. Beginning with the reporting period ended December 31, 2025, we have revised the calculation of Adjusted EBITDA to better reflect the underlying performance of the business in light of the Strategic Transformation and changes to our model and operating strategy. Specifically, we now adjust for impairment of long-lived assets and restructuring and other charges, and have determined not to adjust for inventory net realizable value, gain or sale of property and equipment, or other historical adjustments.
Due to significant depreciable assets associated with the nature of our operations and, to a lesser extent, interest costs associated with our capital structure, management believes that EBITDA, Adjusted EBITDA and Net Debt are important measures to evaluate our results of operations between periods on a more comparable basis and to help investors analyze underlying trends in our business, evaluate the performance, in the case of EBITDA, Adjusted EBITDA, and liquidity, in the case of Net Debt, of our business both on an absolute basis and relative to our peers and the broader market, provide useful information to both management and investors by excluding certain items that may not be indicative of our core operating results and operational strength of our business and help investors evaluate our ability to service our debt. Such measurements are not prepared in accordance with U.S. GAAP and should not be construed as an alternative to reported results determined in accordance with U.S. GAAP. The non-GAAP information provided is unique to Alico and may not be consistent with methodologies used by other companies. EBITDA is defined as net income before interest expense, provision for income taxes, depreciation, depletion and amortization. Adjusted EBITDA is defined as EBITDA as further adjusted for impairment of long-lived assets and restructuring and other charges. Net Debt is defined as Current portion of long-term debt, Long-term debt, net and Lines of credit, less cash. We are unable to provide a reconciliation of Adjusted EBITDA to net (loss) income attributable to Alico, Inc. common stockholders for the year ended September 30, 2026 as the adjustments are not within our control or cannot be reasonably predicted without unreasonable effort.
EBITDA and Adjusted EBITDA
|
|
|
|
|
|
|
|
|
|
|
|
|
|
|
|
| (in thousands) |
(Unaudited) |
|
|
|
|
|
|
|
(Unaudited) |
|
|
|
|
|
|
|
Three Months Ended March 31, |
|
|
|
|
|
|
|
Six Months Ended March 31, |
|
|
|
|
|
|
|
2026 |
|
|
|
2025 |
|
|
|
2026 |
|
|
|
2025 |
|
|
| Net income (loss) attributable to Alico, Inc. common stockholders |
$ |
11,381 |
|
|
$ |
(111,385 |
) |
|
$ |
7,900 |
|
|
$ |
(120,552 |
) |
| Interest expense, net |
|
407 |
|
|
|
1,100 |
|
|
|
985 |
|
|
|
1,951 |
|
| Income tax provision (benefit) |
|
215 |
|
|
|
(26,894 |
) |
|
|
(383 |
) |
|
|
(29,074 |
) |
| Depreciation, depletion and amortization |
|
4,715 |
|
|
|
122,437 |
|
|
|
10,628 |
|
|
|
126,261 |
|
| EBITDA |
$ |
16,718 |
|
|
$ |
(14,742 |
) |
|
$ |
19,130 |
|
|
$ |
(21,414 |
) |
|
|
|
|
|
|
|
|
|
|
|
|
|
|
|
|
| Non-GAAP Adjustments: |
|
|
|
|
|
|
|
|
|
|
|
|
|
|
|
| Impairment of long-lived assets |
|
— |
|
|
|
24,966 |
|
|
|
— |
|
|
|
24,966 |
|
| Restructuring and other charges |
|
162 |
|
|
|
2,505 |
|
|
|
471 |
|
|
|
2,505 |
|
| Adjusted EBITDA |
$ |
16,880 |
|
|
$ |
12,729 |
|
|
$ |
19,601 |
|
|
$ |
6,057 |
|
|
|
|
|
|
|
|
|
|
|
|
|
|
|
|
|
Net Debt
|
|
|
|
|
|
|
|
|
|
|
|
|
| (in thousands) |
|
(Unaudited) |
|
|
|
|
|
|
|
(Forecasted) |
|
|
|
|
March 31, 2026 |
|
|
|
September 30, 2025 |
|
|
|
September 30, 2026 |
|
|
| Current portion of long-term debt |
|
$ |
250 |
|
|
$ |
250 |
|
|
$ |
250 |
|
| Long-term debt, net |
|
|
82,708 |
|
|
|
82,797 |
|
|
|
82,619 |
|
| Lines of credit |
|
|
2,500 |
|
|
|
2,500 |
|
|
|
2,500 |
|
| Total Debt |
|
|
85,458 |
|
|
|
85,547 |
|
|
|
85,369 |
|
| Less: Cash and cash equivalents |
|
|
(52,879 |
) |
|
|
(38,128 |
) |
|
|
(40,000 |
) |
| Net Debt |
|
$ |
32,579 |
|
|
$ |
47,419 |
|
|
$ |
45,369 |
|
|
|
|
|
|
|
|
|
|
|
|
|
|
Source: Alico, Inc.
Released May 11, 2026
Copyright © 2006-2026 Alico, Inc. All Rights Reserved.