ADI
Fiscal year ends October Quarters are offset from the calendar — Q1 is Nov–Jan

Analog Devices, Inc. is a semiconductor company that designs, manufactures, tests, and markets integrated circuits, software, and subsystems. The company provides high-performance analog, mixed-signal, and digital signal processing technologies, including data converters, amplifiers, power management ICs, radio frequency (RF) ICs, edge processors, and sensors. Its product portfolio serves industrial, automotive, communications, consumer, and healthcare markets, supporting applications in digitized factories, mobility, and digital healthcare. Analog Devices sells to original equipment manufacturers (OEMs) and subsystem builders worldwide, with manufacturing facilities in the United States, Ireland, and Southeast Asia. Incorporated in 1965, the company focuses on bridging analog, digital, and AI technologies to enable intelligent systems that sense, process, and respond to real-world conditions.

Summarised from the company's own disclosures, fiscal year ended Nov 2025

Industry Semiconductors Homepage analog.com
Sector Technology IR page investor.analog.com
Tags
analog ics, mixed-signal ics, data converters, power management, rf ics, edge processors, sensors, industrial automation, automotive electronics, communications infrastructure, healthcare electronics
Press page —

Metrics

Valuation  
Market cap $ 184.754B
Market cap (USD) $ 184.754B
P/E 45.23
PEG —
P/BV 5.51
P/S 13.31
P/OCF 33.32
P/FCF 37.42
Dividend yield 1.1%
Turnover / mcap —
Returns  
ROE 6.6%
ROI 5.4%
ROIC 5.8%
Profit margin 20.6%
Growth  
Revenue growing No
Profits growing No
Revenue up 3y No
Revenue up 5y No
Earnings growth 3y (net profit CAGR) -6.2%
Quality  
Profitable Yes
Margin expanding No
Buying back stock Yes
Diluting (TTM) No
Debt/Equity 24.2%
Podcast bulls (TTM) Sign up
Podcast bears (TTM) Sign up
Podcast sentiment (TTM) Sign up
Podcast sentiment % (TTM) Sign up
News sentiment (TTM) 32
Quality score -26.3%
Insiders  
Buys, 1w Sign up
Buys, 1m Sign up
Buys, 1y Sign up
Sells, 1w Sign up
Sells, 1m Sign up
Sells, 1y Sign up

Sign up to see this company's insider trades

Figure FY 2025 FY 2024 FY 2023 FY 2022 FY 2021 FY 2020 FY 2019 FY 2018 FY 2017 FY 2016 FY 2015 FY 2014 FY 2013 FY 2012 FY 2011 FY 2010 FY 2009 FY 2008 FY 2007 FY 2006 FY 2005 FY 2004 FY 2003 FY 2002 FY 2001 FY 2000
Revenue 11.02B 9.427B 12.306B 12.014B 7.318B 5.603B 5.991B 6.201B 5.108B 3.421B 3.435B 2.865B 2.634B 2.701B 2.993B 2.762B 2.015B 2.583B 2.546B 2.573B 2.389B 2.634B 2.047B 1.708B 2.277B 2.578B
Net profit 2.267B 1.635B 3.315B 2.749B 1.39B 1.221B 1.363B 1.495B 727.259M 861.664M 696.878M 629.32M 673.487M 651.236M 867.394M 712.084M 247.772M 786.284M 496.907M 549.482M 414.787M 570.738M 298.281M 105.299M 356.377M 607.132M
Free cash flow 4.279B 3.122B 3.556B 3.776B 2.391B 1.843B 1.978B 2.187B 908.494M 1.153B 753.838M 693.689M 789.271M 682.366M 777.533M 879.618M 376.053M 511.96M 678.555M 491.805M 587.247M 631.8M 365.228M 168.714M 546.377M 429.668M

Figure FY 2025 FY 2024 FY 2023 FY 2022 FY 2021 FY 2020 FY 2019 FY 2018 FY 2017 FY 2016 FY 2015 FY 2014 FY 2013 FY 2012 FY 2011 FY 2010 FY 2009 FY 2008 FY 2007 FY 2006 FY 2005 FY 2004 FY 2003 FY 2002 FY 2001 FY 2000
Share price 234.95 223.87 175.09 139.12 173.18 124.56 108.81 85 90 64.42 60.06 49.64 49.42 39.08 31.25 31.38 27.56 26.35 36.51 30.07 — — — — — —
Price performance 12m 0.05 0.28 0.26 -0.2 0.39 0.14 0.28 -0.06 0.4 0.07 0.21 0 0.26 0.25 -0 0.14 0.05 -0.28 0.21 — — — — — — —

Filed figures

Figure Oct 2016 Oct 2017 Oct 2018 Oct 2019 Oct 2020 Oct 2021 Oct 2022 Oct 2023 Oct 2024 Oct 2025
Balance sheet detail
Trade receivables (USD) 478M 689M 640M 635M 738M 1.46B 1.8B 1.47B 1.34B 1.44B
↳ YoY growth +2.4% +44.3% -7.1% -0.7% +16.1% +97.8% +23.4% -18.4% -9.1% +7.5%
↳ 5y CAGR +6.5% +15.2% +14.5% +9.9% +9.6% +25.0% +21.2% +18.1% +16.0% +14.3%
Borrowings, current (USD) 0.00 300M 67M 300M 0.00 517M 0.00 1.05B 947M 893M
Borrowings, non-current (USD) — — — — — — 6.55B 5.9B 6.63B 8.15B
Lease liabilities (USD) — — — — 328M 348M 391M 425M 387M 357M
Cash and deposits (USD) 921M 1.05B 817M 648M 1.06B 1.98B 1.47B 958M 1.99B 2.5B
Intangible assets (USD) 549M 5.32B 4.78B 4.22B 3.65B 15.3B 13.3B 11.3B 9.59B 8.01B
Right-of-use assets (USD) — — — — 257M 280M 263M 277M 243M 230M
Net debt (borrowings + leases - cash) (USD) -921M -748M -750M -349M -1.06B -1.46B -1.08B 6.42B 5.98B 6.9B
Cash flow detail
Operating cash flow (USD) 1.28B 1.11B 2.44B 2.25B 2.01B 2.74B 4.48B 4.82B 3.85B 4.81B
Purchases of property, plant and equipment (USD) -127M -204M -255M -275M -166M -344M -699M -1.26B -730M -534M
Change in receivables (cash effect) (USD) -9.39M -65.7M 46M 5.89M -102M -115M -344M 331M 133M -91M
Change in inventories (cash effect) (USD) 38.2M -47.4M -34.6M -42.8M 1.76M -65.1M -471M -242M 191M -209M
Change in payables (cash effect) (USD) — 86M -18.4M -6.37M 103M 208M 172M -499M -134M 657M
Dividends paid (cash effect) (USD) -513M -602M -703M -777M -886M -1.11B -1.54B -1.68B -1.8B -1.92B
Share buybacks (cash effect) (USD) -370M -46.5M -226M -613M -244M -2.61B -2.58B -2.96B -616M -2.16B
Interest paid (cash effect) (USD) -41.7M -183M -233M -216M -186M -198M -173M -206M -268M -256M
Income taxes paid (cash effect) (USD) -77.9M -868M -211M -206M -238M -388M -822M -987M -415M -568M
Share-based compensation (USD) 63.4M 104M 151M 150M 150M 244M 323M 300M 263M 322M
Operating cash flow before change in receivables (USD) 1.29B 1.18B 2.4B 2.25B 2.11B 2.85B 4.82B 4.49B 3.72B 4.9B
Free cash flow (OCF - PPE - intangibles) (USD) 1.15B 908M 2.19B 1.98B 1.84B 2.39B 3.78B 3.56B 3.12B 4.28B
Income detail
Research and development expense (USD) 654M 969M 1.17B 1.13B 1.05B 1.3B 1.7B 1.66B 1.49B 1.77B
↳ 5y CAGR +5.3% +13.6% +17.8% +15.1% +10.5% +14.7% +11.9% +7.3% +5.7% +10.9%
Total comprehensive income (USD) 839M 740M 1.5B 1.23B 1.16B 1.45B 2.74B 3.32B 1.64B 2.3B
Comprehensive income to owners (USD) 839M 740M 1.5B 1.23B 1.16B 1.45B 2.74B 3.32B 1.64B 2.3B
Reported Nov 22, 2017 Nov 26, 2019 Nov 26, 2019 Feb 19, 2020 Feb 17, 2021 Feb 16, 2022 Nov 21, 2023 Nov 21, 2023 Nov 26, 2024 Nov 25, 2025

Sign up to see institutional holdings

Sign Up

Podcast Mentions

Sign up to see podcast mentions and sentiment

Sign Up

Analog Devices Completes Acquisition of Alif Semiconductor

Wilmington, MA

Nov 3 2026

addToMyAnalog Add to myAnalog

share Share

Copy Link

Send to Email

Analog Devices, Inc. (NASDAQ: ADI ) today announced the completion of its acquisition of Alif Semiconductor. The combination of ADI’s leadership across sensing, signal processing, power, connectivity and application software, with Alif’s AI-native microcontrollers and fusion processors, expands ADI’s total addressable market and accelerates innovation across industrial, data center infrastructure, defense, energy, robotics, digital health and wearable applications.

alif semiconductor adi logo

Commentary

  • “We are excited to welcome the Alif team to ADI and begin realizing the potential of bringing our technologies together,” said Vincent Roche, CEO and Chair of ADI. “For decades, ADI has helped customers solve their most complex system-level challenges through deep domain expertise and a cutting-edge technology portfolio spanning the physical-digital boundary. Alif’s AI-native platform builds on that foundation, advancing systems that can understand real-world signals, reason and act locally within demanding power, latency, security and reliability constraints. This is physical intelligence in action.”

About Analog Devices, Inc.

Analog Devices, Inc. (NASDAQ: ADI ) is a global semiconductor leader that bridges the physical and digital worlds to enable breakthroughs at the Intelligent Edge. ADI combines analog, digital, AI, and software technologies into solutions that combat climate change, reliably connect humans and the world, and help drive advancements in automation and robotics, mobility, healthcare, energy and data centers. With revenue of more than $11 billion in FY25, ADI ensures today's innovators stay Ahead of What's Possible. Learn more at www.analog.com  and on LinkedIn and X .

_

Forward-Looking Statements

This press release contains forward-looking statements, which address a variety of subjects including, for example, the expected benefits of the transaction; ADI’s expected product offerings and benefits of those offerings, product development, and technical advances resulting from the transaction; markets, market position, addressable markets, and growth opportunities; and other future events. Statements that are not historical facts, including statements about our beliefs, plans, and expectations, are forward-looking statements. Such statements are based on our current expectations and are subject to a number of factors and uncertainties, which could cause actual results to differ materially from those described in the forward-looking statements. The following important factors and uncertainties, among others, could cause actual results to differ materially from those described in these forward-looking statements: unforeseen or unknown liabilities; costs or expenses related to the transaction; the inability to retain key personnel; difficulties in integrating the acquired business; the risk that expected benefits of the transaction may not be realized or may take longer to realize than expected; and uncertainty as to the long-term value of our common stock. For additional information about factors that could cause actual results to differ materially from those described in the forward-looking statements, please refer to our filings with the Securities and Exchange Commission, including the risk factors contained in our most recent Annual Report on Form 10-K and Quarterly Report on Form 10-Q. Forward-looking statements represent management’s current expectations and are inherently uncertain. Except as required by law, we do not undertake any obligation to update forward-looking statements made by us to reflect subsequent events or circumstances.

_

addToMyAnalog Add to myAnalog

share Share

Copy Link

Send to Email

Media Contact

Jeff Ambrosi

(781) 461-3282

Senior Director, Investor Relations, Analog Devices, Inc.

[mail](mailto: [email protected])

Ferda Millan

(408) 373-1854

Global PR & External Communications, Analog Devices, Inc.

[mail](mailto: [email protected])

Related to this Press Release

Related to this Press Release

modal bookmark icon

{{modalTitle}}

modal close icon

{{modalDescription}}

{{dropdownTitle}}

input down arrow

  • {{defaultSelectedText}} {{#each projectNames}}* {{name}} {{/each}} {{#if newProjectText}}* plus icon {{newProjectText}} {{/if}}

{{#if toggleButtonDescription}}

{{toggleButtonDescription}}

{{/if}} {{#if newProjectTitle}}

{{newProjectTitle}}

{{newProjectNameText}}

{{projectNameErrorText}}

{{newProjectDescriptionText}}

{{/if}}

{{cancelButtonText}} {{confirmButtonText}}

Analog Devices to Report Fourth Quarter Fiscal Year 2026 Financial Results on Tuesday, November 24, 2026

Wilmington, MA

Oct 22 2026

addToMyAnalog Add to myAnalog

share Share

Copy Link

Send to Email

Analog Devices, Inc. (Nasdaq: ADI ) today announced it will release financial results for the fourth quarter fiscal year 2026 at 7:00 a.m. Eastern time on Tuesday, November 24, 2026. Following the press release, the Company will host a conference call at 10:00 a.m. Eastern time, the same day. Vincent Roche, Chair and CEO, Richard Puccio, Chief Financial Officer, and Jeff Ambrosi, Head of Investor Relations, will discuss ADI's results and business outlook.

The press release, live conference call, and subsequent archived copies can be accessed on Analog Devices' Investor Relations website at investor.analog.com . To participate in the live conference call, please pre-register at: register-conf.media.server.com . Upon registering, you will be emailed a dial-in number and unique PIN.

About Analog Devices, Inc.

Analog Devices, Inc. (NASDAQ: ADI ) is a global semiconductor leader that bridges the physical and digital worlds to enable breakthroughs at the Intelligent Edge. ADI combines analog, digital, AI, and software technologies into solutions that combat climate change, reliably connect humans and the world, and help drive advancements in automation and robotics, mobility, healthcare, energy and data centers. With revenue of more than $11 billion in FY25, ADI ensures today's innovators stay Ahead of What's Possible. Learn more at www.analog.com  and on LinkedIn and X .

addToMyAnalog Add to myAnalog

share Share

Copy Link

Send to Email

Media Contact

Jeff Ambrosi

(781) 461-3282

Senior Director, Investor Relations, Analog Devices, Inc.

[mail](mailto: [email protected])

Related to this Press Release

Related to this Press Release

modal bookmark icon

{{modalTitle}}

modal close icon

{{modalDescription}}

{{dropdownTitle}}

input down arrow

  • {{defaultSelectedText}} {{#each projectNames}}* {{name}} {{/each}} {{#if newProjectText}}* plus icon {{newProjectText}} {{/if}}

{{#if toggleButtonDescription}}

{{toggleButtonDescription}}

{{/if}} {{#if newProjectTitle}}

{{newProjectTitle}}

{{newProjectNameText}}

{{projectNameErrorText}}

{{newProjectDescriptionText}}

{{/if}}

{{cancelButtonText}} {{confirmButtonText}}
From Sensor Data to Robust SLAM: ADI Extensions for NVIDIA cuVSLAM

Wilmington, MA

Oct 21 2026

addToMyAnalog Add to myAnalog

share Share

Copy Link

Send to Email

How ADI and NVIDIA Extended cuVSLAM with Wheel Encoders, IMUs, and Adaptive Sensor Fusion

Over the last decade, researchers made great strides improving the way robots find their way around a broad range of environments. Simultaneous localization and mapping algorithms, or SLAM, allow machines to build a map of an unfamiliar environment while simultaneously estimating their own positions within that map. SLAM draws on a variety of sensors, including cameras, which form the basis of visual SLAM, or VSLAM.

NVIDIA cuVSLAM , a CUDA accelerated robotics library, was developed to deliver accurate, robust, real-time VSLAM on edge-computing platforms such as NVIDIA Jetson. To extend NVIDIA cuVSLAM’s capabilities, engineers at Analog Devices, Inc. (ADI) and NVIDIA collaborated to extend the library and overcome many common SLAM challenges. Test results of the joint effort are promising:

  • Wheel-encoder fusion reduced average position error by 60%, helping maintain localization through camera blackout and wheel slip.
  • Improved position accuracy in 26 of 30 indoor sequences, particularly in structured, low-texture environments.
  • Reduced average position error by 27.7% on EuRoC dataset by dynamically balancing camera and IMU measurements.

Why Industrial Environments Expose SLAM Limitations

VSLAM detects and tracks distinctive visual features in camera images, such as corners, edges, and textured patterns. It uses these observations to estimate the path the robot should follow. VSLAM algorithms use camera imagery, sometimes combined with IMU measurements, to produce real-time odometry, the process estimating how a robot’s position and orientation change as it moves. That estimator at the heart of the SLAM algorithm handles this work and also limits the effects of sensor noise and drift.

The approach is effective, but industrial environments contain difficult operating conditions:

  • Uniform walls and floors provide few distinctive point features.
  • Repetitive storage racks and structural elements.
  • Fast-turning robots introduce blur imagery.
  • Occlusion, such as one object blocking another, or poor lighting.

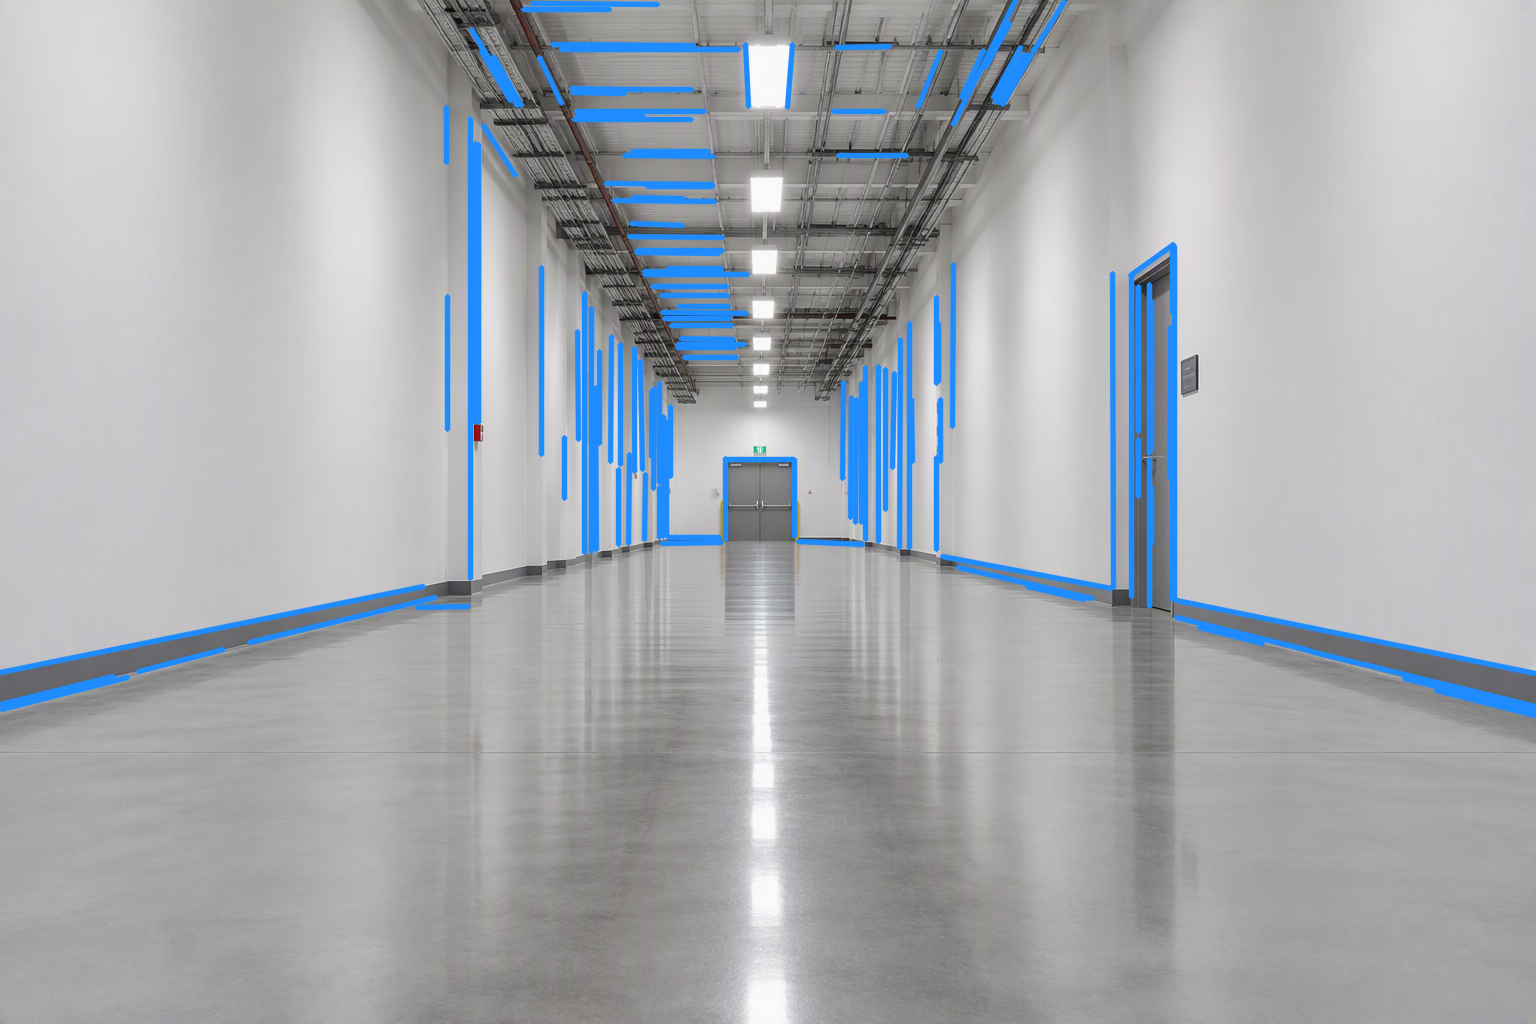
A featureless corridor commonly found in warehouses that makes typical scanning LIDAR odometry degenerate and where too few point features exist to constrain visual odometry. (IMAGE GENERATED USING AI)

Figure 1 A featureless corridor commonly found in warehouses that makes typical scanning LIDAR odometry degenerate and where too few point features exist to constrain visual odometry. (IMAGE GENERATED USING AI)

No single measurement source can overcome every case. Cameras constrain drift against the environment but depend on scene appearance. Encoders measure wheel motion on surfaces but accumulate errors and struggle when wheels slip. Inertial measurement units (IMUs) provide frequent motion updates, but small measurement errors accumulate over time and cause the position estimate to drift or lose precision.

The engineering problem is therefore not simply to add sensors. It is to integrate complementary measurements into the estimator, detect when individual measurements become unreliable, and preserve real-time execution on embedded hardware.

Adding Wheel Encoders Directly to cuVSLAM

The first ADI extension brings wheel measurements directly into cuVSLAM. Wheel encoders measure how far and in what direction a robot’s wheels move, giving the system another source of information alongside its cameras.

Rather than estimating movement separately from cameras and wheels and combining the results later, the enhanced system evaluates both sources together. This produces a more reliable estimate of the robot’s path and supports common mobile-robot designs, including differential-drive robots and car-like Ackermann-steered vehicles.

Differential-drive kinematics for an industrial mobile robot. Independent left and right wheel velocities enable straight-line motion, turning, and rotation in place. In this work we support the differential-drive and Ackermann steering models (IMAGE GENERATED USING AI).

Figure 2 Differential-drive kinematics for an industrial mobile robot. Independent left and right wheel velocities enable straight-line motion, turning, and rotation in place. In this work we support the differential-drive and Ackermann steering models (IMAGE GENERATED USING AI).

Testing with two high-resolution ADI TMCS-40 optical encoders showed a significant improvement. Across 13 ADI-AMR trajectory segments, the average position error fell from 24.2 to 9.7 centimeters when adding wheel measurements to vision. The worst error dropped from 1.923 meters to 0.275 meters, while runtime increased from 1.40 ms to 1.81 ms per frame on the evaluated NVIDIA Jetson platform.

Most importantly, the system’s prevented large errors during sharp, rotation-heavy movements. For deployed robots, avoiding these rare but serious failures can matter more than a modest improvement in average accuracy.

Handling Camera Blackout and Wheel Slip

Wheel encoders can help a robot maintain its position when camera images are unavailable, but wheel measurements are not always reliable. The enhanced system is therefore able to detect problems with either source, adjusting how it estimates the robot’s movement.

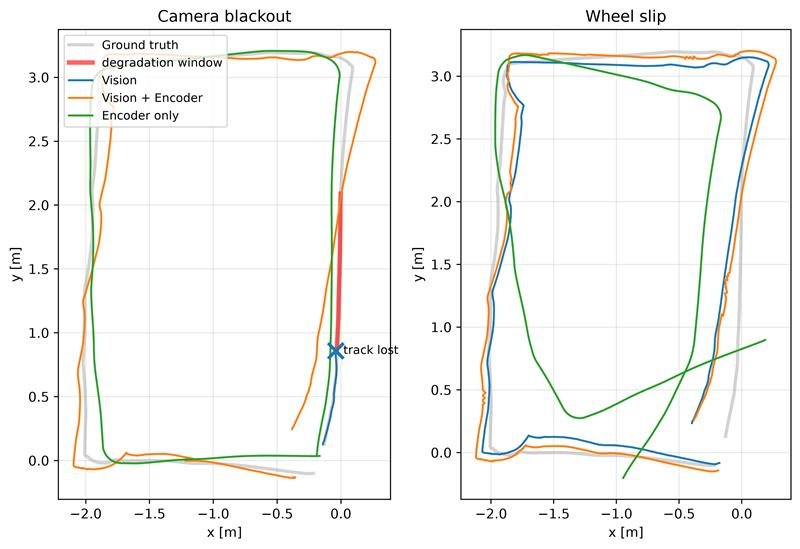
The team tested the enhancement by blocking the camera for five seconds in robots with and without a wheel encoder. Robots with a camera-encoder combination detected the loss of useful images and temporarily switched control to rely on wheel encoder data. The original algorithm in camera-only robots lost track of the robot. Robots sporting the combined system limited the position error to 13.2 centimeters until visual tracking resumed.

Robot trajectories under different conditions; vision loss and wheel slip

Figure 3 Robot trajectories under different conditions; vision loss and wheel slip

The opposite problem occurs when the wheels slip. In this situation, the encoders may report that the wheels are turning even though the robot is not moving as expected. The enhanced system compares wheel measurements with an independent camera-based estimate. If the two disagree significantly, the system reduces its reliance on the wheel data. During testing, wheel encoders alone produced an error of 1.106 meters, while the wheel and camera-enabled robots limited the error to 28.7 centimeters, close to the 24.9-centimeter result achieved with vision alone.

Together, these tests demonstrate an important design principle: wheel sensing should keep the robot localized when vision fails, while vision should prevent wheel slip from sending the robot off course. ADI’s tightly integrated approach achieves this by incorporating its extension directly into cuVSLAM’s position-estimation process.

Using Weak Geometry to Improve Tracking

Despite improving algorithm performance, wheel encoders lose accuracy due to wheel slip and accumulated measurement errors. As mentioned above, vision-only algorithms struggle in environments with large plain surfaces that offer too few distinct corners or textured points to track reliably. These environments often still contain persistent lines, such as the edges of door frames, shelves, floors, and walls.

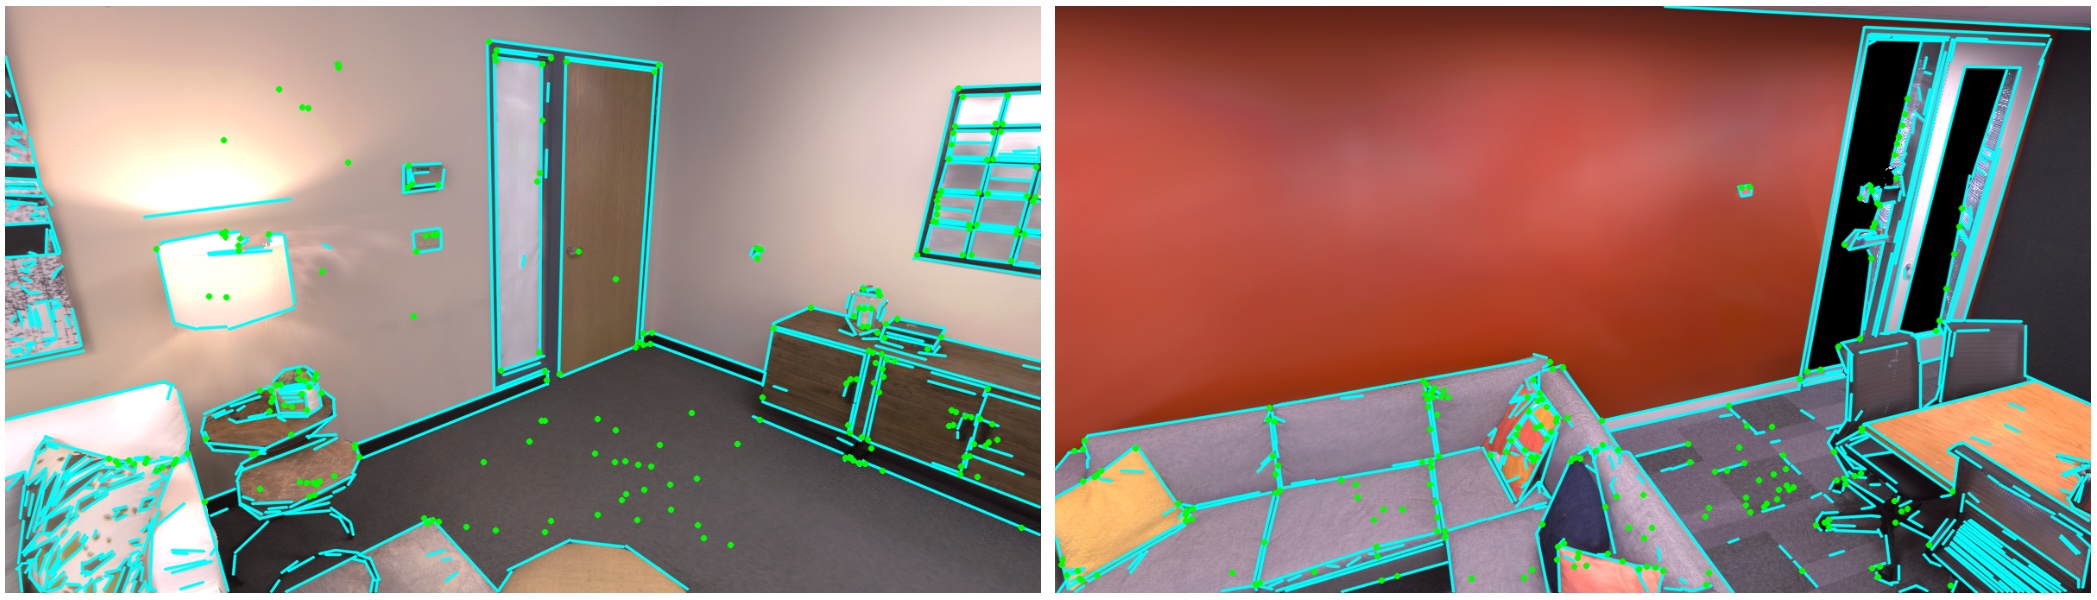
The team’s second extension leveraged that fact to enable cuVSLAM to detect and track these lines alongside the existing visual points it was already tracking. Lines also provide additional information about the structure of the environment, helping the system estimate the robot’s movement when only a few reliable points remain visible.

Figure 4  Line features (cyan) and point features (green) on Replica room and office scenes.

Figure 4 Line features (cyan) and point features (green) on Replica room and office scenes.

Yet tracking lines presents its own challenges. A line may appear shorter, longer, or partly hidden as the robot moves and the camera’s view changes. Repeating structures, such as rows of similar shelves, can also cause the system to match the wrong lines. To establish a line’s position accurately, the system generally needs to observe the line from multiple viewpoints.

Previous visual-inertial systems have demonstrated the value of combining points and lines. ADI’s work brings this approach into cuVSLAM and adds persistent line tracking, the fusion of observations from multiple viewpoints, adaptive balancing between points and lines, and GPU-accelerated processing within cuVSLAM’s existing position-estimation system.

Testing this approach using 30 indoor sequence datasets showed that position accuracy improved in 26 of the tests, and both ‘base’ point-tracking cuVSALM and the point-and-line configurations completed every sequence without losing track.

The greatest improvements appeared in structured environments with plain surfaces and few distinctive visual details. Performance declined slightly in some scenes containing nearby, repetitive structures, which could cause incorrect line matches. These results highlight an important lesson: tracking a smaller number of reliable lines is more valuable than tracking many uncertain ones. Future improvements could help the system identify unreliable line measurements and give them less influence.

Smart Fusion: Adaptive Balance Between Cameras and IMUs

The wheel-encoder and line-feature developments give cuVSLAM additional information. ADI’s third extension, Smart Fusion, takes a different approach: it continuously balances how much the system trusts the camera and the IMU based on current conditions.

Normally, cuVSLAM uses a fixed balance between camera observations and IMU measurements. It establishes that balance during calibration, but as we discussed - camera reliability can change as a robot moves and environments change.

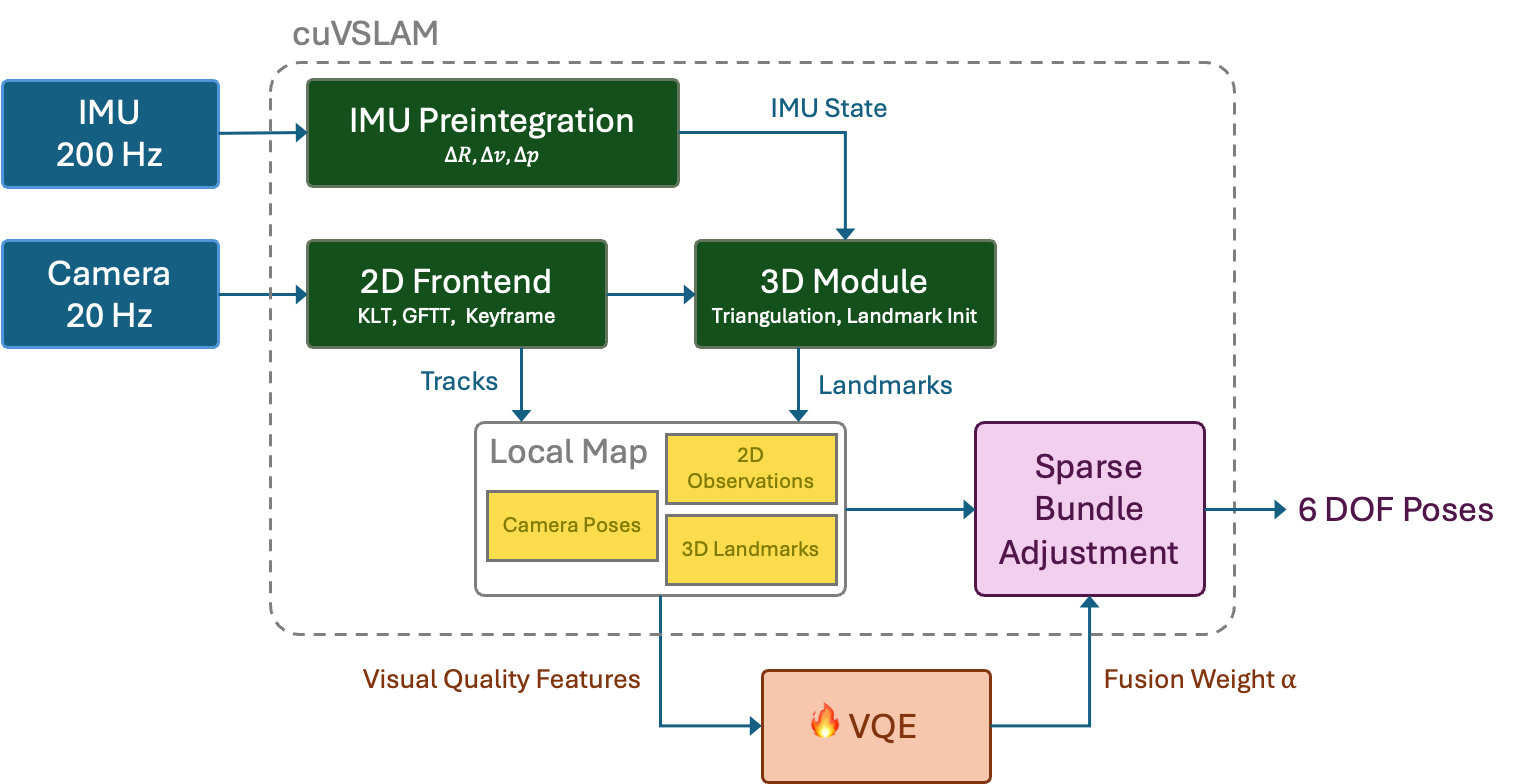
The Visual Quality Estimator (VQE) within Smart Fusion predicts α from 10-dimensional visual quality features before each sparse bundle adjustment (SBA) call, replacing the fixed default α=1.0.

Figure 5 The Visual Quality Estimator (VQE) within Smart Fusion predicts α from 10-dimensional visual quality features before each sparse bundle adjustment (SBA) call, replacing the fixed default α=1.0.

Smart Fusion evaluates the quality of the available visual information before each position update. It then selects one of two modes:

  • VISION-TRUST: When visual features are plentiful, stable, and well-distributed it gives greater influence to camera observations.
  • IMU-TRUST: When visual features are lost or camera-based estimates become less reliable, gives greater influence to IMU measurements.

A small machine-learning model makes this choice using ten indicators already collected by the tracker. These include the number and distribution of visible features, how long features remain visible, estimated depth, camera-tracking error, and the timing of IMU measurements. The model contains only 914 adjustable parameters, making it small enough to run before every position update.

This approach adjusts the overall balance between vision and the IMU. It works alongside cuVSLAM’s existing safeguards, which identify and reduce the influence of individual inaccurate measurements.

The team evaluated Smart Fusion against the EuRoC MAV and TUM-VI Room datasets using a testing method that kept each evaluation sequence separate from the data used to train the model.

Across all 11 EuRoC sequences, the average position error decreased from 20.2 centimeters to 14.6 centimeters, an improvement of 27.7%. Across five TUM-VI Room sequences, the average error decreased from 27.0 centimeters to 23.0 centimeters, an improvement of 14.9%.

Importantly, Smart Fusion does not replace cuVSLAM with a large, end-to-end AI model. Instead, it uses a compact machine-learning model to make one specific and understandable decision: whether the system should place more trust in its cameras or its IMU at a given moment.

Three Extensions, One System Strategy

The wheel-encoder, line-feature, and Smart Fusion projects respond to three different failure modes:

ADI Extension Primary Challenge Solution
Wheel encoder fusion Camera dropout, blur, weak visual tracking Incorporate wheel-motion information
Weak geometry support Too few visual details Tracks structural edges and lines
Smart Fusion Changing visual measurement quality Ongoing visual-IMU weighting

The value lies in the combination.

Wheel encoders supply short-term metric motion when camera observations weaken. Structural lines extract constraints from scenes where corner features are scarce. Smart Fusion changes estimator behavior as the quality of visual evidence varies. Each extension retains explicit geometric and sensor models, and each is designed to fit the existing cuVSLAM architecture rather than create a separate localization stack.

What This Enables for Robotics Engineers

ADI’s cuVSLAM extensions show the way towards a localization stack that successfully incorporates multiple sensing modalities without abandoning a validated visual estimator.

For system designers, the practical benefits are broad:

Enhanced robustness combining visual optimization and wheel encoder data – even when vision data is unavailable or wheels slip - even in low-texture environments. The GPU compatible extensions also incorporate and balance IMU data and offer common interfaces across wheeled platforms.

This is also a great example of system co-design: Sensors, estimation software, and compute should be developed as one system. Sensor quality determines the information available to the estimator. Estimator design determines how that information affects the trajectory. Compute architecture determines whether the complete pipeline can meet the robot’s latency and power constraints.

Next Steps

If you are interested in learning more details about ADI’s Extensions for cuVSLAM, you can read the complete scientific articles:

addToMyAnalog Add to myAnalog

share Share

Copy Link

Send to Email

Related to this Press Release

Related to this Press Release

modal bookmark icon

{{modalTitle}}

modal close icon

{{modalDescription}}

{{dropdownTitle}}

input down arrow

  • {{defaultSelectedText}} {{#each projectNames}}* {{name}} {{/each}} {{#if newProjectText}}* plus icon {{newProjectText}} {{/if}}

{{#if toggleButtonDescription}}

{{toggleButtonDescription}}

{{/if}} {{#if newProjectTitle}}

{{newProjectTitle}}

{{newProjectNameText}}

{{projectNameErrorText}}

{{newProjectDescriptionText}}

{{/if}}

{{cancelButtonText}} {{confirmButtonText}}

Prompts

Analog Devices, Inc. (ticker ADI), listed in United States.

Company History

Date Change Detail
Jan 31, 2017 Acquired Acquired Linear Technology Corp (CIK 791907). Its filings from before the deal are on its own company page, not shown here.
May 6, 2014 Acquired Acquired Hittite Microwave Corp (CIK 1130866). Its filings from before the deal are on its own company page, not shown here.

ETFs Holding Analog Devices, Inc.

ETF Weight in ETF Shares Market value As of
SGRT 10.33% 14,668 $ 5.62M Nov 17, 2026
ULTY 5.64% 74,600 $ 28.584M Nov 17, 2026
RJDI 4.93% 12,467 $ 4.952M Jun 30, 2026
STRN 4.85% 3,194 $ 1.224M Nov 17, 2026
CTIF 4.57% 23,397 $ 8.98M Nov 18, 2026
FPAG 4.51% 61,293 $ 24.344M Jun 30, 2026
MOTO 4.19% 1,026 $ 407.496K Jun 30, 2026
SOXY 4.05% 5,842 $ 2.238M Nov 17, 2026
EQTY 3.69% 143,052 $ 52.559M Jul 31, 2026
CHPY 3.63% 104,775 $ 40.147M Nov 17, 2026
TDVI 3.51% 57,427 $ 23.492M Nov 11, 2026
USSE 3.49% 31,579 $ 12.542M Jun 30, 2026
DIVL 3.47% 5,250 $ 2.085M Jun 30, 2026
LRNZ 3.21% 3,386 $ 1.345M Jun 30, 2026
JPEF 3.12% 157,418 $ 60.397M Nov 17, 2026
CARK 2.98% 25,877 $ 9.507M Jul 31, 2026
DAK 2.88% 3,148 $ 1.21M Nov 18, 2026
FRIZ 2.62% 346 $ 137.421K Jun 30, 2026
HEQQ 2.17% 1,660 $ 636.892K Nov 17, 2026
CLCV 2.13% 993 $ 364.838K Jul 31, 2026
RULE 2.09% 905 $ 359.439K Jun 30, 2026
ACEP 1.99% 5,110 $ 1.96M Nov 18, 2026
BAFE 1.98% 84,233 $ 33.455M Jun 30, 2026
MFSV 1.85% 30,664 $ 11.105M Aug 31, 2026
BAMD 1.85% 5,036 $ 1.824M Aug 31, 2026
DVND 1.84% 2,445 $ 971.081K Jun 30, 2026
TEC 1.80% 283 $ 112.626K Nov 13, 2026
QMOM 1.80% 17,889 $ 6.86M Nov 18, 2026
HUSV 1.67% 2,505 $ 959.841K Nov 16, 2026
BRES 1.67% 26,559 $ 10.19M Nov 18, 2026
FLV 1.59% 16,759 $ 6.069M Aug 31, 2026
LOWV 1.51% 8,502 $ 3.079M Aug 31, 2026
DUNK 1.49% 6,434 $ 2.465M Nov 17, 2026
VUS 1.47% 716 $ 263.066K Jul 31, 2026
VFMV 1.47% 18,337 $ 6.641M Aug 31, 2026
FTLS 1.42% 96,372 $ 0.00 Nov 16, 2026
ZECP 1.30% 13,538 $ 4.903M Aug 31, 2026
NXTE 1.28% 1,851 $ 735.162K Jun 30, 2026
JTEK 1.27% 130,805 $ 50.186M Nov 17, 2026
FMAG 1.24% 8,334 $ 3.062M Jul 31, 2026
AGRW 1.23% 3,771 $ 1.386M Jul 31, 2026
GGTL 1.21% 408 $ 162.045K Jun 30, 2026
AMOM 1.19% 772 $ 283.641K Jul 31, 2026
ACLC 1.19% 10,664 $ 3.862M Aug 31, 2026
DIVE 1.18% 1,540 $ 590.082K Nov 17, 2026
BEEX 1.17% 5,713 $ 2.189M Nov 17, 2026
LVDS 1.16% 3,608 $ 1.384M Nov 17, 2026
JEPQ 1.14% 1,220,165 $ 468.141M Nov 17, 2026
ALRG 1.10% 251 $ 92.22K Jul 31, 2026
FLCV 1.10% 4,234 $ 1.533M Aug 31, 2026
WINN 1.00% 28,746 $ 11.44M Nov 13, 2026
FWD 0.97% 85,885 $ 31.102M Aug 31, 2026
TUG 0.96% 828 $ 328.857K Jun 30, 2026
PY 0.95% 5,296 $ 2.103M Jun 30, 2026
TMAT 0.93% 5,991 $ 2.201M Jul 31, 2026
FEAC 0.90% 589 $ 233.933K Jun 30, 2026
INFO 0.90% 22,349 $ 8.894M Nov 13, 2026
TUGN 0.89% 1,786 $ 709.346K Jun 30, 2026
DFUV 0.88% 334,797 $ 137.029M Nov 12, 2026
TTEQ 0.79% 9,645 $ 3.696M Nov 17, 2026
BAMG 0.77% 2,725 $ 986.832K Aug 31, 2026
BRNY 0.74% 10,664 $ 4.09M Nov 18, 2026
DFLV 0.70% 131,759 $ 53.928M Nov 12, 2026
HBTA 0.69% 4,726 $ 1.711M Aug 31, 2026
SGLC 0.67% 3,914 $ 1.417M Aug 31, 2026
ACVF 0.66% 2,717 $ 998.253K Jul 31, 2026
LCDS 0.63% 263 $ 100.905K Nov 17, 2026
PAPI 0.62% 6,277 $ 2.493M Jun 30, 2026
JOYT 0.61% 1,892 $ 725.904K Nov 17, 2026
JAVA 0.59% 113,769 $ 43.65M Nov 17, 2026
FLCC 0.56% 2,043 $ 739.852K Aug 31, 2026
GINX 0.53% 1,559 $ 564.576K Aug 31, 2026
FELV 0.52% 42,165 $ 16.747M Jun 30, 2026
AFGR 0.52% 1,108 $ 424.552K Nov 16, 2026
LCTU 0.51% 15,036 $ 5.761M Nov 16, 2026
TVAL 0.47% 13,896 $ 5.325M Nov 17, 2026
ENDW 0.46% 1,989 $ 720.296K Aug 31, 2026
XMAG 0.46% 2,403 $ 983.524K Nov 13, 2026
FELC 0.45% 88,711 $ 35.233M Jun 30, 2026
CGDG 0.42% 66,301 $ 25.405M Nov 16, 2026
VFMO 0.41% 21,714 $ 7.864M Aug 31, 2026
TRUT 0.39% 2,514 $ 997.329K Sep 30, 2026
SELV 0.39% 2,410 $ 957.18K Jun 30, 2026
STOX 0.39% 2,382 $ 862.617K Aug 31, 2026
JHDV 0.37% 113 $ 44.88K Jun 30, 2026
AFLG 0.36% 8,661 $ 3.319M Nov 16, 2026
SFTY 0.36% 7,838 $ 2.838M Aug 31, 2026
IQSZ 0.35% 1,658 $ 609.166K Jul 31, 2026
AAUS 0.33% 4,428 $ 1.7M Nov 18, 2026
FBCV 0.32% 1,553 $ 570.588K Jul 31, 2026
DFVX 0.32% 4,430 $ 1.813M Nov 12, 2026
NBCR 0.31% 7,199 $ 2.607M Aug 31, 2026
RGLO 0.30% 2,553 $ 1.014M Jun 30, 2026
ACIO 0.29% 18,404 $ 6.762M Jul 31, 2026
DFUS 0.29% 151,495 $ 62.005M Nov 12, 2026
ADME 0.28% 2,259 $ 829.979K Jul 31, 2026
VOXP 0.27% 42 $ 15.431K Jul 31, 2026
NTSD 0.27% 238 $ 94.526K Jun 30, 2026
APUE 0.26% 17,921 $ 6.49M Aug 31, 2026
NTSX 0.25% 8,706 $ 3.458M Jun 30, 2026