公告本公司董事會通過115年第三季合併財務報告
Bull 0
Bear 0
Routine
9907.TW
|
Ton Yi Industrial Corp. is a packaging materials and beverage production company established in 1969 as a member of the Uni-President Enterprises Group. The company integrates the manufacturing of tinplate base sheets, coating, color printing, and can making to provide metal packaging solutions. Its product portfolio includes cold-rolled steel coils, tinplate, printed tinplate, empty tinplate cans, new-type aluminum bottles and cans, plastic caps, PET preforms, and Tetra Pak products. The company also operates beverage filling plants using aseptic filling technology to offer integrated services from packaging materials to finished product filling. Ton Yi Industrial serves customers in the electronics, electrical, and food and beverage sectors, with production and marketing bases in Taiwan, mainland China, and Vietnam. Summarised from the company's own disclosures, fiscal year ended Oct 2026 |
Industry Packaging & Containers | Homepage tonyi.com.tw |
| Sector Consumer Cyclical | IR page tonyi.com.tw/invest.php | |
|
Tags
metal packaging, tinplate, cold-rolled steel, aluminum cans, pet preforms, beverage filling, aseptic packaging, food packaging, industrial packaging, TMBP, SPCC, NBC, PET, TP
|
Press page — |
Metrics
| Valuation | |
|---|---|
| Market cap | NT$ 21.474B |
| Market cap (USD) | $ 651.761M |
| P/E | 20.61 |
| PEG | — |
| P/BV | 1.01 |
| P/S | 0.51 |
| P/OCF | 6.86 |
| P/FCF | — |
| Dividend yield | — |
| Turnover / mcap | — |
| Returns | |
|---|---|
| ROE | 10.2% |
| ROI | 10.1% |
| ROIC | 10.1% |
| Profit margin | 4.7% |
| Growth | |
|---|---|
| Revenue growing | Yes |
| Profits growing | Yes |
| Revenue up 3y | No |
| Revenue up 5y | No |
| Earnings growth 3y (net profit CAGR) | -1.4% |
| Quality | |
|---|---|
| Profitable | Yes |
| Margin expanding | Yes |
| Buying back stock | No |
| Diluting (TTM) | No |
| Debt/Equity | — |
| Podcast bulls (TTM) | Sign up |
| Podcast bears (TTM) | Sign up |
| Podcast sentiment (TTM) | Sign up |
| Podcast sentiment % (TTM) | Sign up |
| News sentiment (TTM) | 0 |
| Quality score | 37.5% |
| Insiders | |
|---|---|
| Buys, 1w | Sign up |
| Buys, 1m | Sign up |
| Buys, 1y | Sign up |
| Sells, 1w | Sign up |
| Sells, 1m | Sign up |
| Sells, 1y | Sign up |
Sign up to see this company's insider trades
| Figure | FY 2025 | FY 2024 | FY 2023 | FY 2022 | FY 2021 | FY 2020 | FY 2019 | FY 2018 | FY 2017 | FY 2016 | FY 2015 | FY 2014 | FY 2013 | FY 2012 | FY 2011 | FY 2010 |
|---|---|---|---|---|---|---|---|---|---|---|---|---|---|---|---|---|
| Revenue | 45.638B | 44.859B | 35.24B | 43.48B | 41.89B | 29.935B | 32.528B | 35.104B | 32.667B | 32.749B | 36.179B | 36.438B | 33.193B | 27.967B | 26.447B | 26.498B |
| Net profit | 2.152B | 1.533B | 681.165M | 2.246B | 1.852B | 921.26M | 536.384M | 1.486B | 600.104M | 1.069B | 590.018M | 775.96M | 1.256B | 271.872M | 984.446M | 2.159B |
| Figure | FY 2025 | FY 2024 | FY 2023 | FY 2022 | FY 2021 | FY 2020 | FY 2019 | FY 2018 | FY 2017 | FY 2016 | FY 2015 | FY 2014 | FY 2013 | FY 2012 | FY 2011 | FY 2010 |
|---|---|---|---|---|---|---|---|---|---|---|---|---|---|---|---|---|
| Share price | 17.8 | 15.3 | 16.15 | 17.05 | 14.55 | 11.85 | — | — | — | — | — | — | — | — | — | — |
| Price performance 12m | 0.16 | -0.05 | -0.05 | 0.17 | 0.23 | — | — | — | — | — | — | — | — | — | — | — |
Sign up to see institutional holdings
Sign UpPodcast Mentions
Sign up to see podcast mentions and sentiment
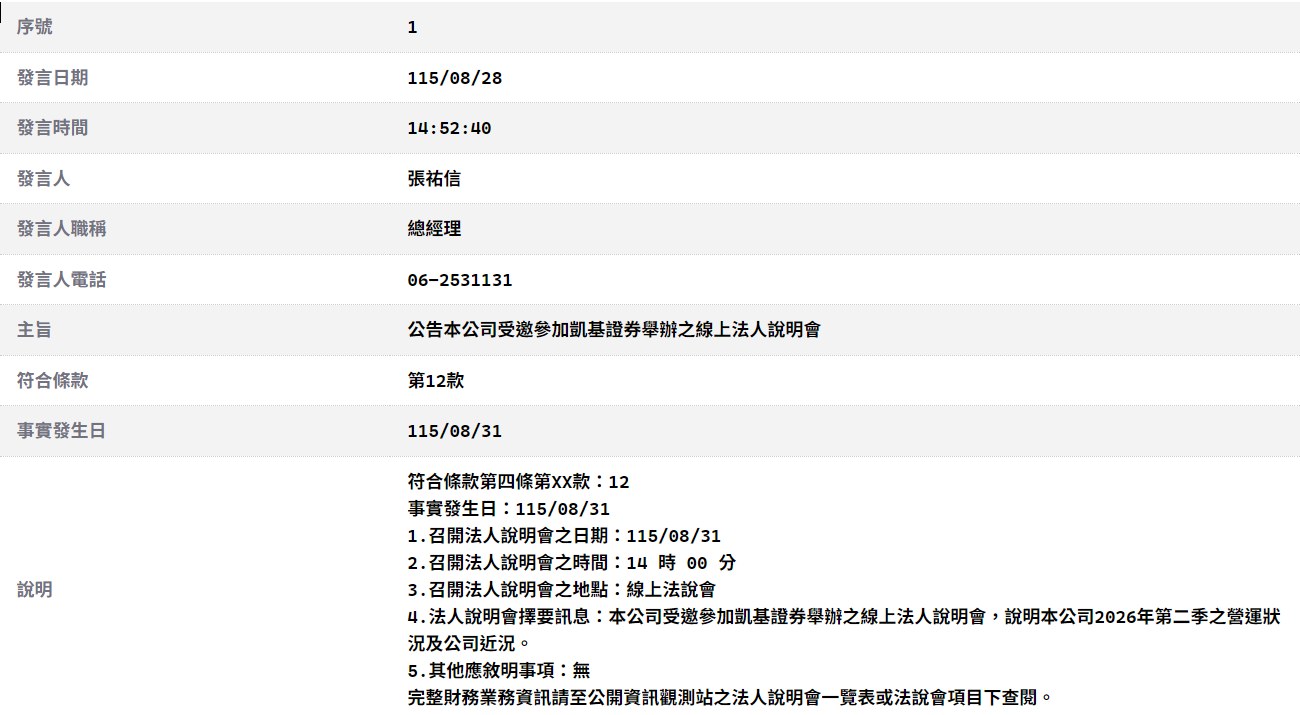
Sign UpMaterial information published on MOPS, newest first, subjects as filed in Chinese, guarantee and loan balance notices and routine equipment purchases included. The link opens the company's material information on MOPS. Press releases from the company's own website, newest first.
 統一實業股份有限公司


Prompts
Click prompts to add them under the company line, click again to take one out, then copy the result into your AI chat. Shared by Asian Century Stocks and Uncovered Thai Stocks. Thank you.
Ton Yi Industrial Corp. (ticker 9907.TW), listed in Taiwan.
Copied
ETFs Holding Ton Yi Industrial Corp.
Exchange-traded funds whose newest published daily portfolio holds one of the company's listings, largest weight first.
| ETF | Weight in ETF | Shares | Market value | As of |
|---|---|---|---|---|
| AVES | 0.02% | 543,000 | $ 227.295K | Nov 16, 2026 |
| AVEE | 0.02% | 75,000 | $ 31.394K | Nov 16, 2026 |
| AVXC | 0.01% | 57,000 | $ 23.86K | Nov 16, 2026 |
| DFSE | 0.01% | 95,000 | $ 40.196K | Nov 12, 2026 |
| DFEV | 0.01% | 352,000 | $ 148.938K | Nov 12, 2026 |
| DFEM | 0.01% | 1,296,000 | $ 548.361K | Nov 12, 2026 |
| DEXC | 0.00% | 26,000 | $ 11.001K | Nov 12, 2026 |
| DFAE | 0.00% | 612,000 | $ 258.948K | Nov 12, 2026 |
| DFAX | 0.00% | 550,515 | $ 232.933K | Nov 12, 2026 |
| AVEM | 0.00% | 2,122,000 | $ 888.252K | Nov 16, 2026 |
| AVSE | 0.00% | 17,000 | $ 7,116.06 | Nov 16, 2026 |