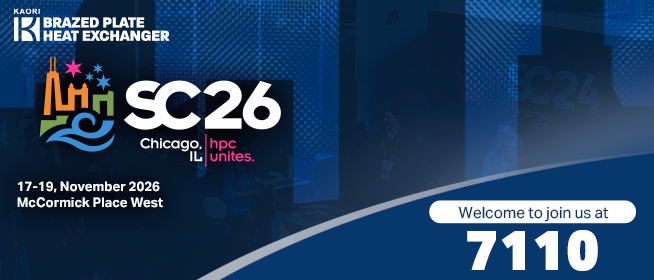
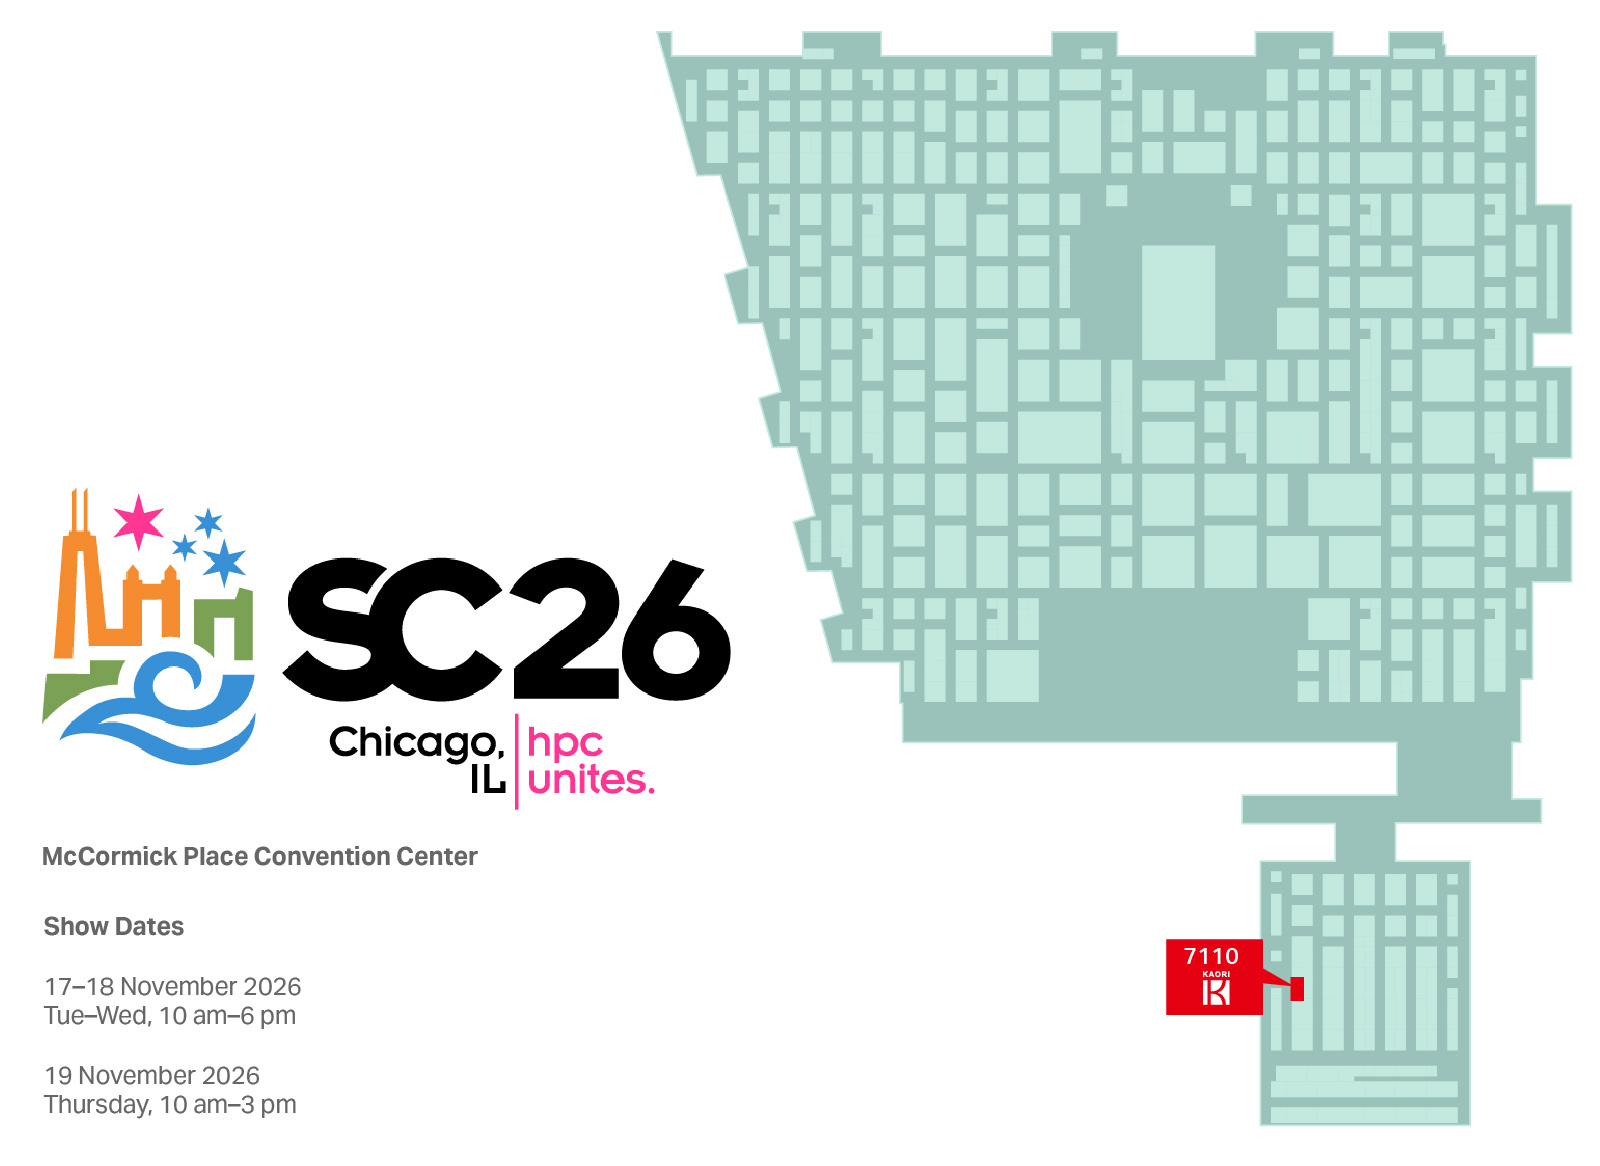
公告本公司受邀參加黑石財經「第三屆戰略臺灣投資論壇」法人說明會
Bull 0
Bear 0
Routine
8996.TW
|
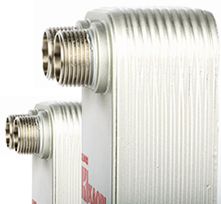
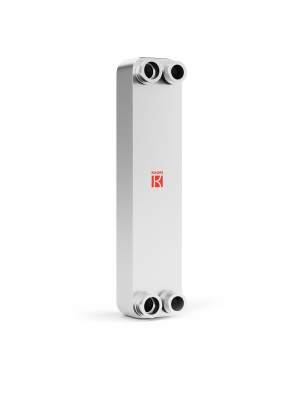
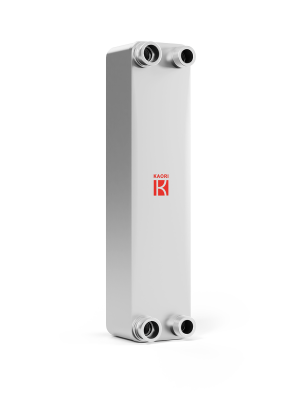
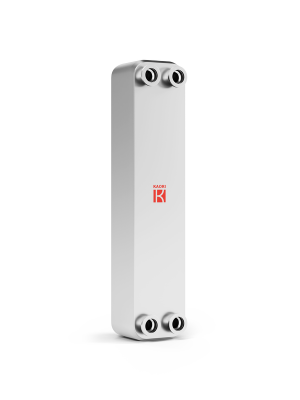
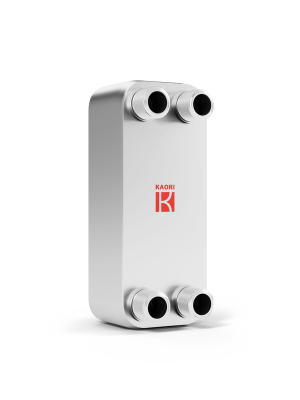
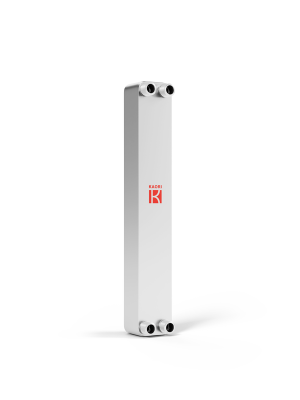
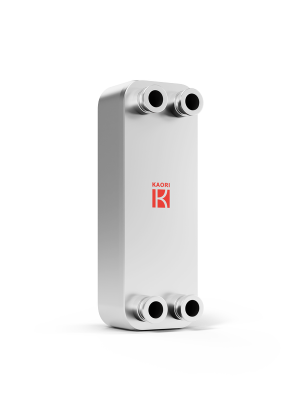
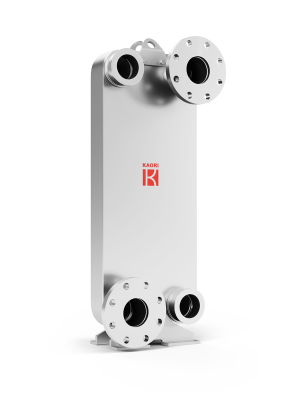
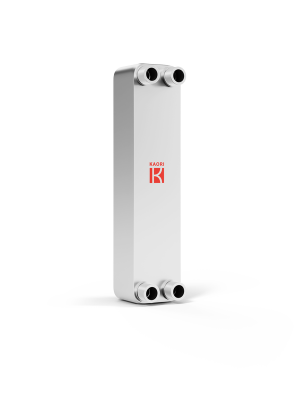
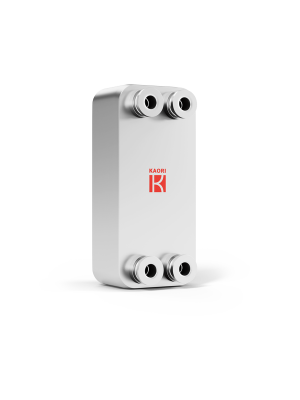
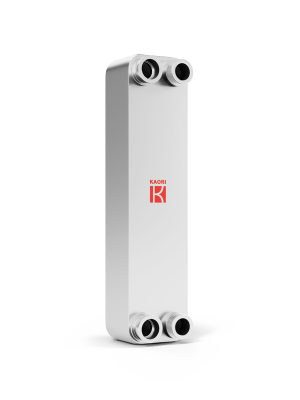
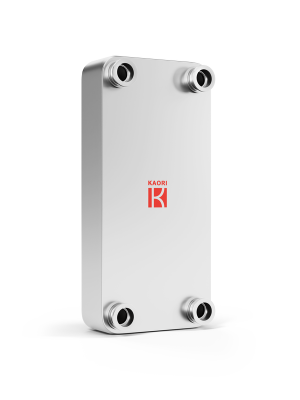
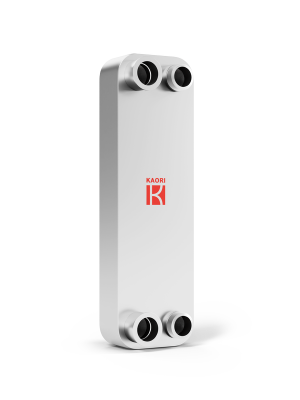
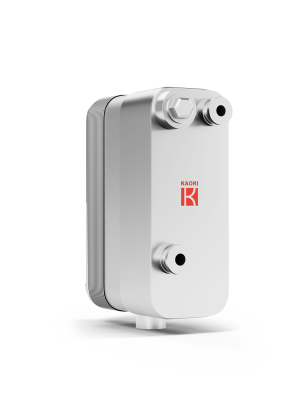
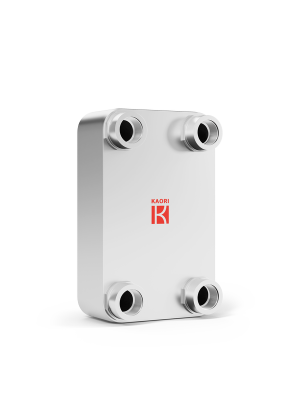
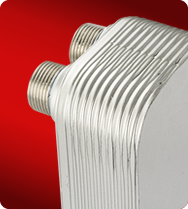
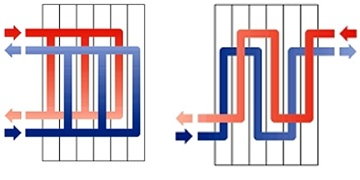
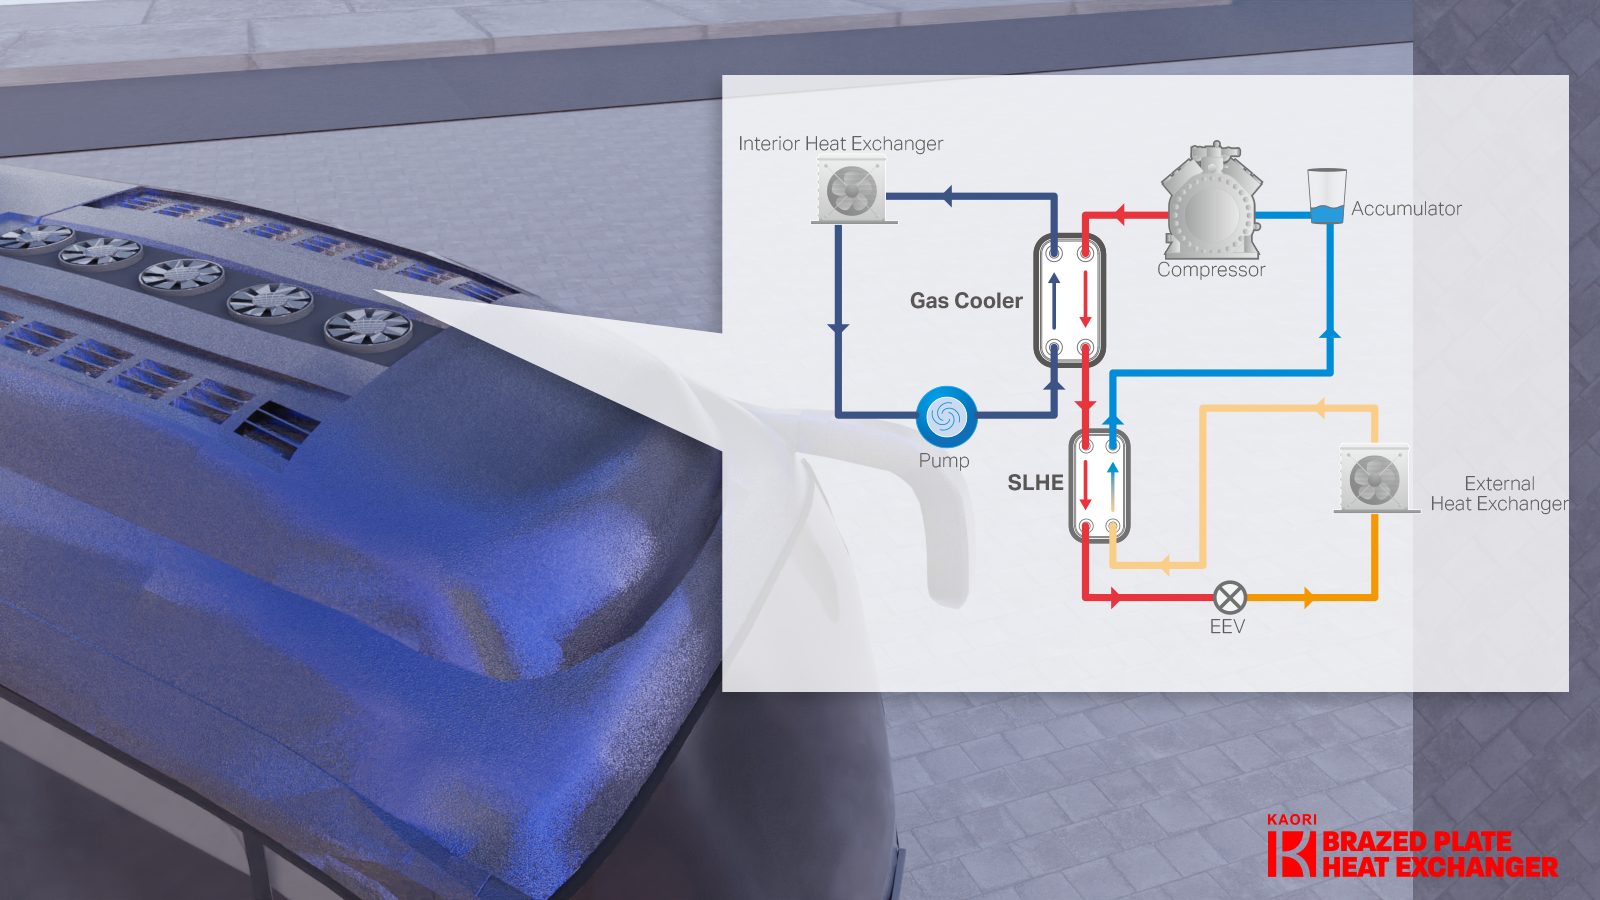
Kaori Heat Treatment Co., Ltd. is a manufacturer of industrial key components and thermal management systems, established in 1970. The company specializes in heat treatment, brass welding, and vacuum brazing technologies to produce brazed plate heat exchangers and Sendzimir mill rollers. Its product portfolio includes gasket plate heat exchangers and system products for energy saving and hydrogen energy applications. Kaori serves the heating and cooling industry, providing customizable heat transfer solutions for clients globally. The company collaborates with international partners to develop technologies for green energy and AI infrastructure thermal management. Summarised from the company's own disclosures, fiscal year ended Oct 2026 |
Industry Specialty Industrial Machinery | Homepage kaori.com.tw |
| Sector Industrials | IR page kaori.com.tw/en/modules/investors | |
|
Tags
heat exchangers, brazing, welding, thermal management, hydrogen energy, industrial components, energy efficiency, Brazed Plate Heat Exchanger, Sendzimir mill roller, Gasket Plate Heat Exchanger
|
Press page kaori.com.tw/en/modules/news |
Metrics
| Valuation | |
|---|---|
| Market cap | NT$ 95.459B |
| Market cap (USD) | $ 2.897B |
| P/E | 57.46 |
| PEG | 1.43 |
| P/BV | 16.93 |
| P/S | 8.11 |
| P/OCF | 91.67 |
| P/FCF | — |
| Dividend yield | — |
| Turnover / mcap | — |
| Returns | |
|---|---|
| ROE | 21.8% |
| ROI | 19.9% |
| ROIC | 19.3% |
| Profit margin | 12.6% |
| Growth | |
|---|---|
| Revenue growing | Yes |
| Profits growing | Yes |
| Revenue up 3y | No |
| Revenue up 5y | No |
| Earnings growth 3y (net profit CAGR) | 40.2% |
| Quality | |
|---|---|
| Profitable | Yes |
| Margin expanding | No |
| Buying back stock | No |
| Diluting (TTM) | Yes |
| Debt/Equity | — |
| Podcast bulls (TTM) | Sign up |
| Podcast bears (TTM) | Sign up |
| Podcast sentiment (TTM) | Sign up |
| Podcast sentiment % (TTM) | Sign up |
| News sentiment (TTM) | 8 |
| Quality score | 0% |
| Insiders | |
|---|---|
| Buys, 1w | Sign up |
| Buys, 1m | Sign up |
| Buys, 1y | Sign up |
| Sells, 1w | Sign up |
| Sells, 1m | Sign up |
| Sells, 1y | Sign up |
Sign up to see this company's insider trades
| Figure | FY 2025 | FY 2024 | FY 2023 | FY 2022 | FY 2021 | FY 2020 | FY 2019 | FY 2018 | FY 2017 | FY 2016 | FY 2015 | FY 2014 | FY 2013 | FY 2012 | FY 2011 | FY 2010 |
|---|---|---|---|---|---|---|---|---|---|---|---|---|---|---|---|---|
| Revenue | 6.581B | 4.003B | 4.326B | 2.844B | 2.231B | 2.076B | 2.083B | 1.932B | 1.779B | 2.707B | 2.178B | 2.335B | 2.324B | 1.831B | 1.583B | 1.235B |
| Net profit | 829.546M | 593.044M | 576.526M | 301.02M | 149.156M | 112.524M | 158.138M | 229.734M | 56.138M | 311.43M | 185.371M | 198.87M | 155.442M | 138.93M | 110.77M | 41.704M |
| Figure | FY 2025 | FY 2024 | FY 2023 | FY 2022 | FY 2021 | FY 2020 | FY 2019 | FY 2018 | FY 2017 | FY 2016 | FY 2015 | FY 2014 | FY 2013 | FY 2012 | FY 2011 | FY 2010 |
|---|---|---|---|---|---|---|---|---|---|---|---|---|---|---|---|---|
| Share price | 580 | 317 | 223 | 188 | 64.4 | 55 | — | — | — | — | — | — | — | — | — | — |
| Price performance 12m | 0.83 | 0.42 | 0.19 | 1.92 | 0.17 | — | — | — | — | — | — | — | — | — | — | — |
Sign up to see institutional holdings
Sign UpPodcast Mentions
Sign up to see podcast mentions and sentiment
Sign UpMaterial information published on MOPS, newest first, subjects as filed in Chinese, guarantee and loan balance notices and routine equipment purchases included. The link opens the company's material information on MOPS. Press releases from the company's own website, newest first.
代重要子公司-高力熱能科技股份有限公司公告 會計主管異動
Bull 0
Bear 0
Routine
代重要子公司(高力熱能科技)公告向關係人取得使用權資產相關訊息
Bull 1
Bear 0
Order/contract










Prompts
Click prompts to add them under the company line, click again to take one out, then copy the result into your AI chat. Shared by Asian Century Stocks and Uncovered Thai Stocks. Thank you.
Kaori Heat Treatment Co., Ltd. (ticker 8996.TW), listed in Taiwan.
Copied
ETFs Holding Kaori Heat Treatment Co., Ltd.
Exchange-traded funds whose newest published daily portfolio holds one of the company's listings, largest weight first.
| ETF | Weight in ETF | Shares | Market value | As of |
|---|---|---|---|---|
| MCHS | 2.34% | 12,000 | $ 583.868K | Jun 30, 2026 |
| MINV | 2.07% | 79,000 | $ 3.844M | Jun 30, 2026 |
| AVEE | 0.26% | 9,000 | $ 347.695K | Nov 16, 2026 |
| DEXC | 0.03% | 2,000 | $ 86.444K | Nov 12, 2026 |
| DFSE | 0.03% | 4,000 | $ 172.887K | Nov 12, 2026 |
| DFAE | 0.02% | 49,000 | $ 2.118M | Nov 12, 2026 |
| AVES | 0.02% | 7,000 | $ 270.43K | Nov 16, 2026 |
| AVSE | 0.02% | 1,000 | $ 38.633K | Nov 16, 2026 |
| DFEM | 0.02% | 41,000 | $ 1.772M | Nov 12, 2026 |
| AVEM | 0.01% | 53,000 | $ 2.048M | Nov 16, 2026 |
| DFAX | 0.01% | 24,147 | $ 1.044M | Nov 12, 2026 |