公告本公司向關係人勤眾興業股份有限公司取得不動產使用權資產
Bull 0
Bear 0
Routine
8210.TW
|
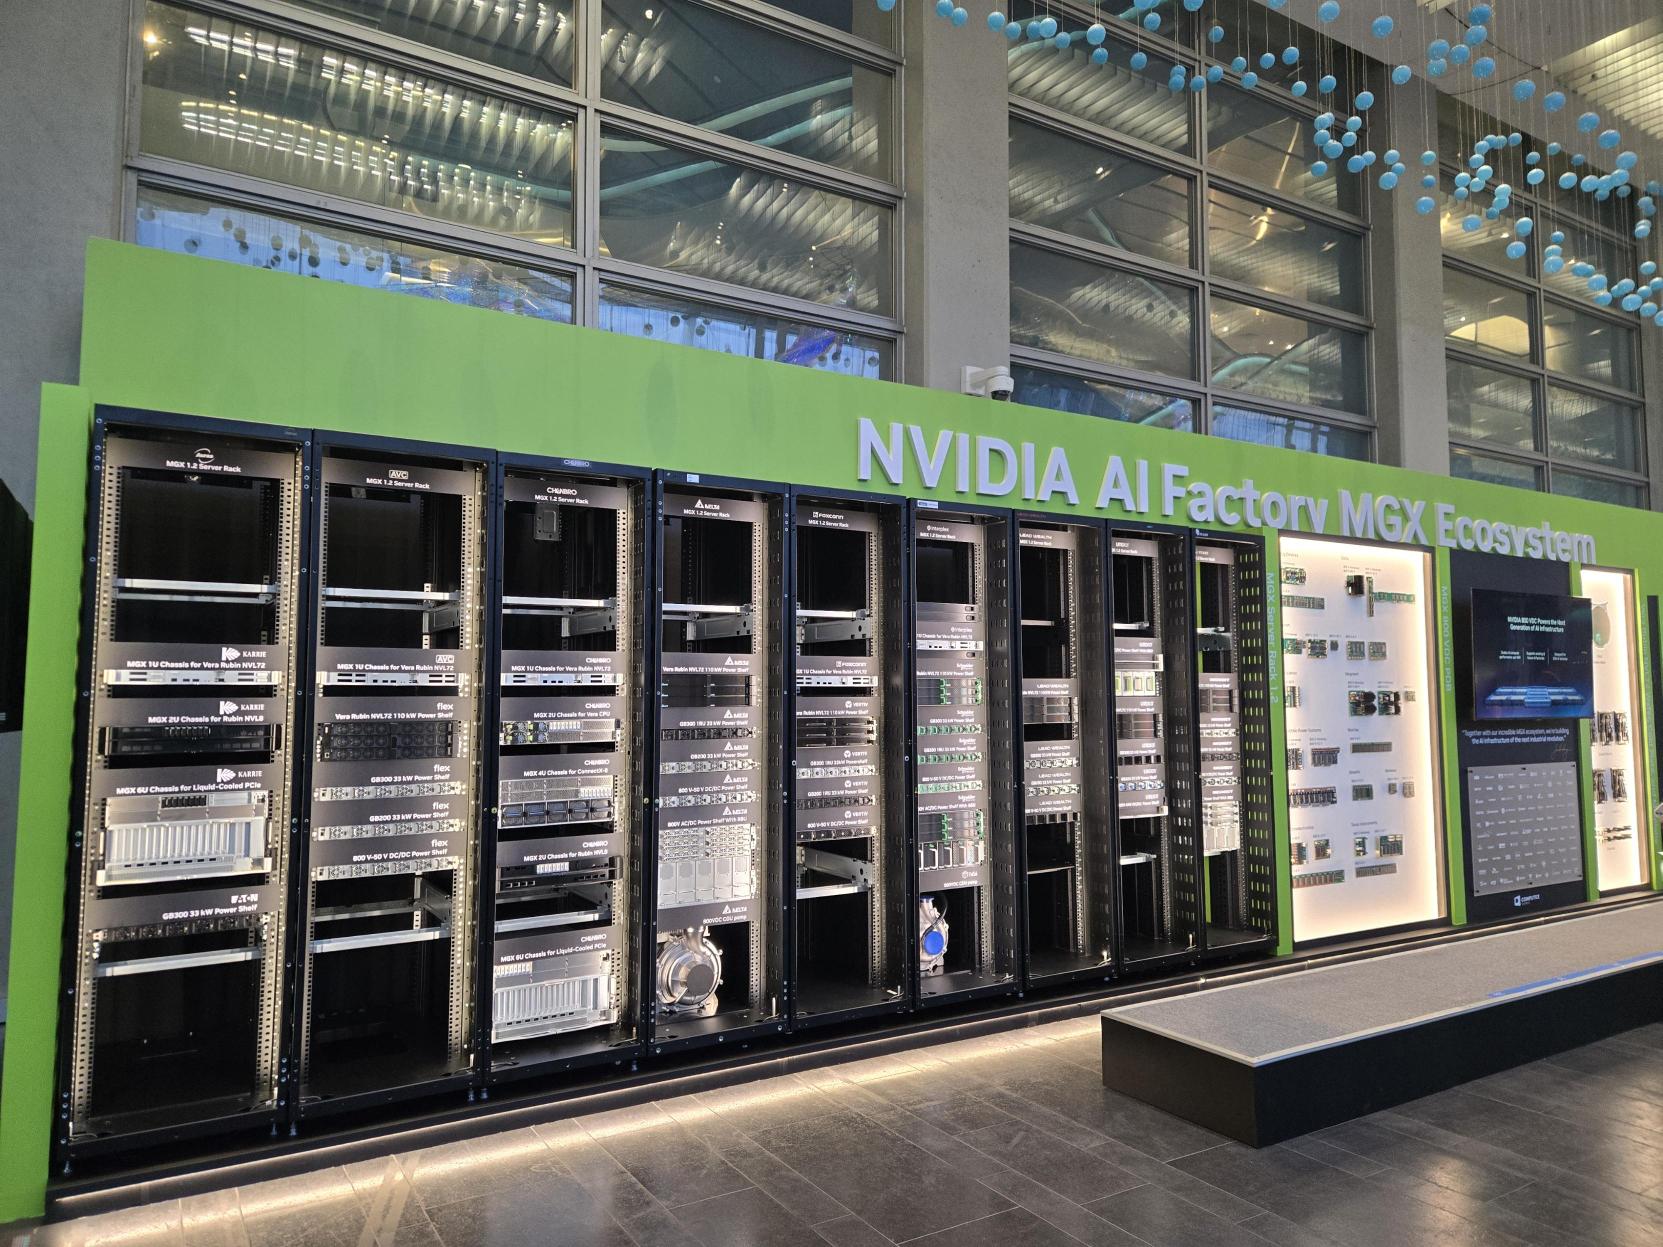
Chenbro Micom Co., Ltd., founded in 1983, designs and manufactures integrated enclosure solutions for rackmount and tower servers, personal computer chassis, and edge computing hardware. The company provides mechanical engineering, thermal optimization, and volume manufacturing services for the cloud, 5G, AI, and AIoT industries. Chenbro operates through three service models: Off-The-Shelf (OTS), Joint Design Manufacturing (JDM/ODM), and OEM Plus, offering products ranging from Level 3 to Level 6 server solutions. It serves tier-1 cloud service providers and data center operators with high-density storage and AI server chassis, including support for the NVIDIA MGX modular architecture and rack-level deployments. Notable products include the RM252 MIO Series edge computing chassis and the SR215 tower server chassis. The company collaborates with NVIDIA on AI infrastructure integration and participates in the OCP ecosystem. Summarised from the company's own disclosures, fiscal year ended Oct 2026 |
Industry Computer Hardware | Homepage chenbro.com |
| Sector Technology | IR page chenbro.com/en-US/investor-conference | |
|
Tags
server chassis, edge computing, ai infrastructure, rackmount servers, tower servers, thermal management, mechanical engineering, cloud computing, 5g, aiot, RM252 MIO Series, SR215, NVIDIA MGX, NVIDIA Vera Rubin NVL72, OCP
|
Press page — |
Metrics
| Valuation | |
|---|---|
| Market cap | NT$ 59.169B |
| Market cap (USD) | $ 1.796B |
| P/E | 12.23 |
| PEG | 0.23 |
| P/BV | 4.37 |
| P/S | 2.04 |
| P/OCF | 21.93 |
| P/FCF | — |
| Dividend yield | — |
| Turnover / mcap | — |
| Returns | |
|---|---|
| ROE | 39.4% |
| ROI | 32.7% |
| ROIC | 33.2% |
| Profit margin | 16.2% |
| Growth | |
|---|---|
| Revenue growing | Yes |
| Profits growing | Yes |
| Revenue up 3y | Yes |
| Revenue up 5y | Yes |
| Earnings growth 3y (net profit CAGR) | 52.7% |
| Quality | |
|---|---|
| Profitable | Yes |
| Margin expanding | Yes |
| Buying back stock | No |
| Diluting (TTM) | Yes |
| Debt/Equity | — |
| Podcast bulls (TTM) | Sign up |
| Podcast bears (TTM) | Sign up |
| Podcast sentiment (TTM) | Sign up |
| Podcast sentiment % (TTM) | Sign up |
| News sentiment (TTM) | 0 |
| Quality score | 43.8% |
| Insiders | |
|---|---|
| Buys, 1w | Sign up |
| Buys, 1m | Sign up |
| Buys, 1y | Sign up |
| Sells, 1w | Sign up |
| Sells, 1m | Sign up |
| Sells, 1y | Sign up |
Sign up to see this company's insider trades
| Figure | FY 2025 | FY 2024 | FY 2023 | FY 2022 | FY 2021 | FY 2020 | FY 2019 | FY 2018 | FY 2017 | FY 2016 | FY 2015 | FY 2014 | FY 2013 | FY 2012 | FY 2011 | FY 2010 |
|---|---|---|---|---|---|---|---|---|---|---|---|---|---|---|---|---|
| Revenue | 22.001B | 14.517B | 11.247B | 10.558B | 9.423B | 7.545B | 6.835B | 6.521B | 5.514B | 5.21B | 4.439B | 4.473B | 3.724B | 3.965B | 3.946B | 4.116B |
| Net profit | 3.558B | 1.934B | 1.085B | 998.685M | 672.901M | 976.857M | 911.951M | 642.35M | 455.442M | 600.188M | 504.834M | 541.272M | 341.832M | 481.207M | 444.67M | 424.774M |
| Figure | FY 2025 | FY 2024 | FY 2023 | FY 2022 | FY 2021 | FY 2020 | FY 2019 | FY 2018 | FY 2017 | FY 2016 | FY 2015 | FY 2014 | FY 2013 | FY 2012 | FY 2011 | FY 2010 |
|---|---|---|---|---|---|---|---|---|---|---|---|---|---|---|---|---|
| Share price | 1.005K | 266.5 | 271.5 | 72.4 | 78 | 82 | — | — | — | — | — | — | — | — | — | — |
| Price performance 12m | 2.77 | -0.02 | 2.75 | -0.07 | -0.05 | — | — | — | — | — | — | — | — | — | — | — |
Sign up to see institutional holdings
Sign UpPodcast Mentions
Sign up to see podcast mentions and sentiment
Sign UpMaterial information published on MOPS, newest first, subjects as filed in Chinese, guarantee and loan balance notices and routine equipment purchases included. The link opens the company's material information on MOPS. Press releases from the company's own website, newest first.





Prompts
Click prompts to add them under the company line, click again to take one out, then copy the result into your AI chat. Shared by Asian Century Stocks and Uncovered Thai Stocks. Thank you.
Chenbro Micom Co., Ltd. (ticker 8210.TW), listed in Taiwan.
Copied
ETFs Holding Chenbro Micom Co., Ltd.
Exchange-traded funds whose newest published daily portfolio holds one of the company's listings, largest weight first.
| ETF | Weight in ETF | Shares | Market value | As of |
|---|---|---|---|---|
| ASCI | 2.15% | 52,000 | $ 1.681M | Jul 31, 2026 |
| AVES | 0.05% | 47,000 | $ 770.177K | Nov 16, 2026 |
| AVEE | 0.04% | 3,000 | $ 49.16K | Nov 16, 2026 |
| DEXC | 0.02% | 3,000 | $ 54.687K | Nov 12, 2026 |
| AVSE | 0.02% | 3,000 | $ 49.16K | Nov 16, 2026 |
| AVXC | 0.02% | 4,000 | $ 65.547K | Nov 16, 2026 |
| DFSE | 0.02% | 6,000 | $ 109.374K | Nov 12, 2026 |
| DFEM | 0.02% | 88,000 | $ 1.604M | Nov 12, 2026 |
| DFAX | 0.01% | 58,000 | $ 1.057M | Nov 12, 2026 |
| DFAE | 0.01% | 43,000 | $ 783.846K | Nov 12, 2026 |
| DFEV | 0.01% | 10,000 | $ 182.29K | Nov 12, 2026 |
| AVEM | 0.00% | 72,000 | $ 1.18M | Nov 16, 2026 |