公告本公司將於115年12月21日提前贖回第一次海外無擔保 可轉換公司債(ISIN:XS2853493117)
Bull 2
Bear 0
Routine
6669.TW
|
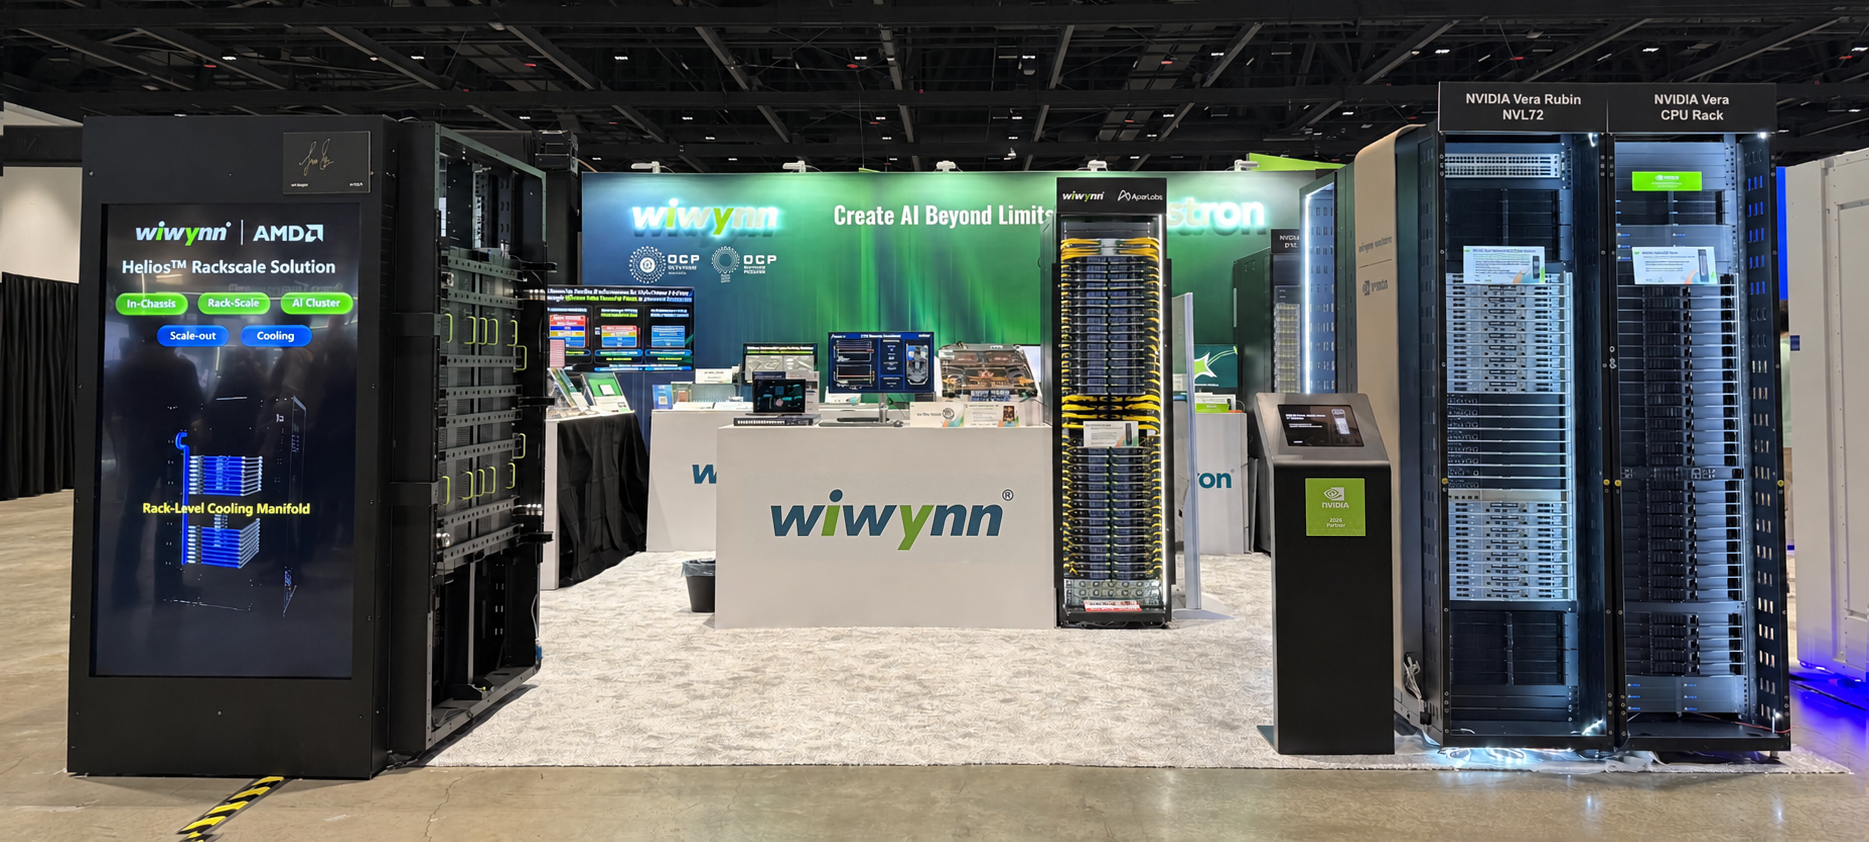
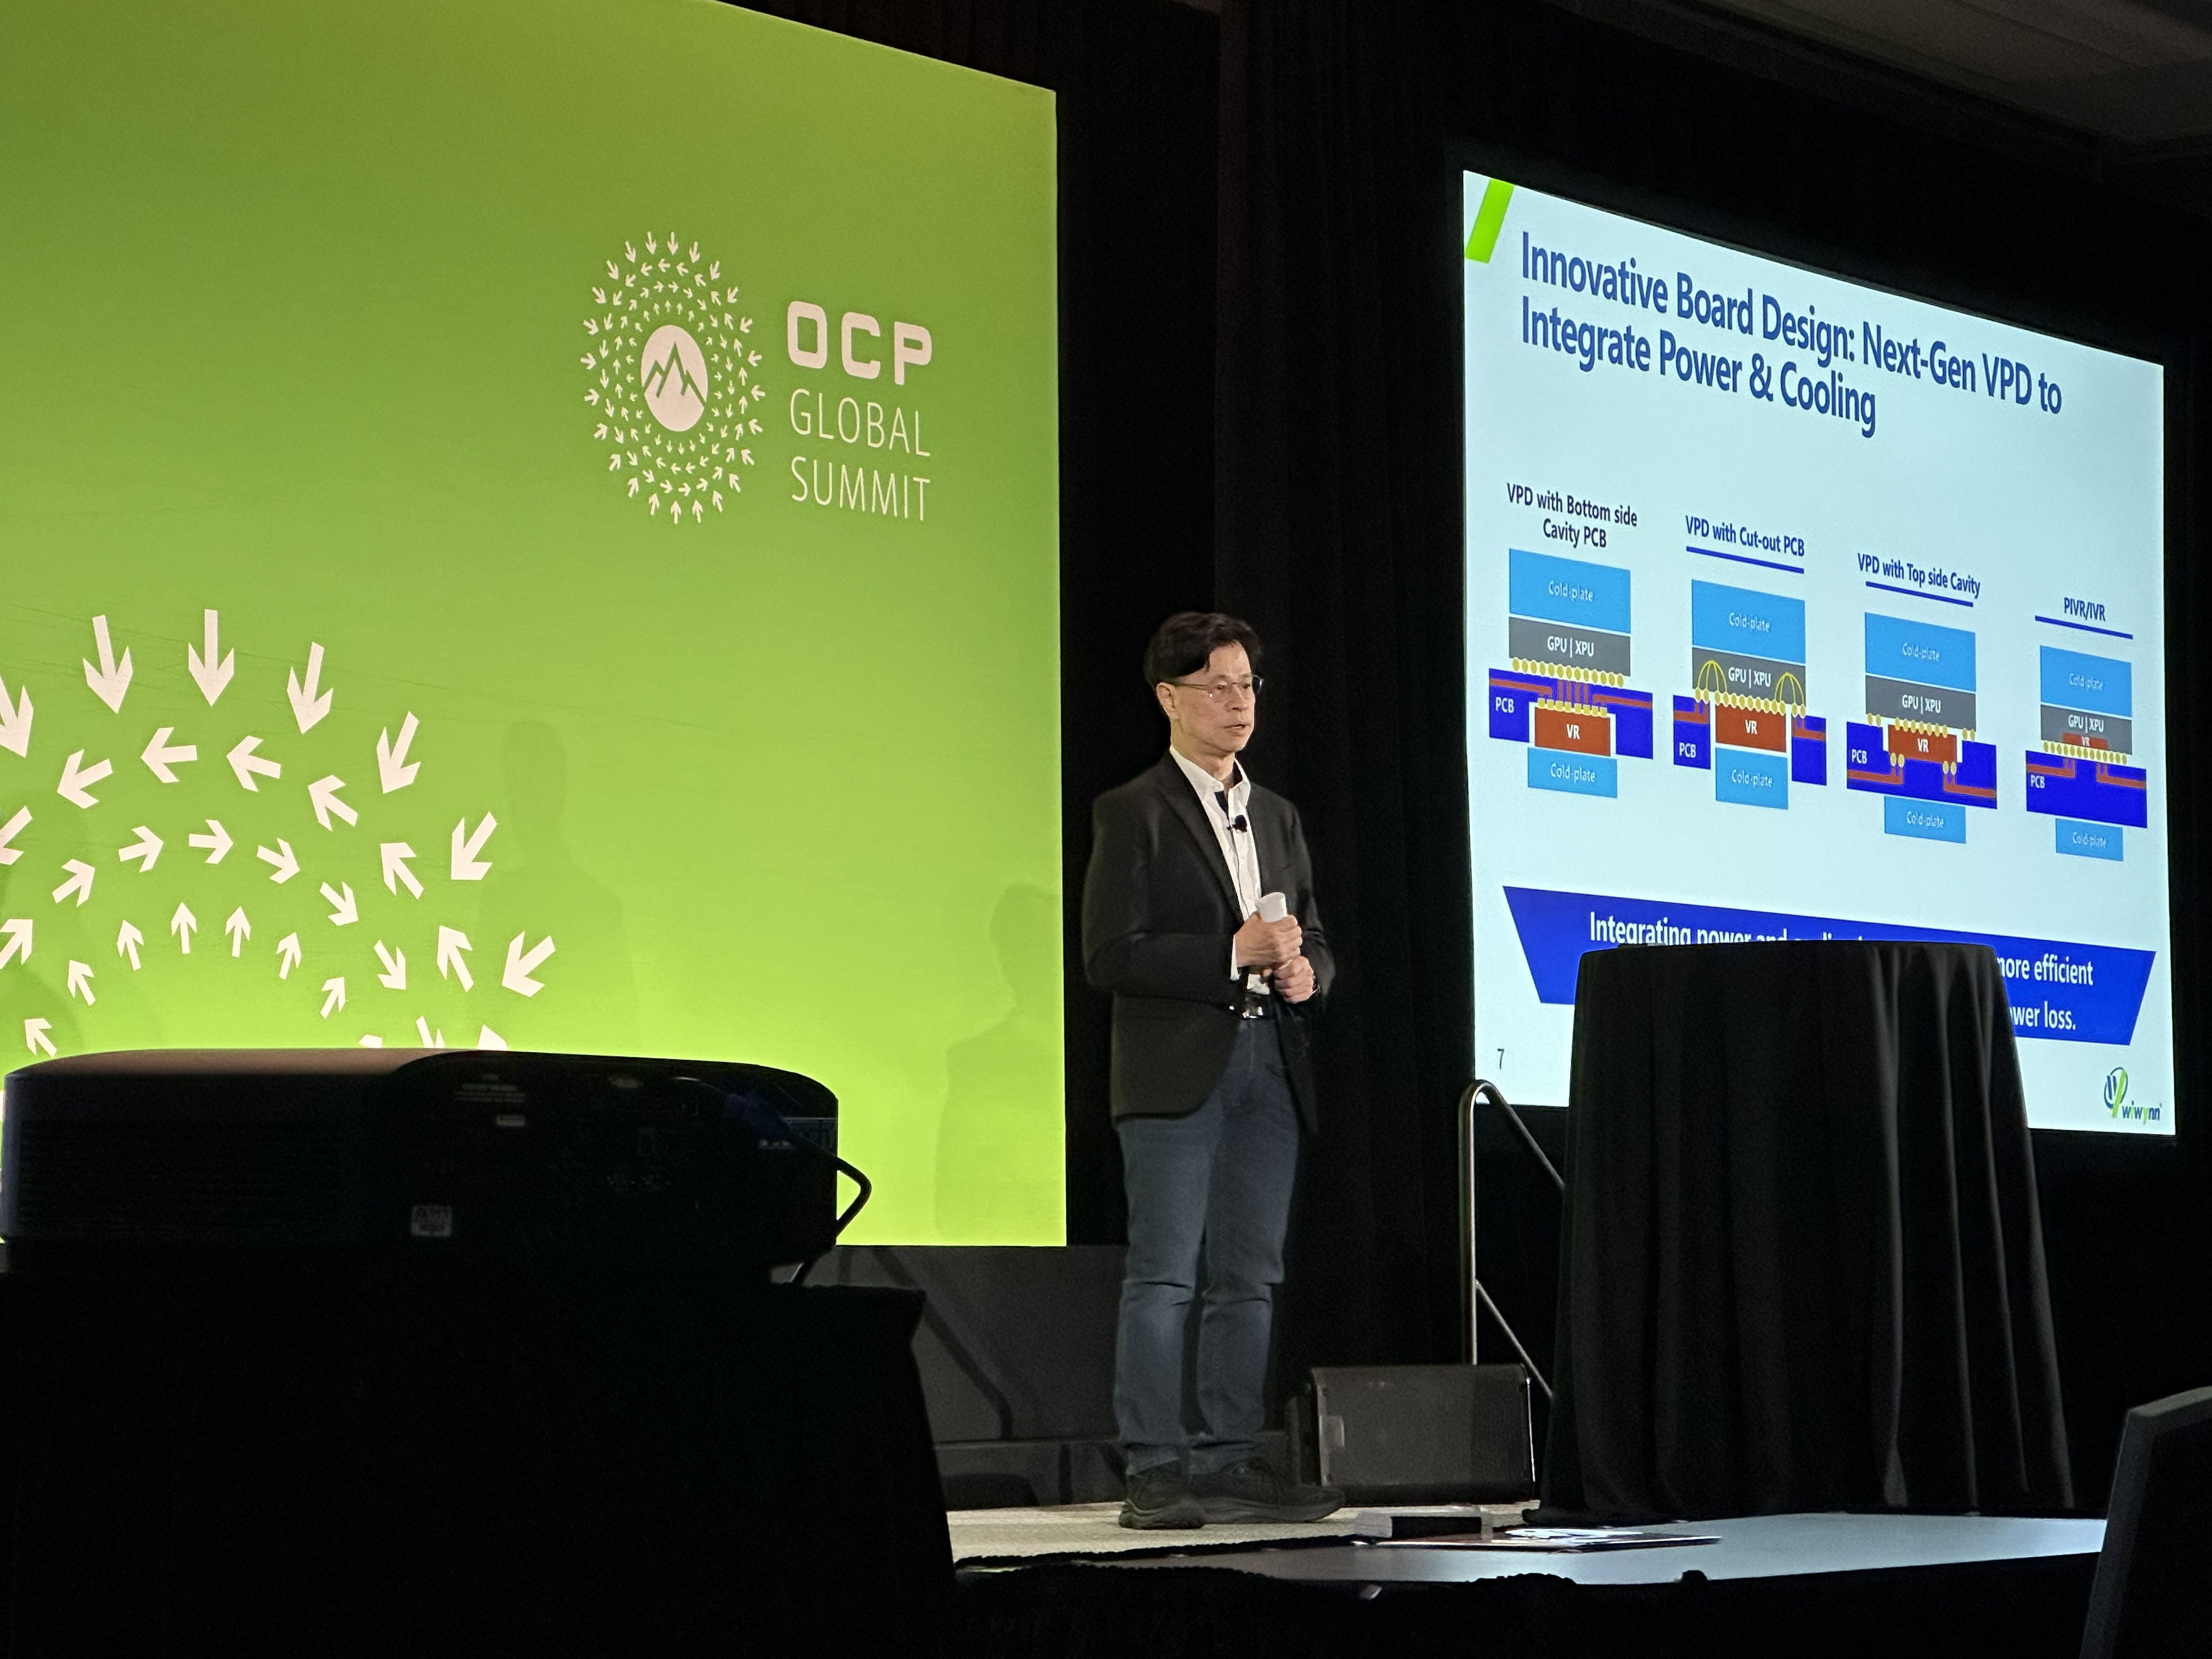
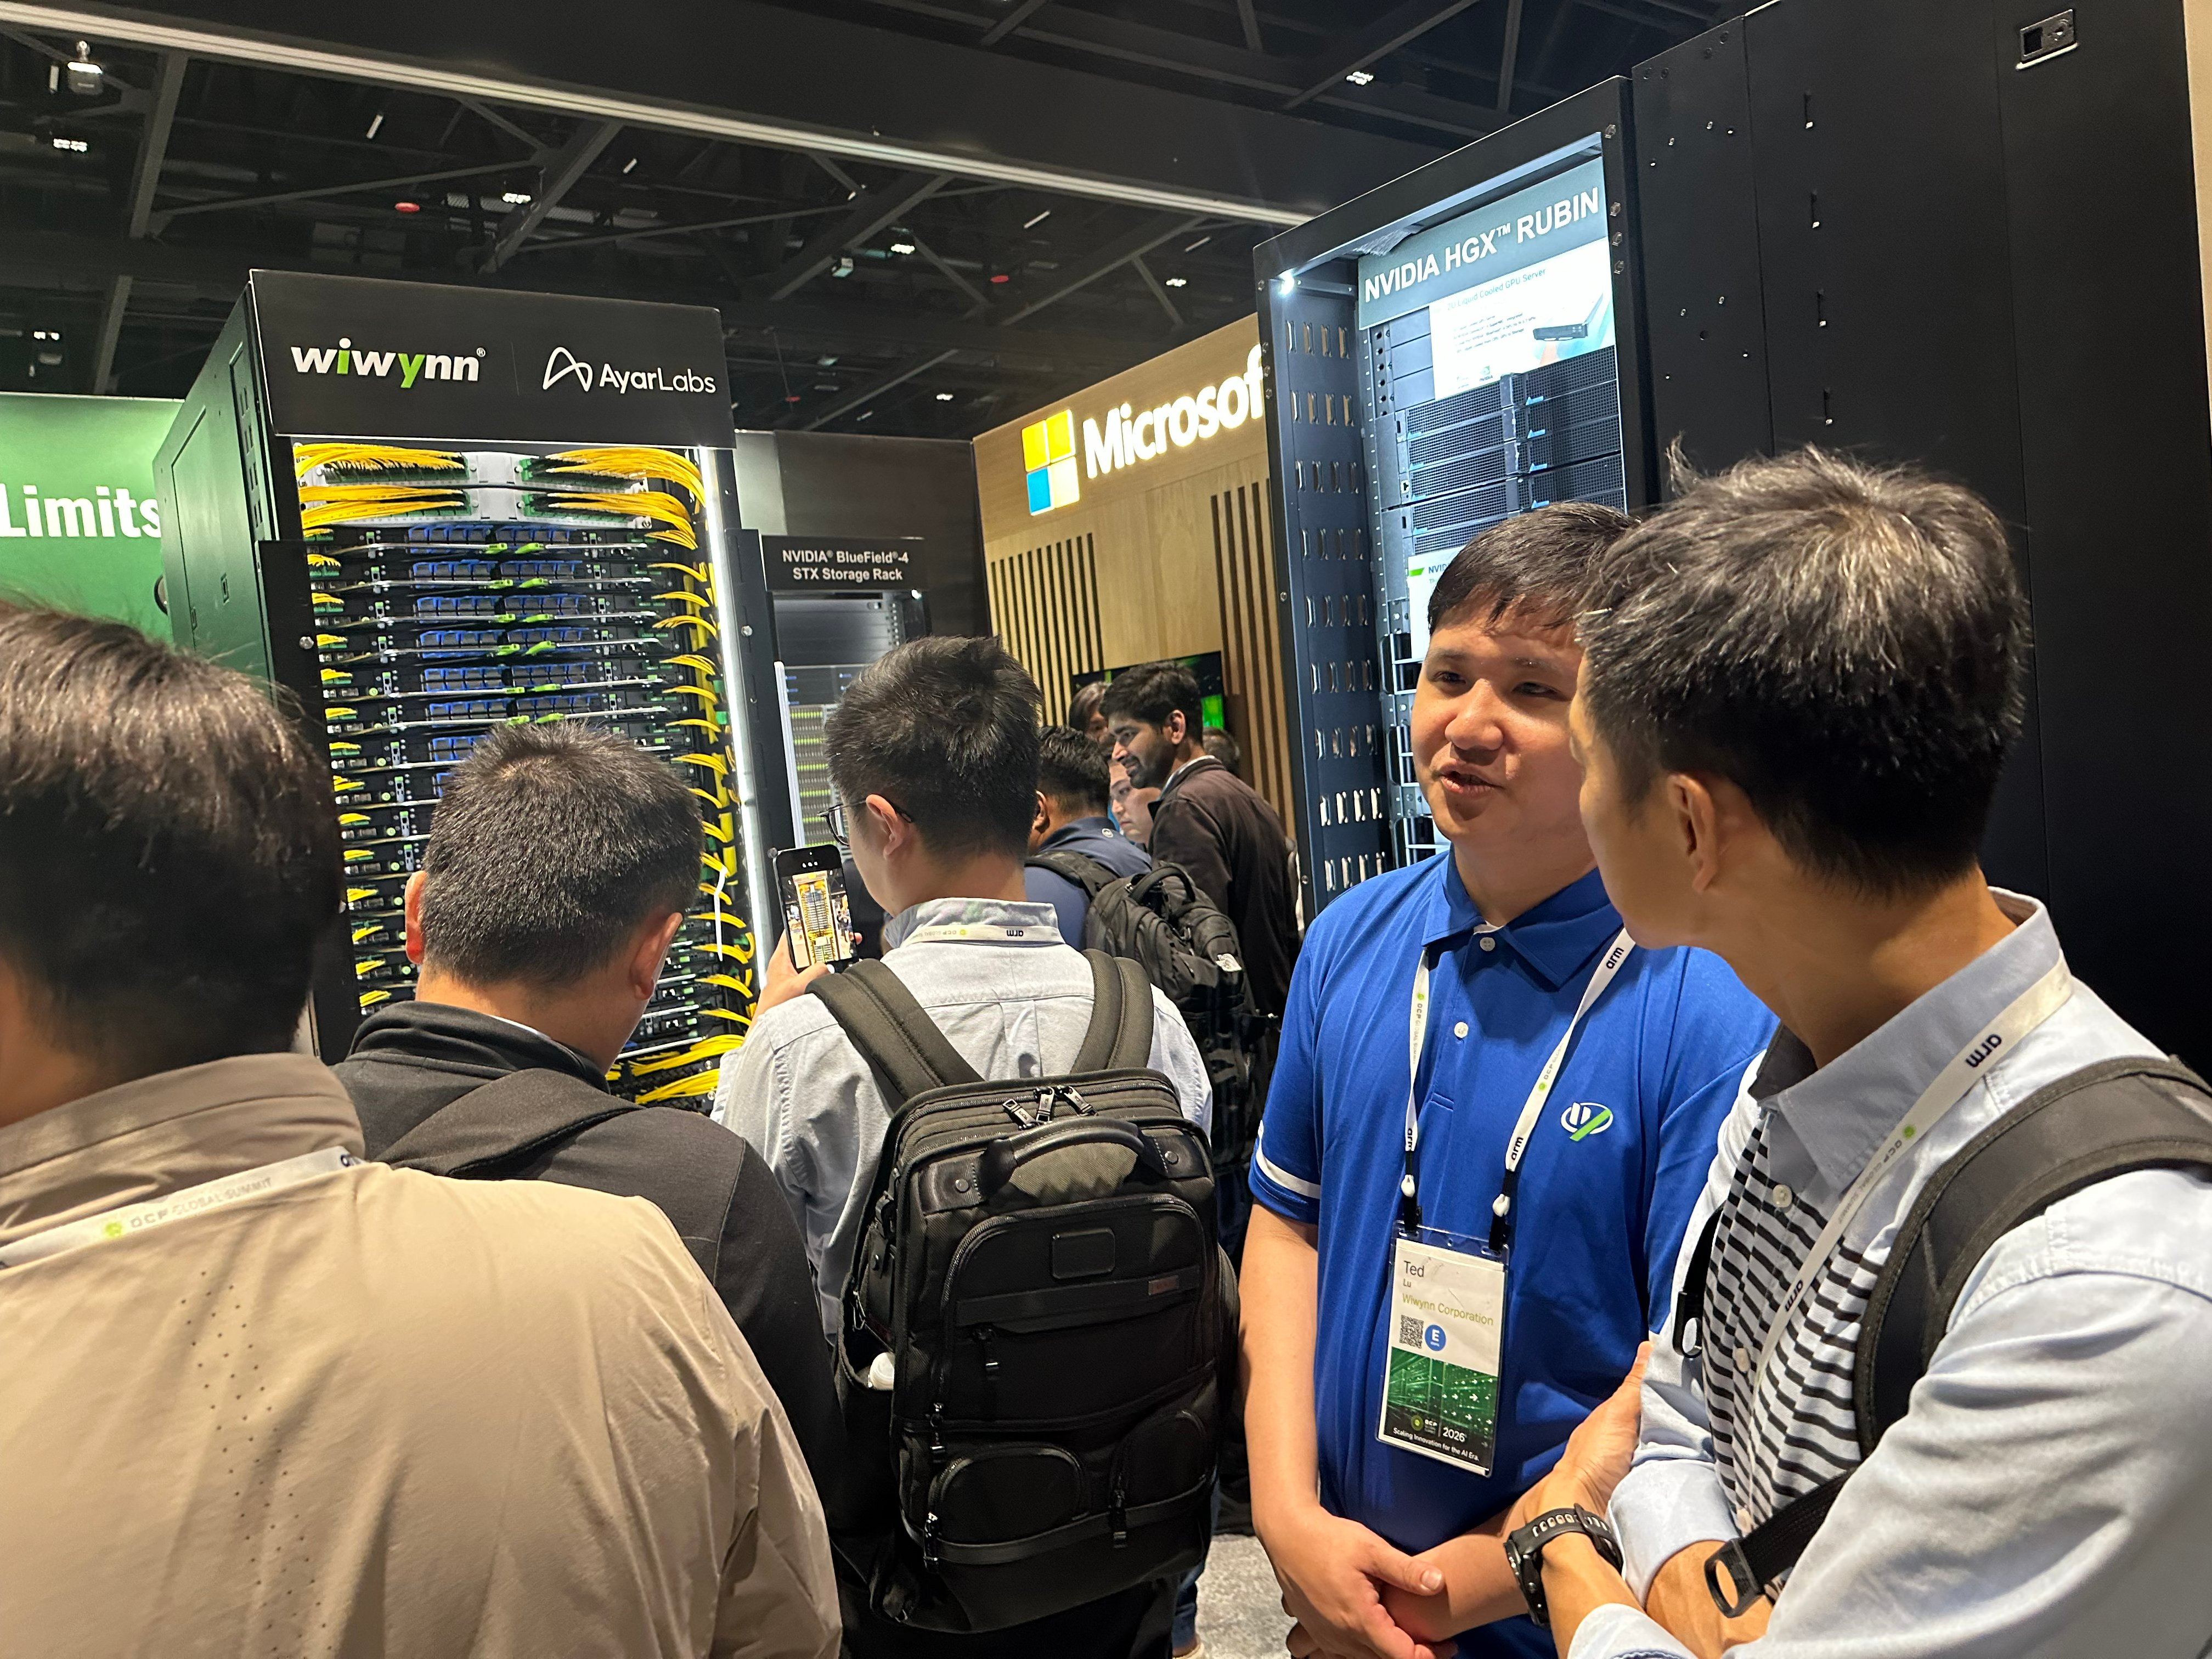
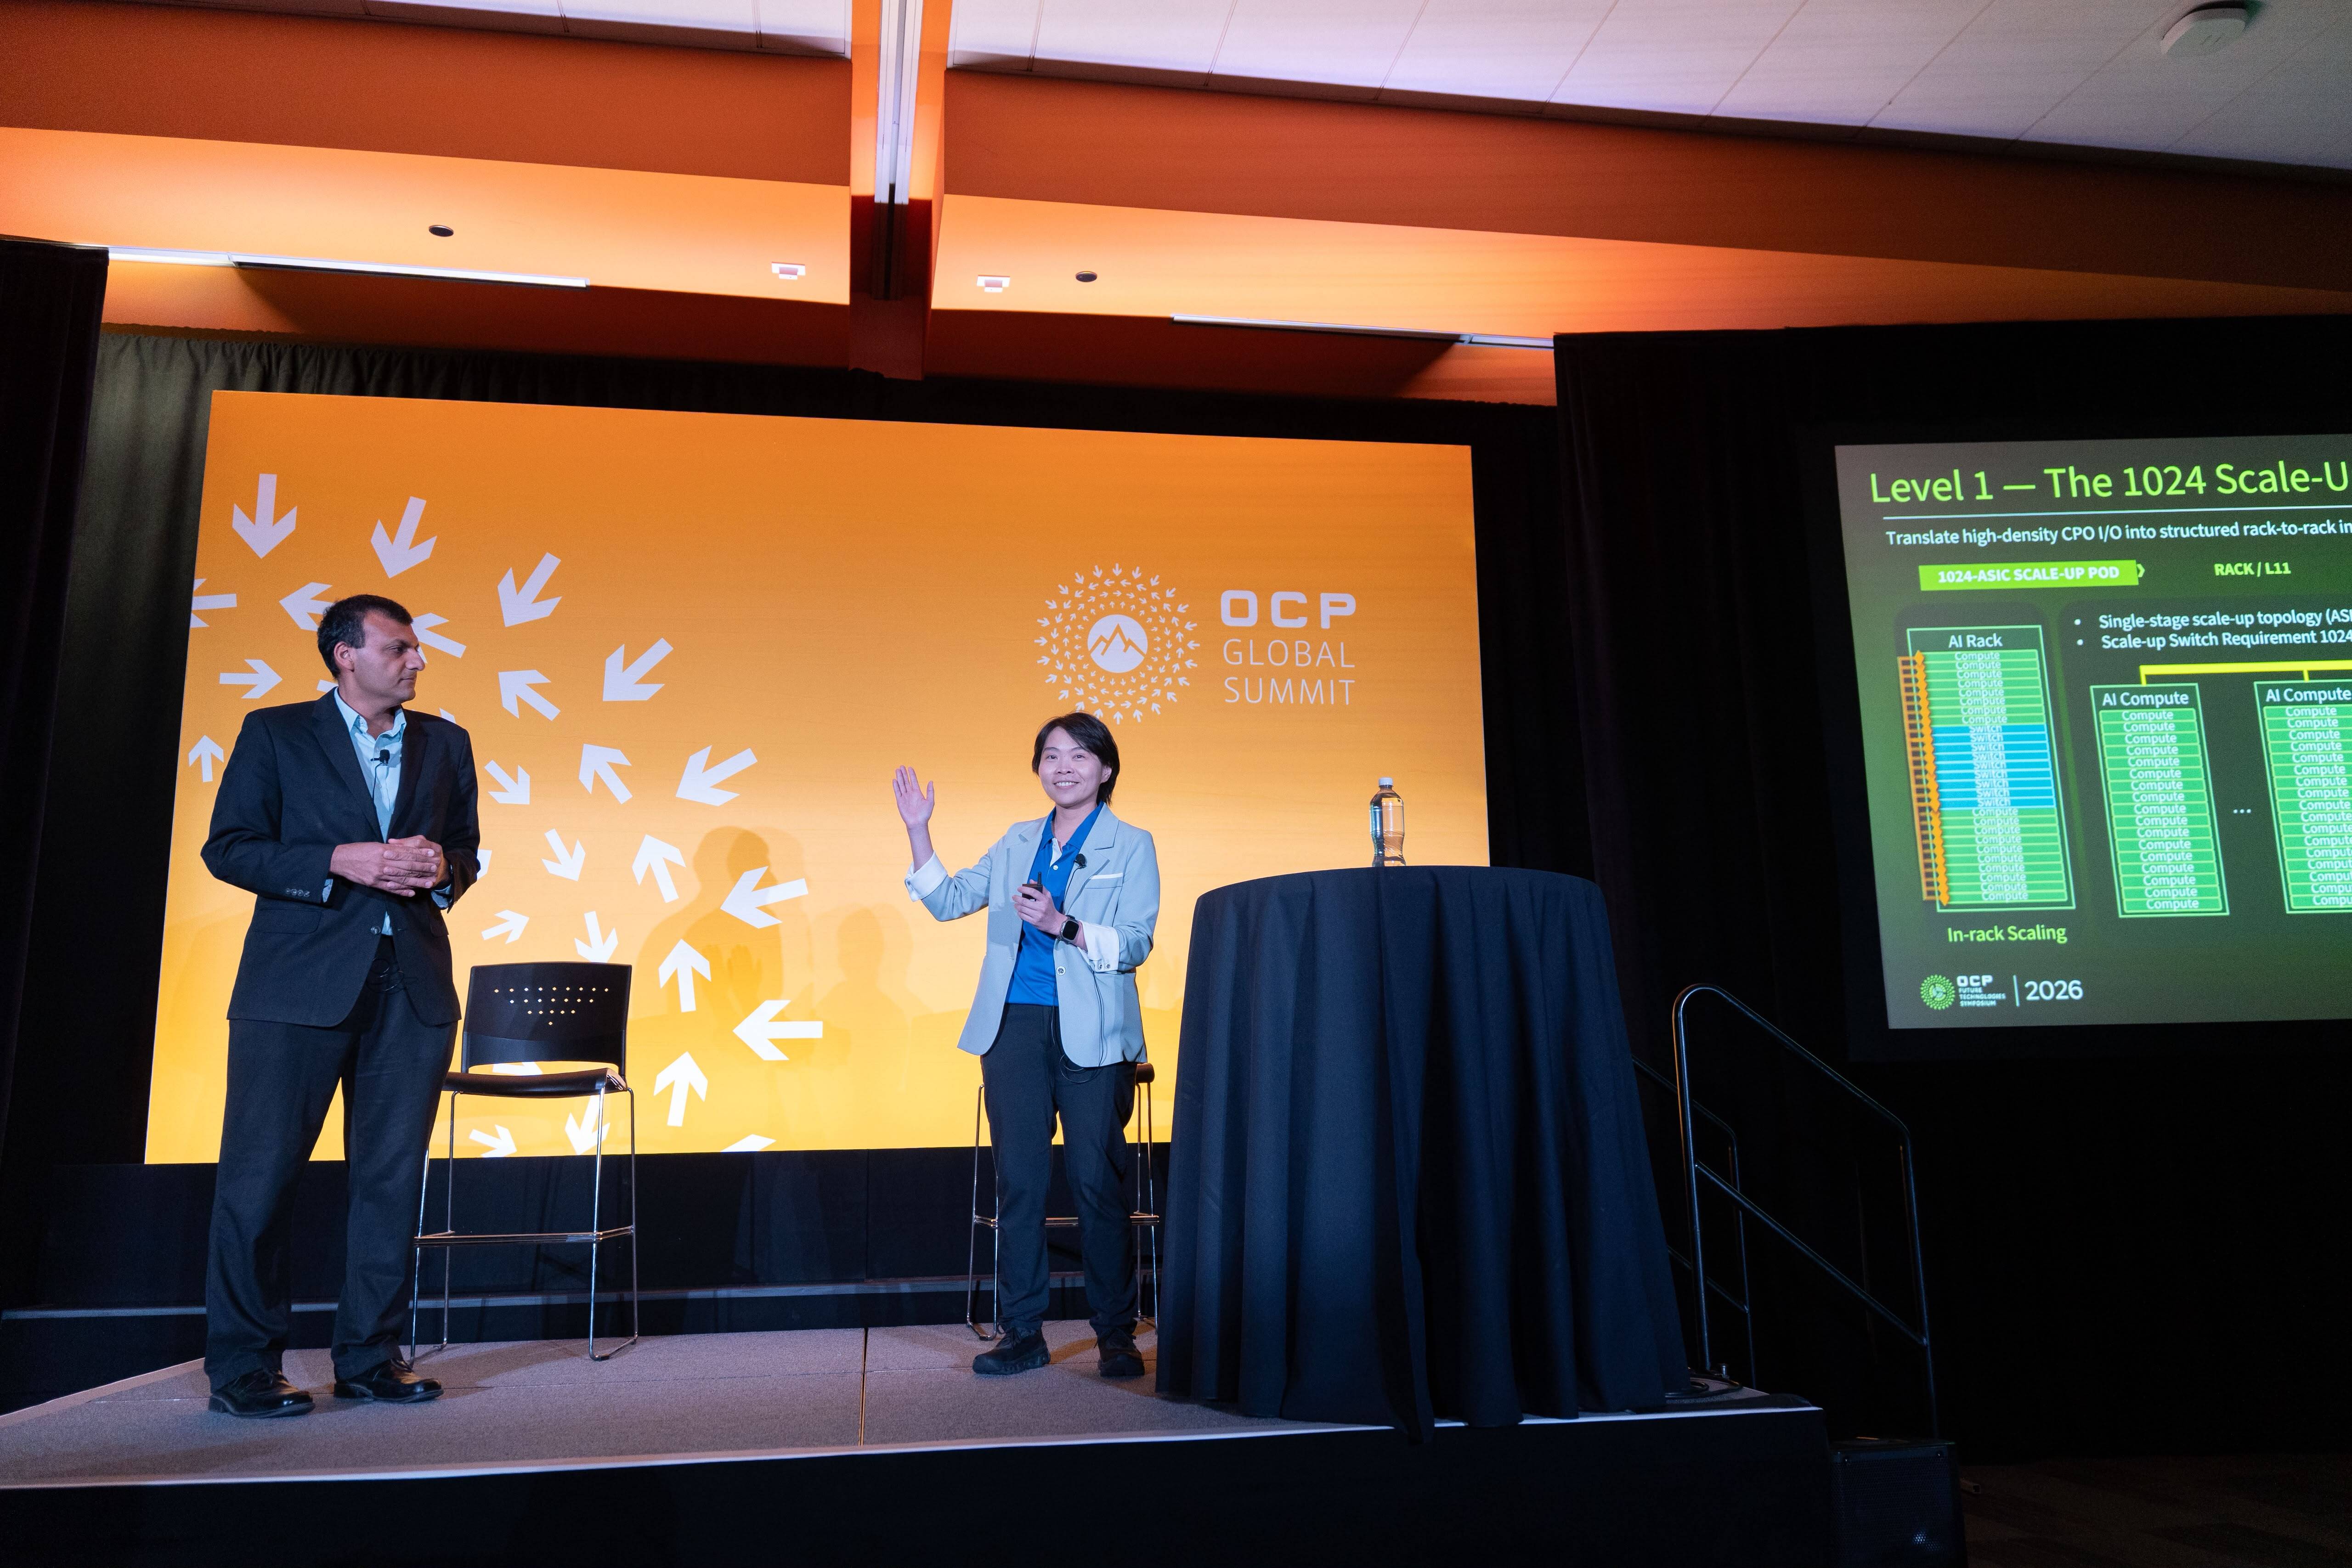
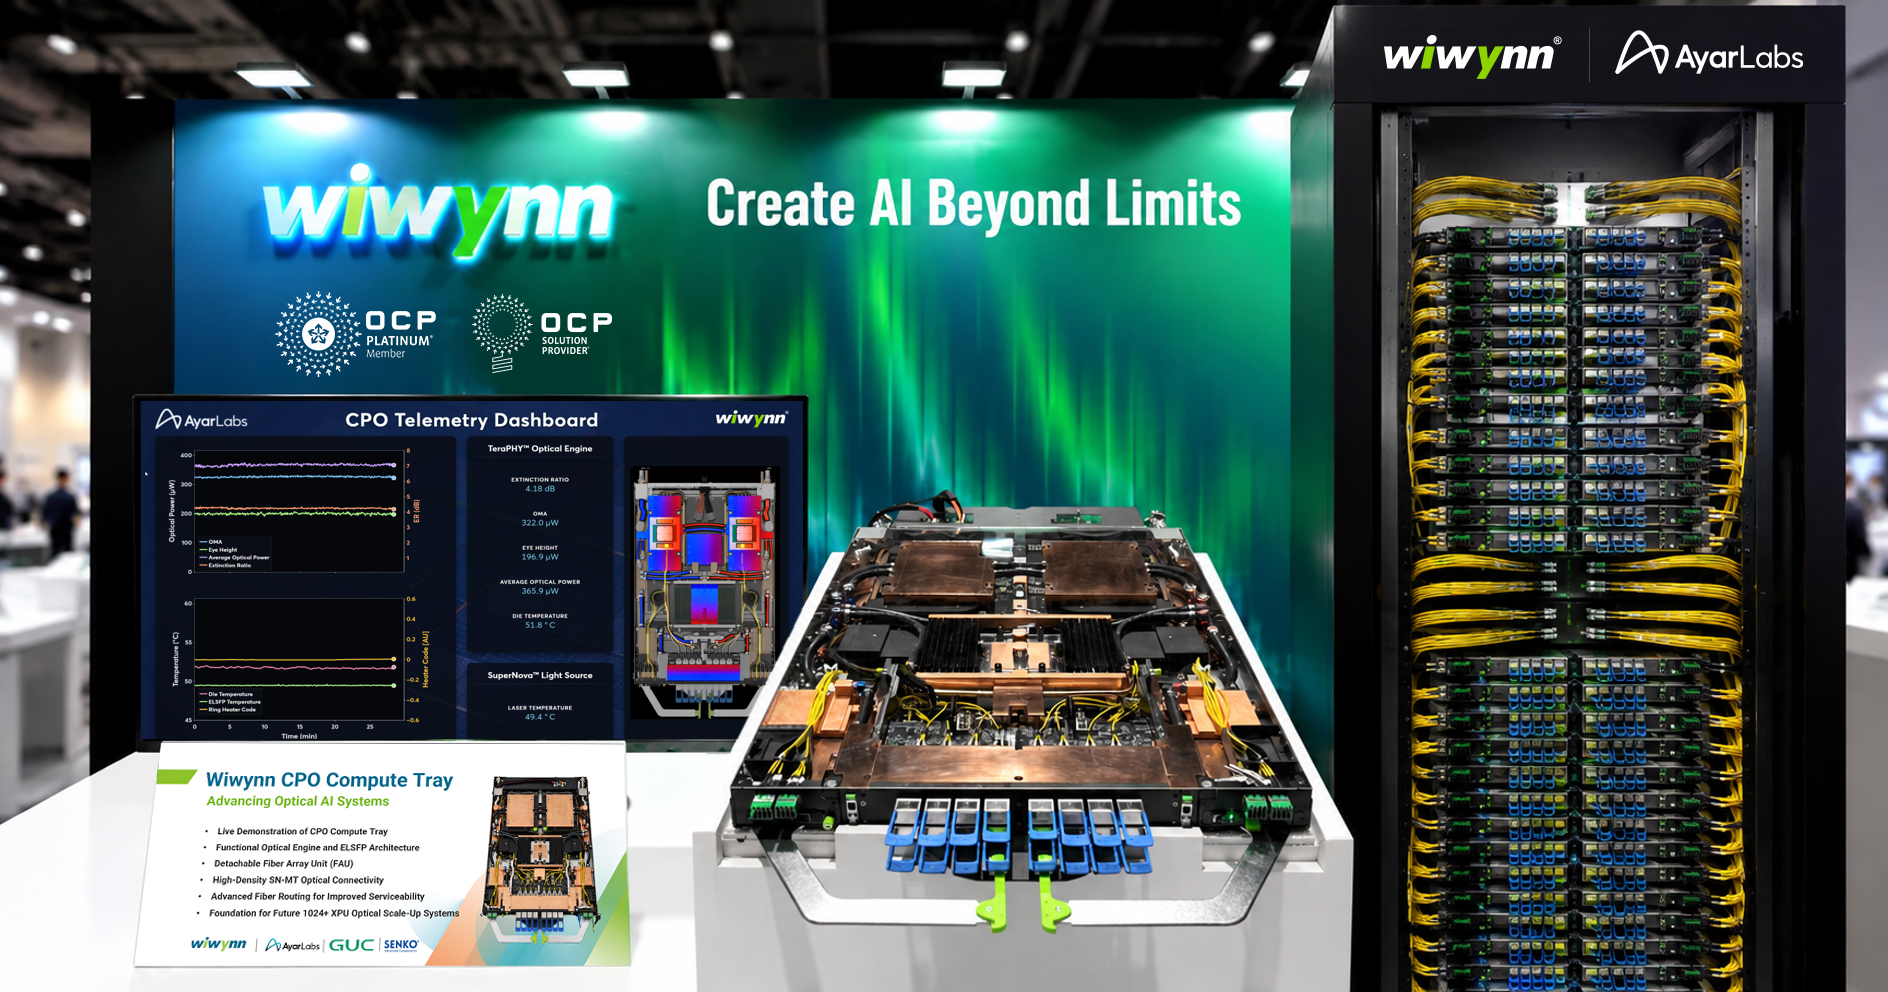
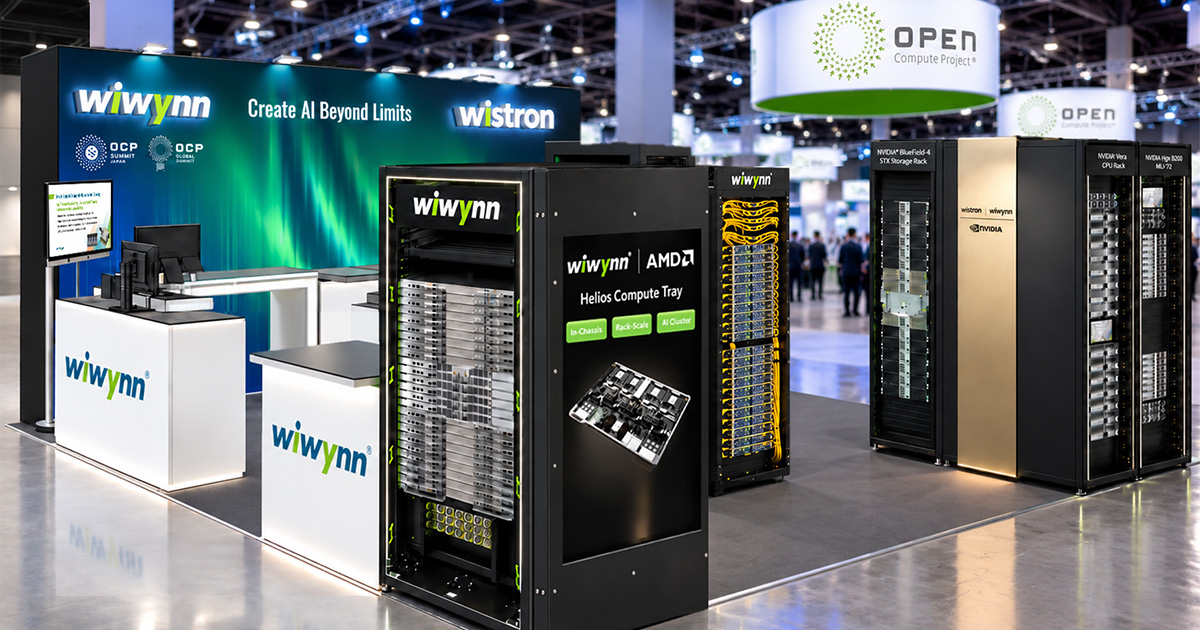
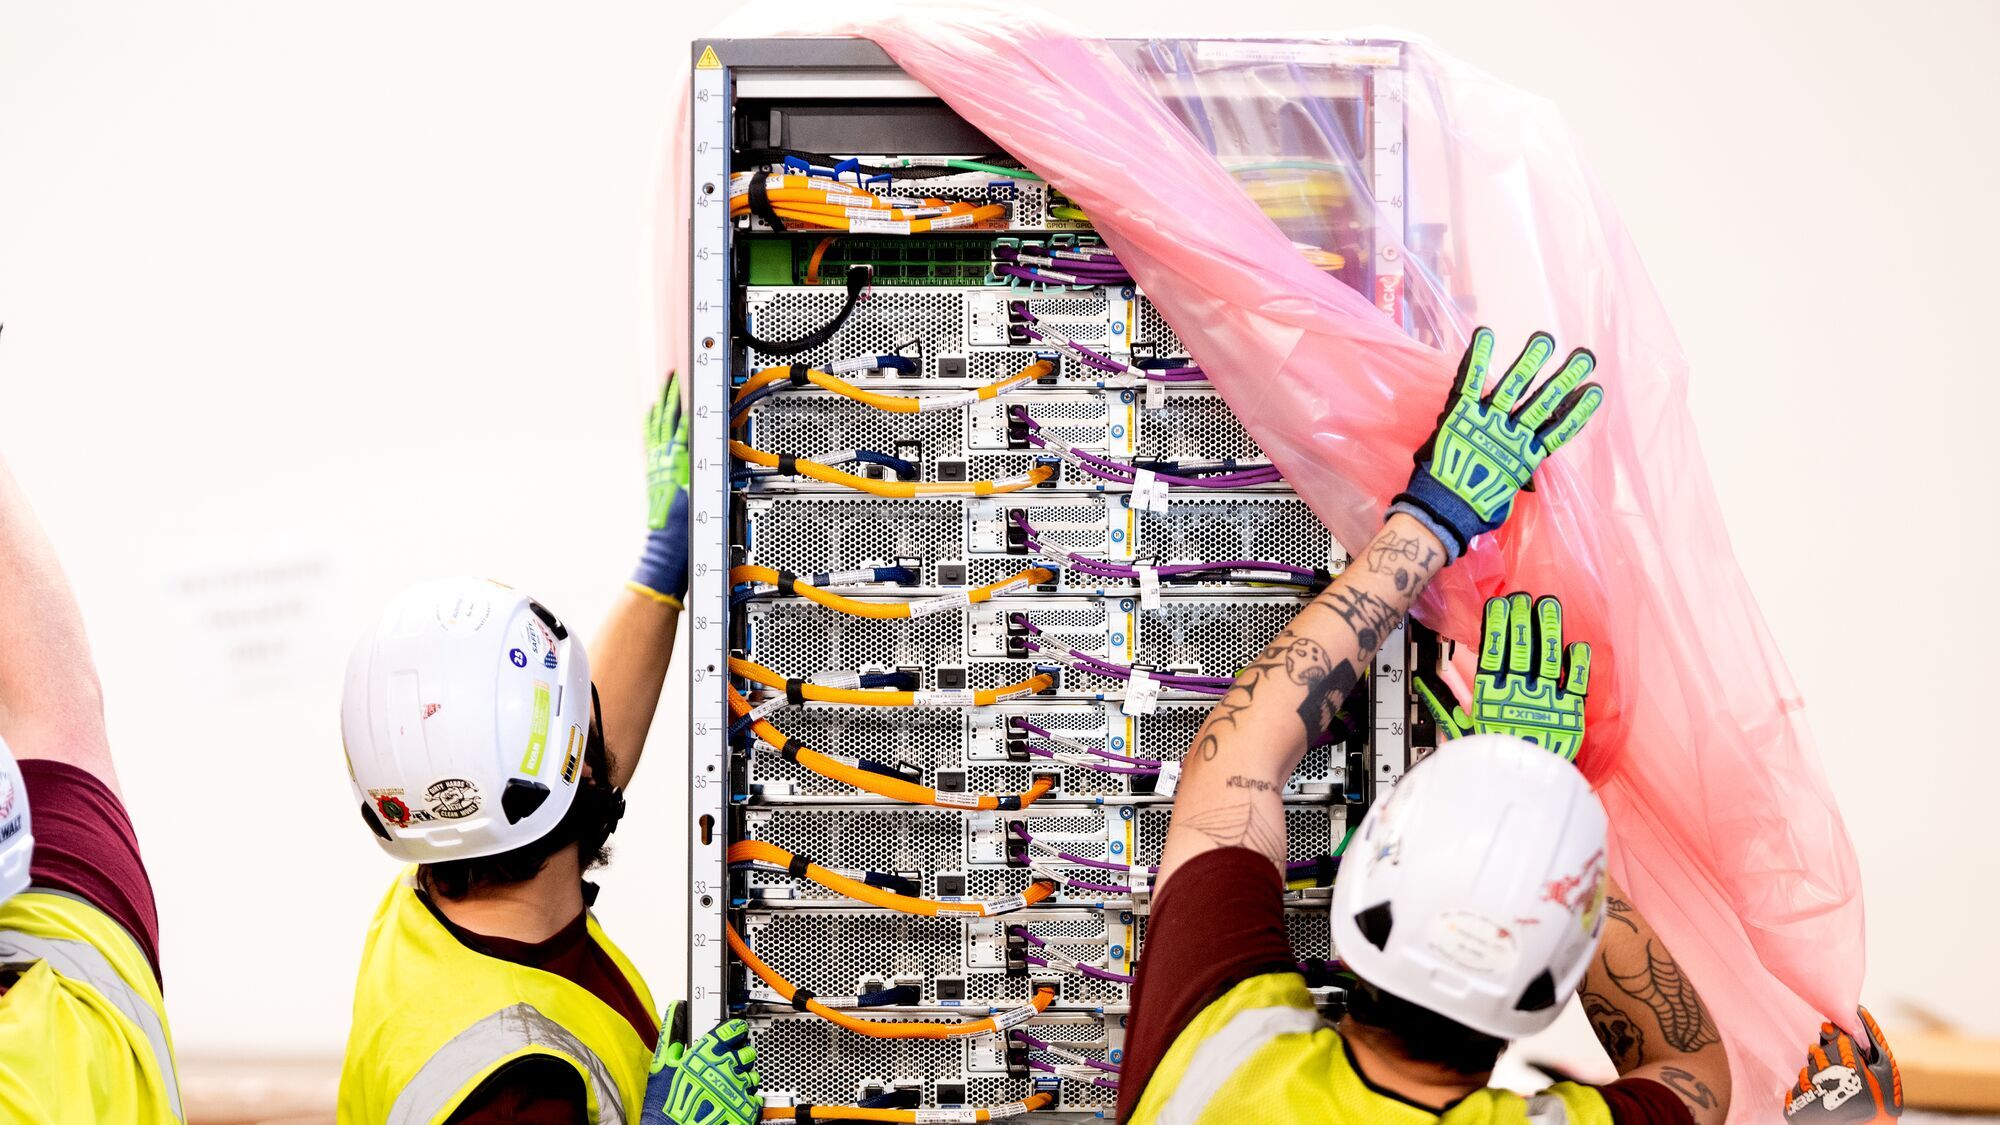
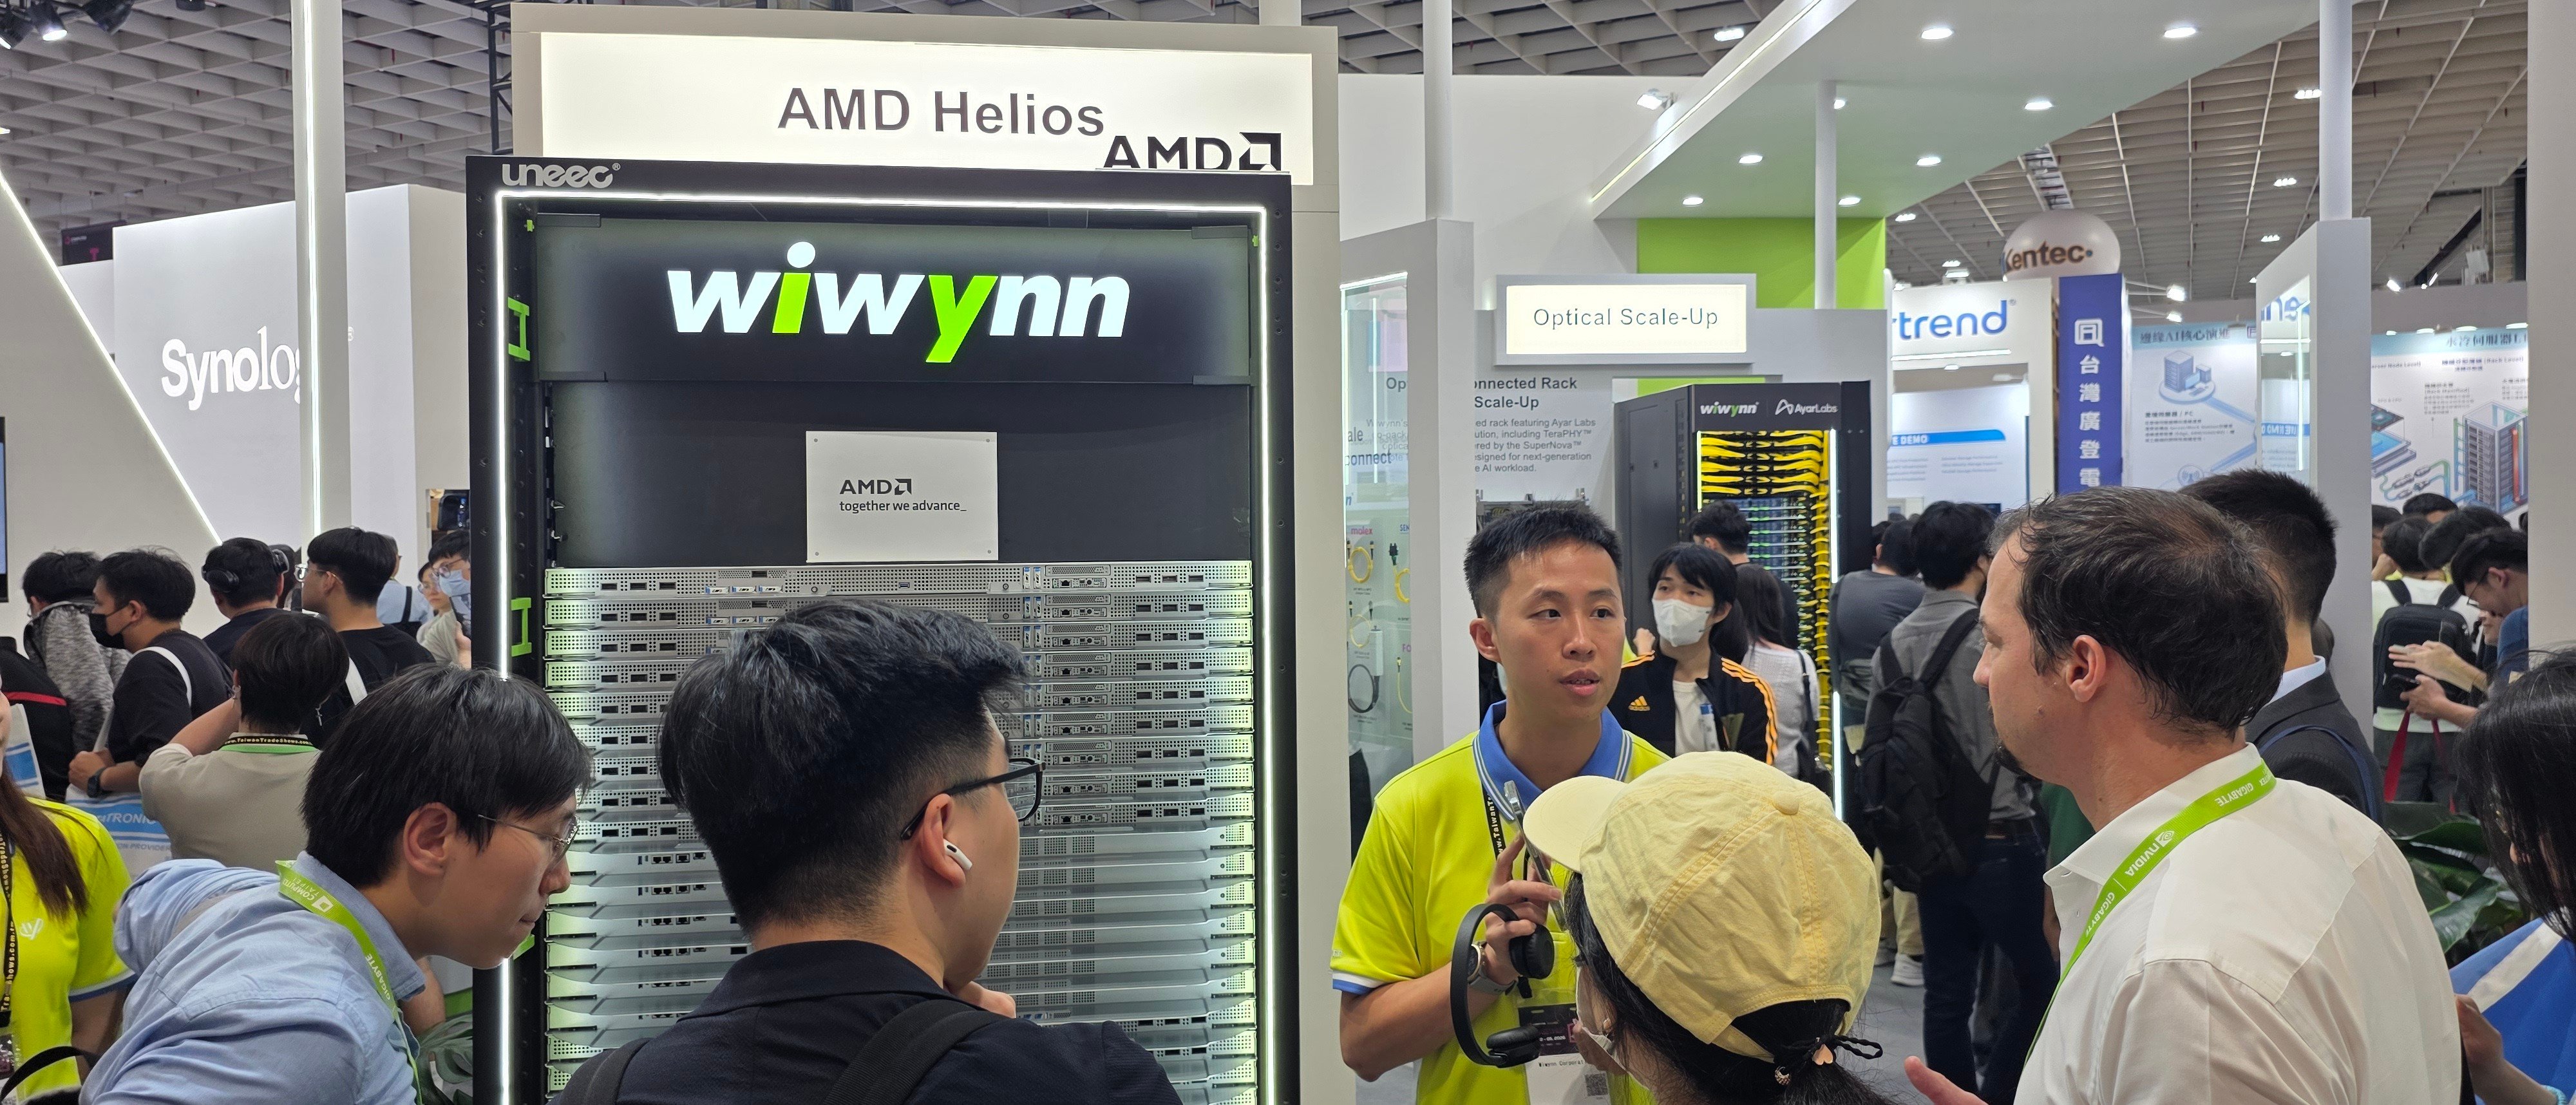
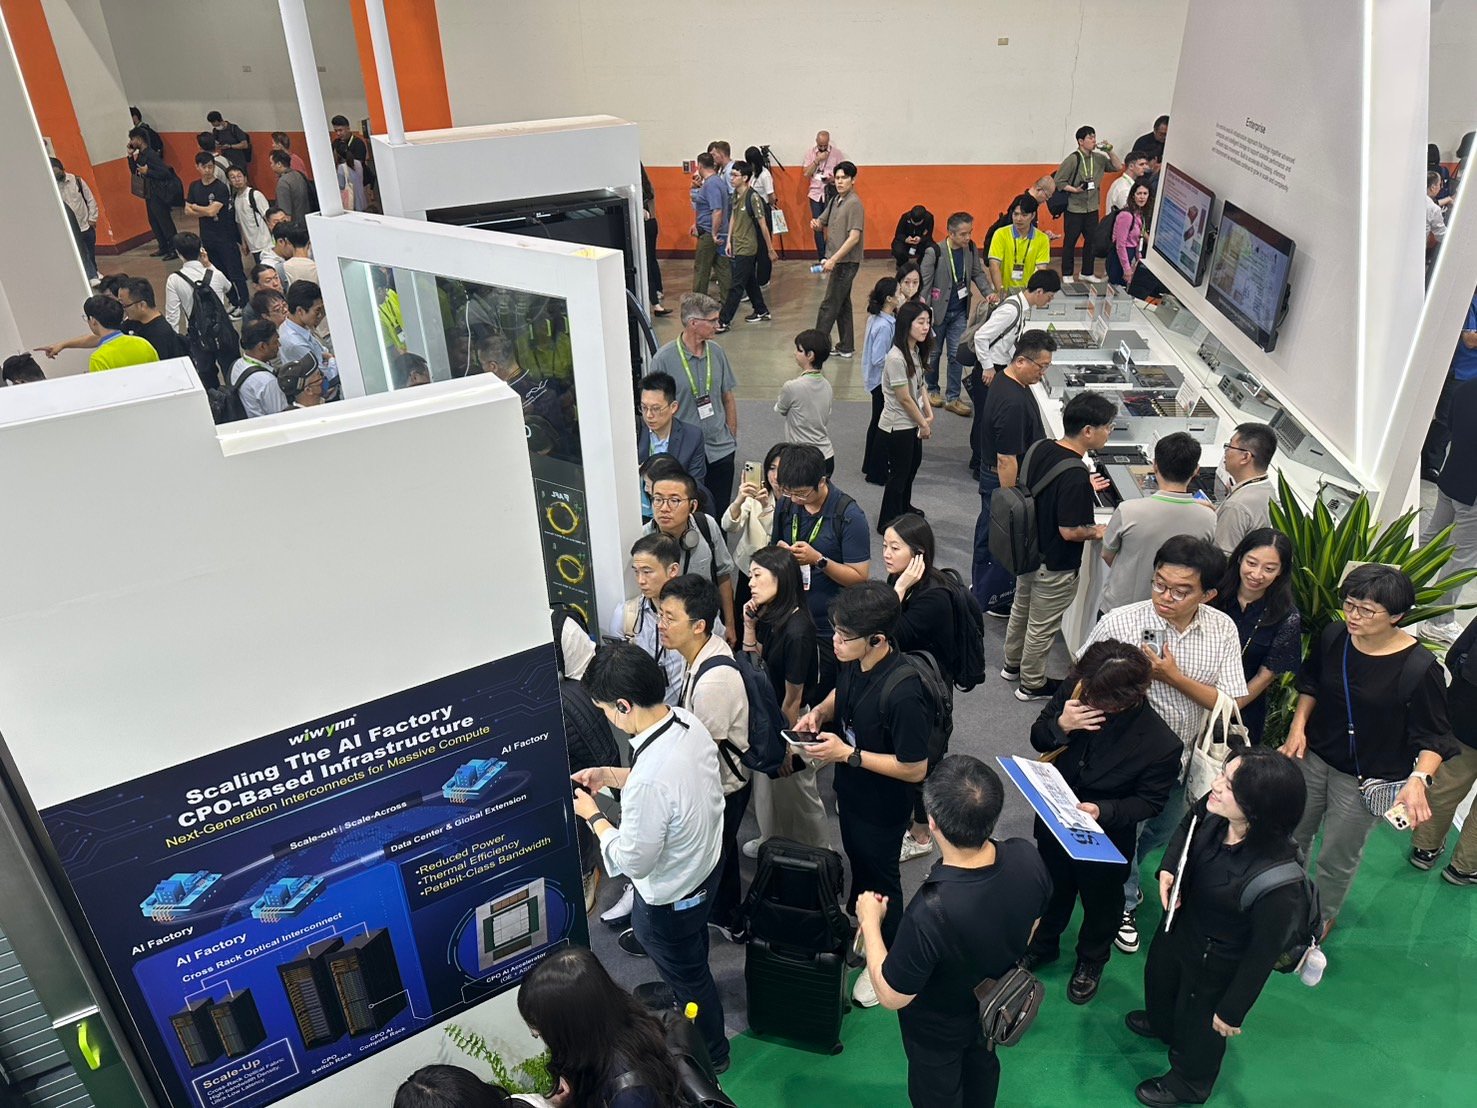
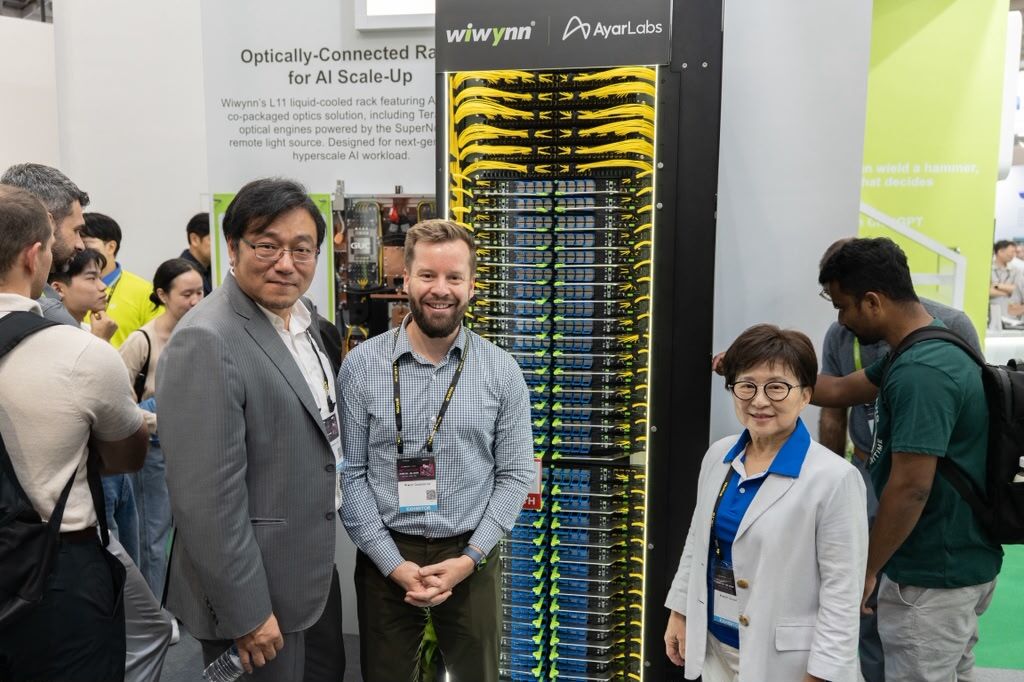
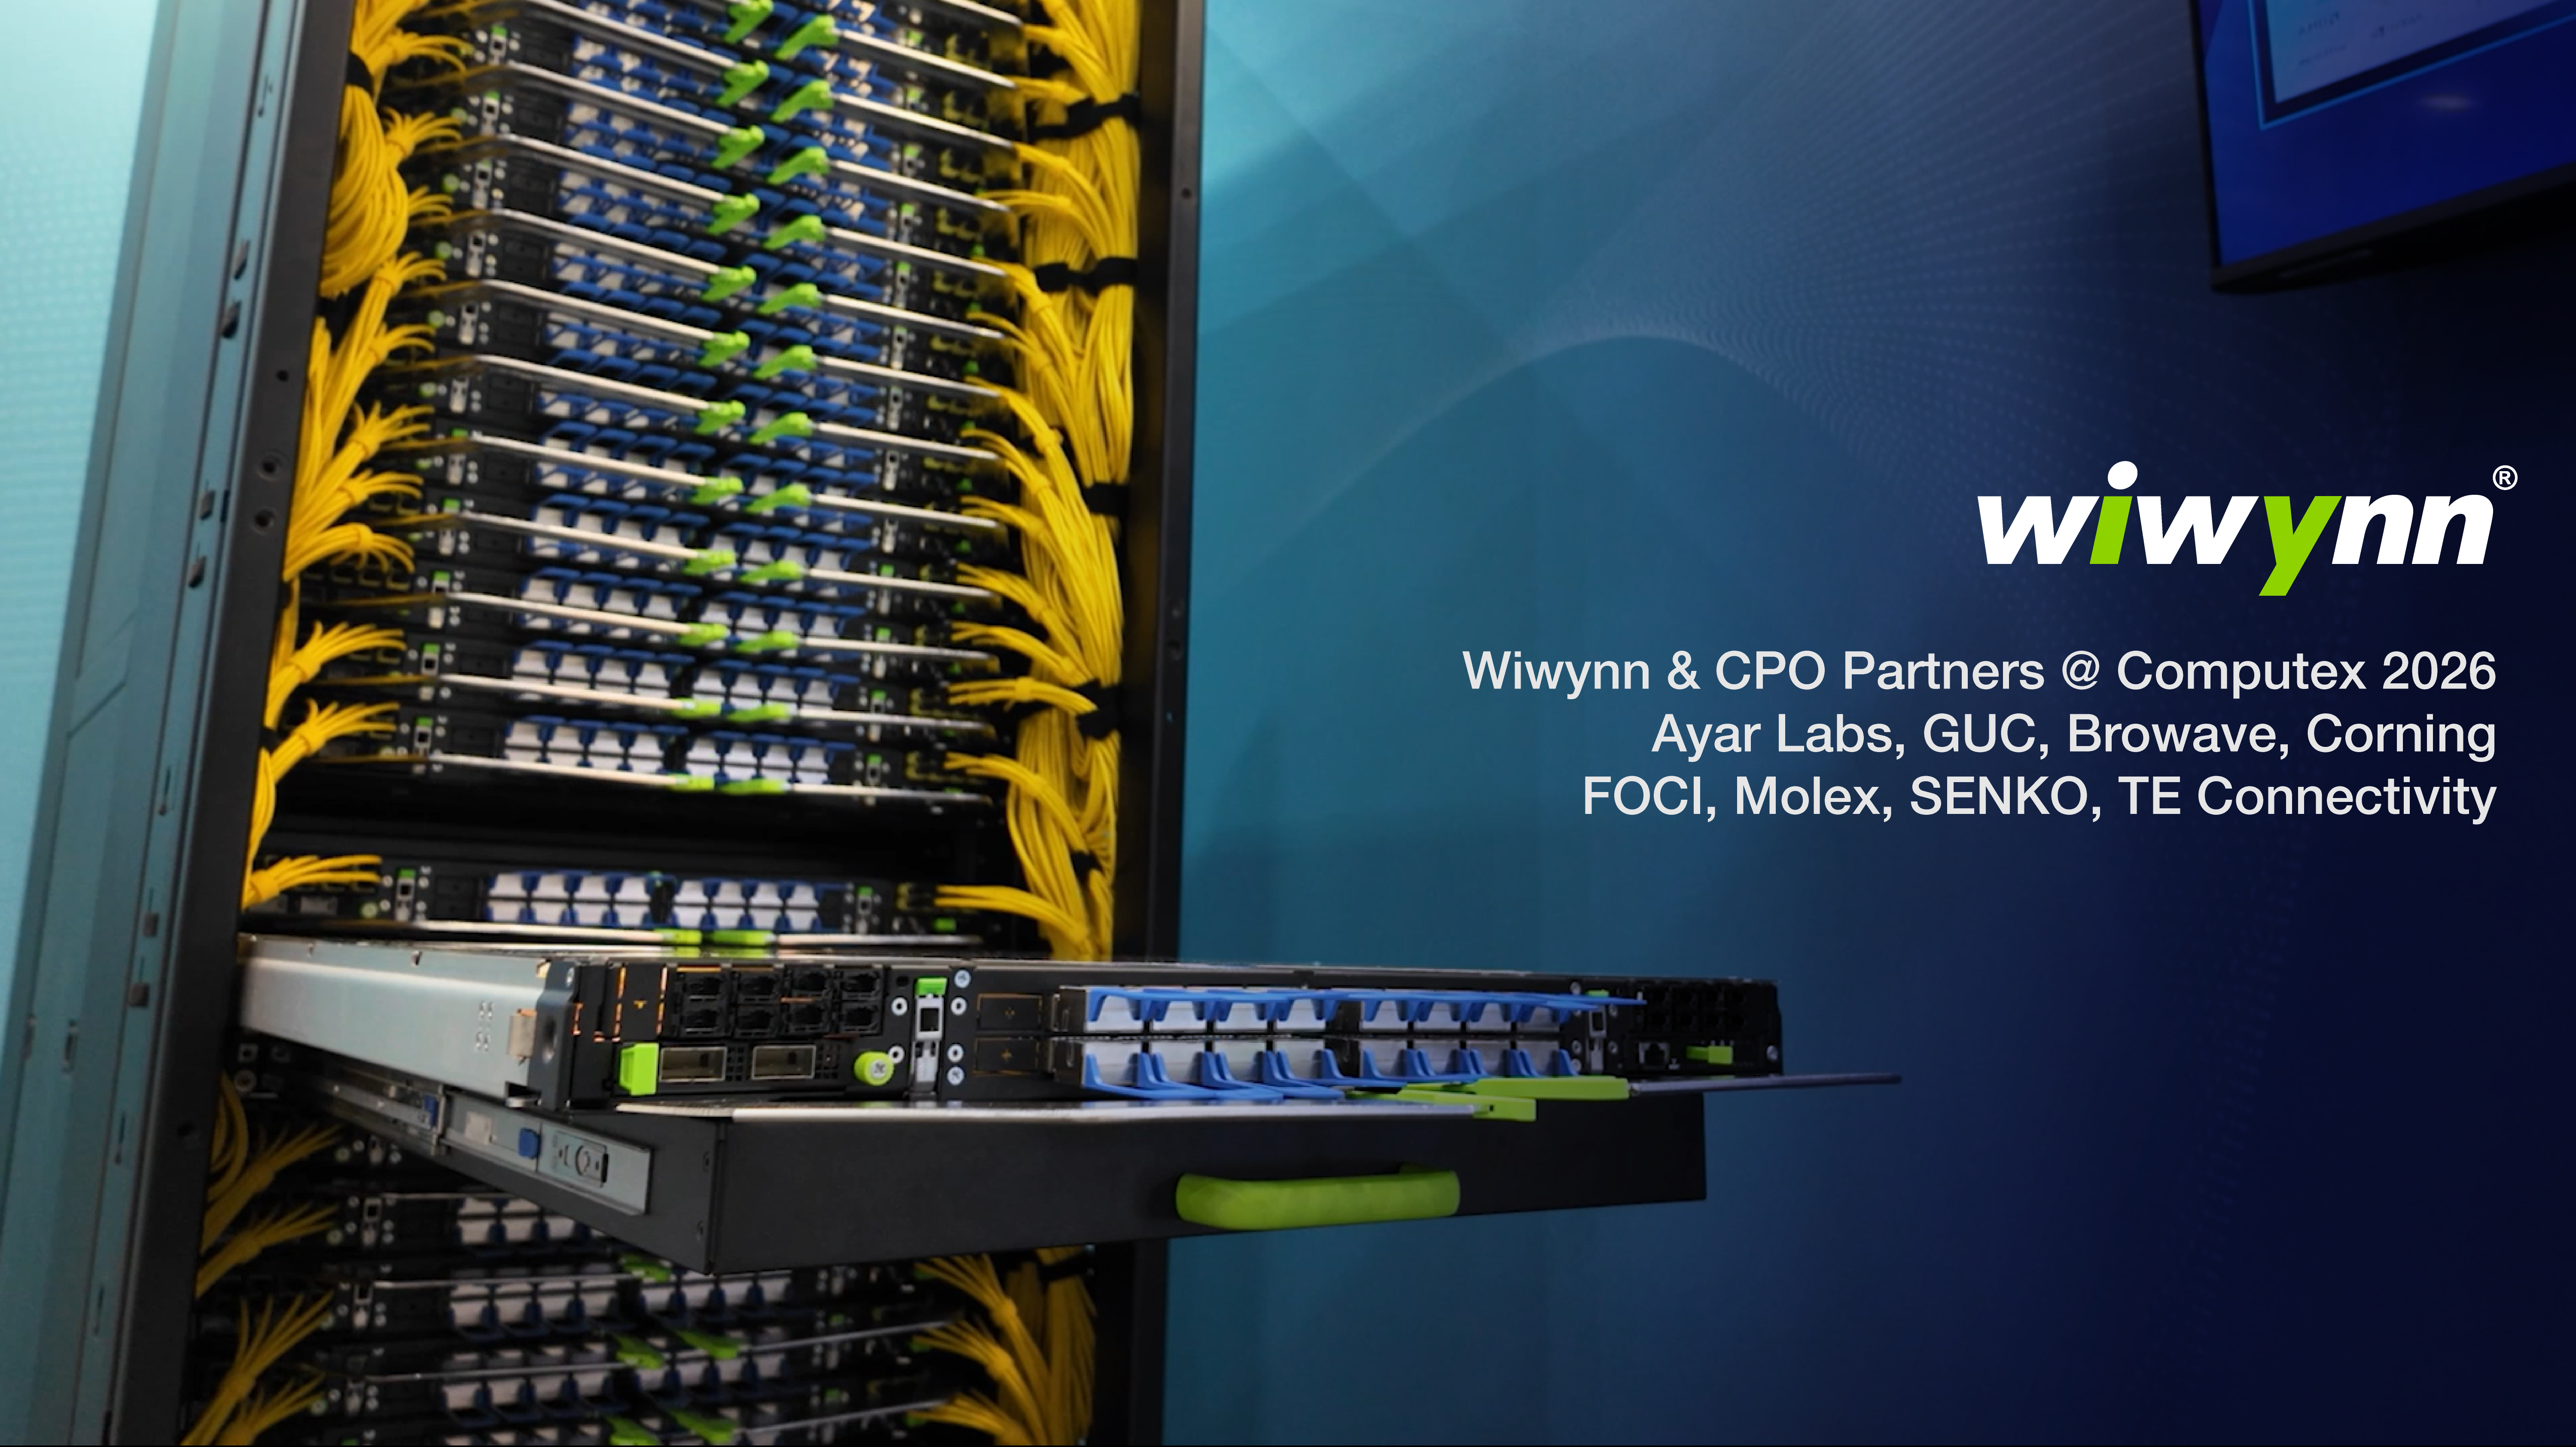
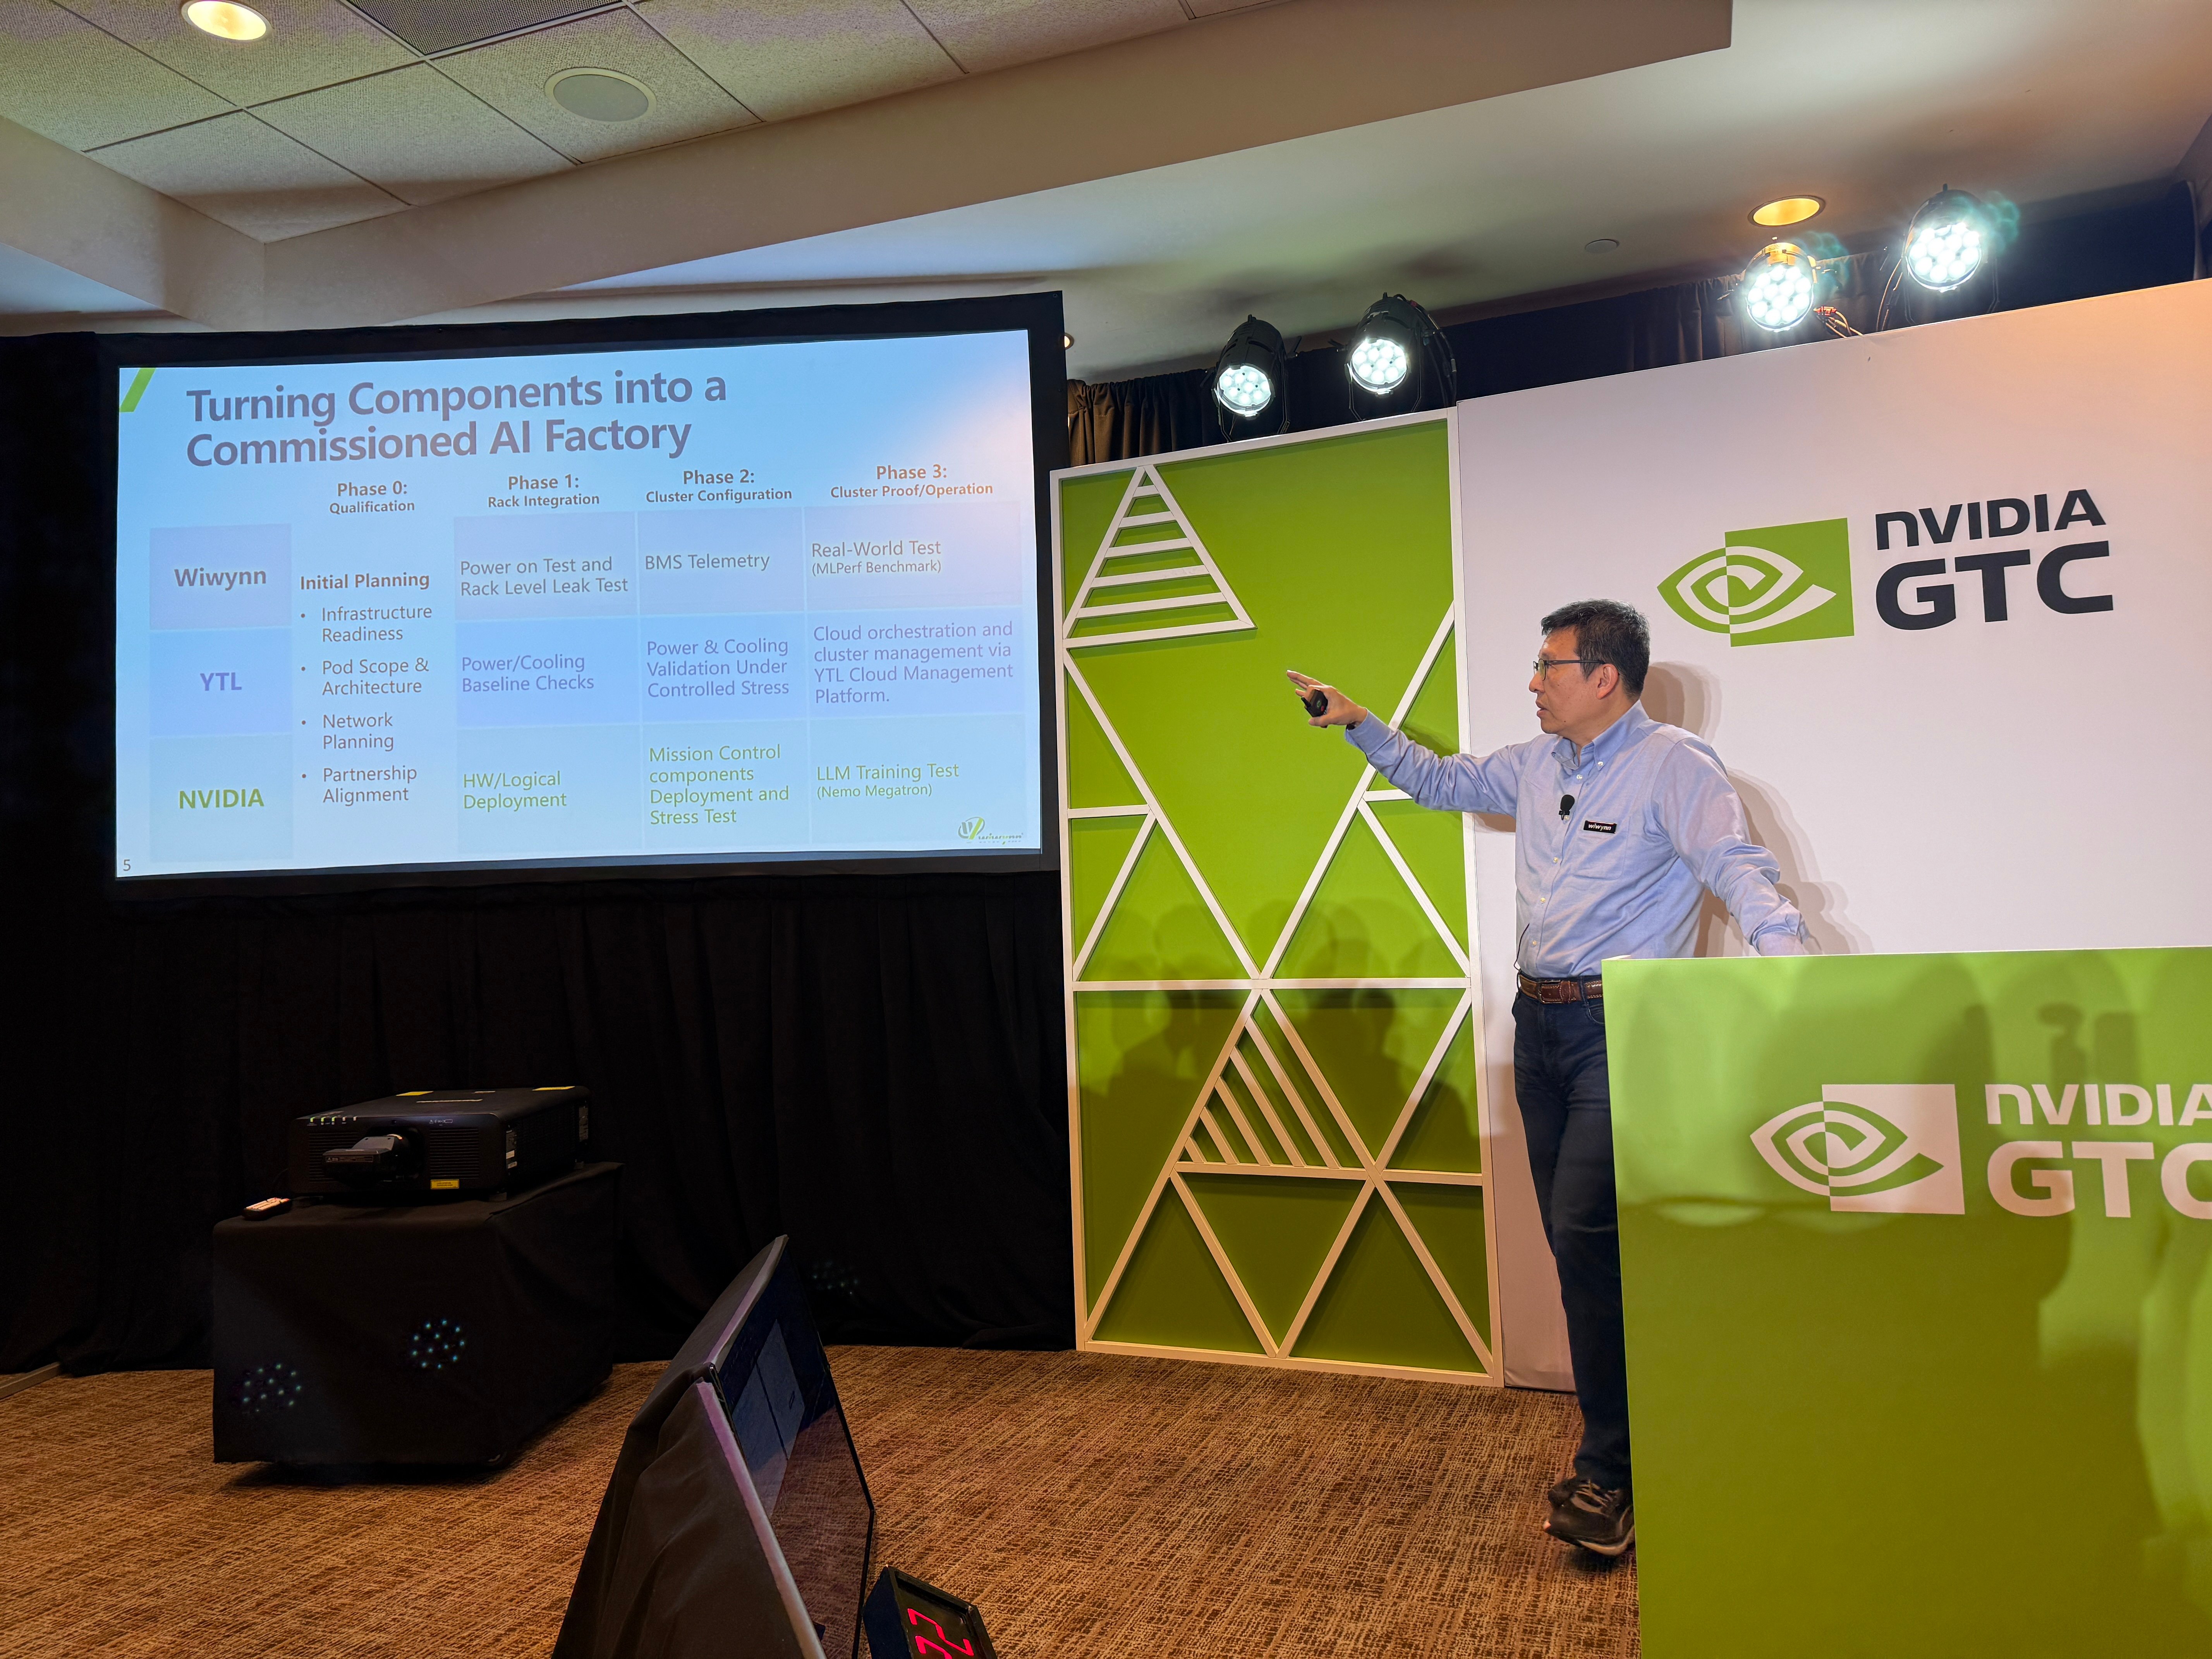
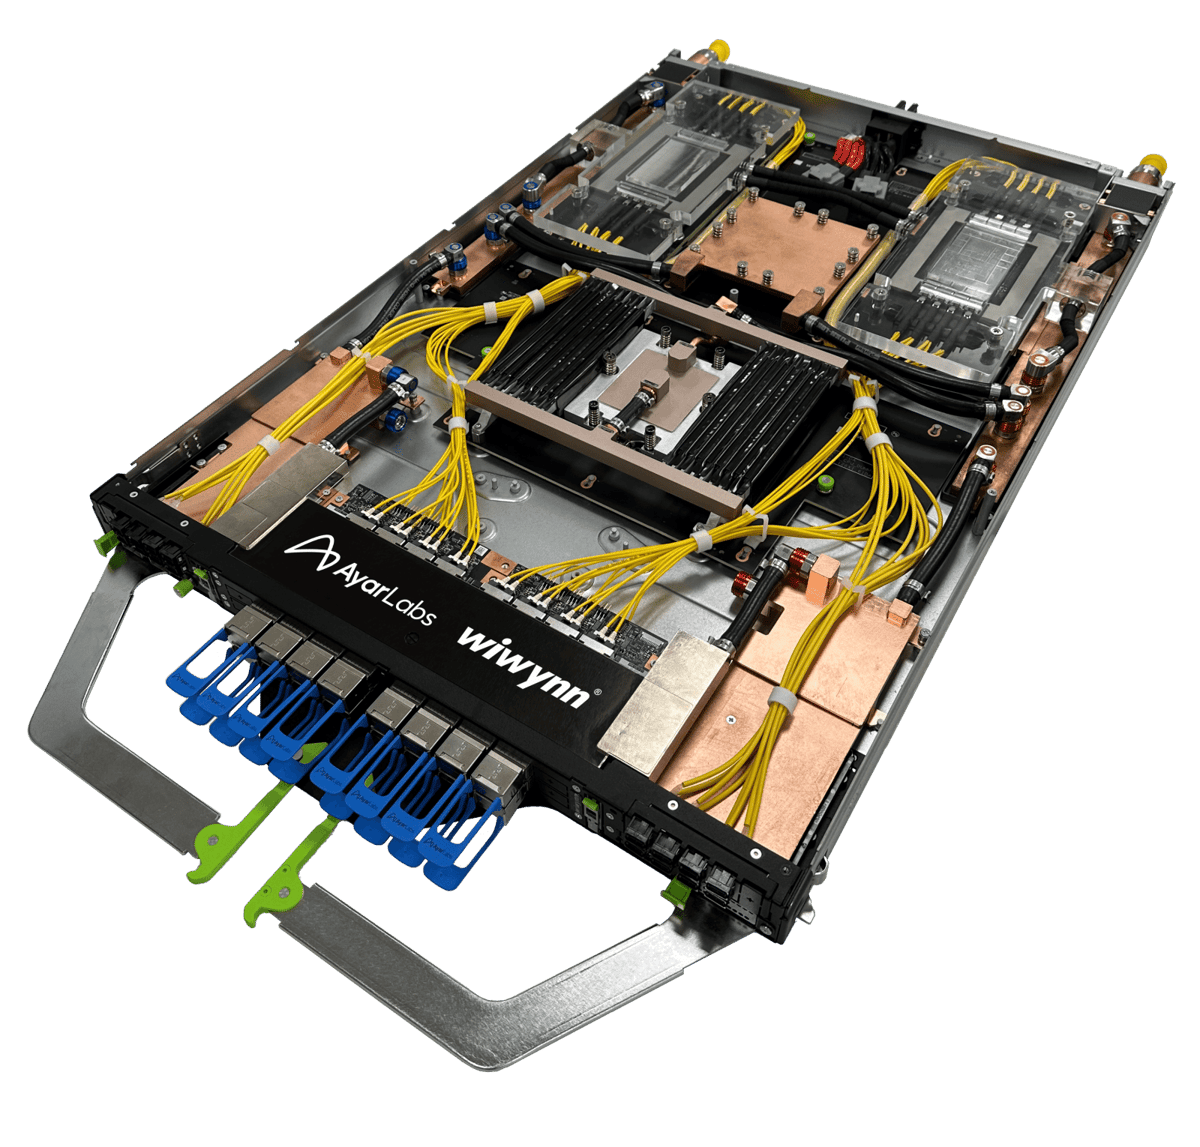
Wiwynn Corporation is a cloud IT infrastructure provider specializing in high-density computing, storage, and rack solutions for hyperscale data centers. The company develops next-generation technologies focused on cloud, artificial intelligence, advanced connectivity, and edge computing to optimize total cost of ownership and workload efficiency. Wiwynn serves leading data center operators and cloud service providers, with a manufacturing footprint that includes a facility in Texas, USA. The company collaborates with partners such as Ayar Labs, GUC, and Shinwa Controls on co-packaged optics and liquid cooling solutions. Wiwynn is a platinum member of the Open Compute Project (OCP). Summarised from the company's own disclosures, fiscal year ended Oct 2026 |
Industry Computer Hardware | Homepage wiwynn.com |
| Sector Technology | IR page wiwynn.com/investors | |
|
Tags
data center infrastructure, cloud computing, ai hardware, rack solutions, high-density computing, storage systems, co-packaged optics, liquid cooling, edge computing, open compute project, Ayar Labs, GUC, Shinwa Controls, OCP
|
Press page wiwynn.com/news |
Metrics
| Valuation | |
|---|---|
| Market cap | NT$ 823.904B |
| Market cap (USD) | $ 25.007B |
| P/E | 8.38 |
| PEG | 0.16 |
| P/BV | 4.38 |
| P/S | 0.64 |
| P/OCF | -41.21 |
| P/FCF | — |
| Dividend yield | — |
| Turnover / mcap | — |
| Returns | |
|---|---|
| ROE | 48.0% |
| ROI | 41.0% |
| ROIC | 39.7% |
| Profit margin | 5.4% |
| Growth | |
|---|---|
| Revenue growing | Yes |
| Profits growing | Yes |
| Revenue up 3y | No |
| Revenue up 5y | No |
| Earnings growth 3y (net profit CAGR) | 53.4% |
| Quality | |
|---|---|
| Profitable | Yes |
| Margin expanding | No |
| Buying back stock | No |
| Diluting (TTM) | — |
| Debt/Equity | — |
| Podcast bulls (TTM) | Sign up |
| Podcast bears (TTM) | Sign up |
| Podcast sentiment (TTM) | Sign up |
| Podcast sentiment % (TTM) | Sign up |
| News sentiment (TTM) | 48 |
| Quality score | 20.0% |
| Insiders | |
|---|---|
| Buys, 1w | Sign up |
| Buys, 1m | Sign up |
| Buys, 1y | Sign up |
| Sells, 1w | Sign up |
| Sells, 1m | Sign up |
| Sells, 1y | Sign up |
Sign up to see this company's insider trades
| Figure | FY 2025 | FY 2024 | FY 2023 | FY 2022 | FY 2021 | FY 2020 | FY 2019 | FY 2018 | FY 2017 | FY 2016 | FY 2015 |
|---|---|---|---|---|---|---|---|---|---|---|---|
| Revenue | 950.663B | 360.541B | 241.901B | 292.876B | 192.626B | 186.928B | 163.6B | 181.065B | 85.675B | 31.741B | 10.803B |
| Net profit | 51.118B | 22.776B | 12.044B | 14.175B | 8.648B | 8.61B | 6.169B | 5.578B | 1.208B | 311.272M | 273.371M |
| Figure | FY 2025 | FY 2024 | FY 2023 | FY 2022 | FY 2021 | FY 2020 | FY 2019 | FY 2018 | FY 2017 | FY 2016 | FY 2015 |
|---|---|---|---|---|---|---|---|---|---|---|---|
| Share price | 4.485K | 2.62K | 1.825K | 797 | 1.115K | 704 | — | — | — | — | — |
| Price performance 12m | 0.71 | 0.44 | 1.29 | -0.29 | 0.58 | — | — | — | — | — | — |
Sign up to see institutional holdings
Sign UpPodcast Mentions
Sign up to see podcast mentions and sentiment
Sign UpMaterial information published on MOPS, newest first, subjects as filed in Chinese, guarantee and loan balance notices and routine equipment purchases included. The link opens the company's material information on MOPS. Press releases from the company's own website, newest first.
公告本公司國內第一次無擔保轉換公司債代收價款行庫及 存儲專戶行庫
Bull 0
Bear 0
Routine
本公司受邀參加Macquarie舉辦之Macquarie Taiwan Conference
Bull 0
Bear 0
Routine
 Wiwynn
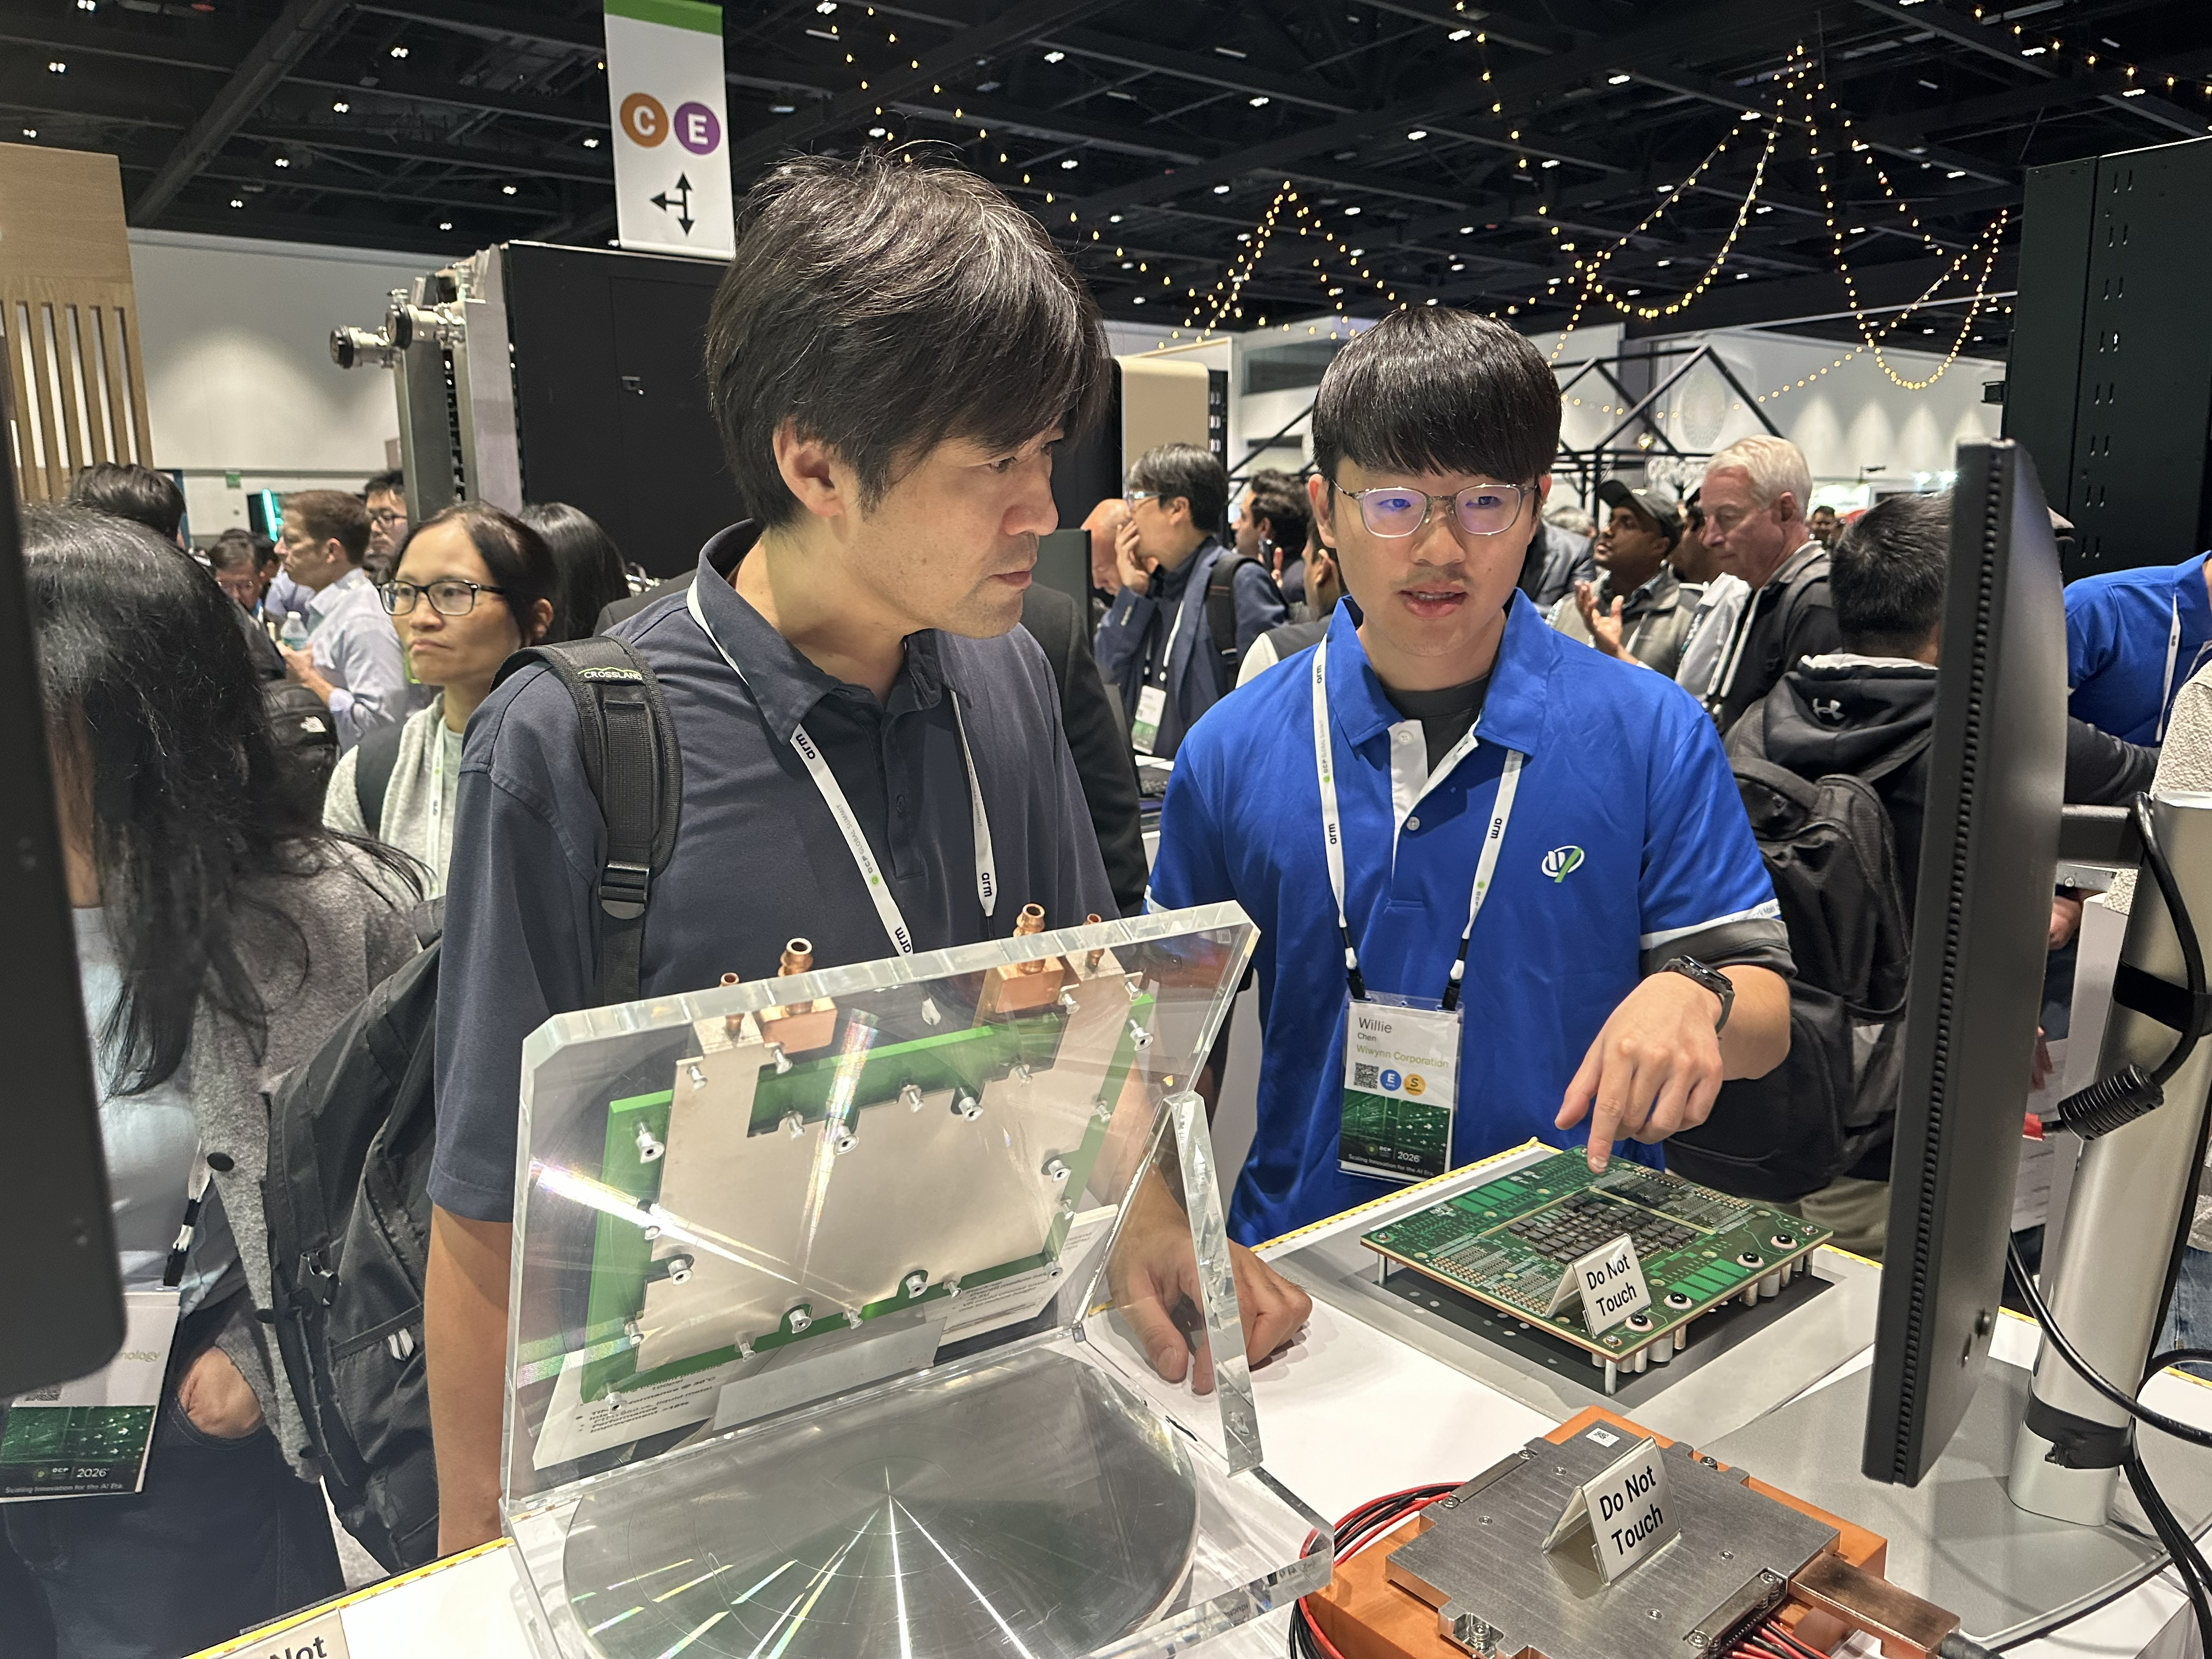
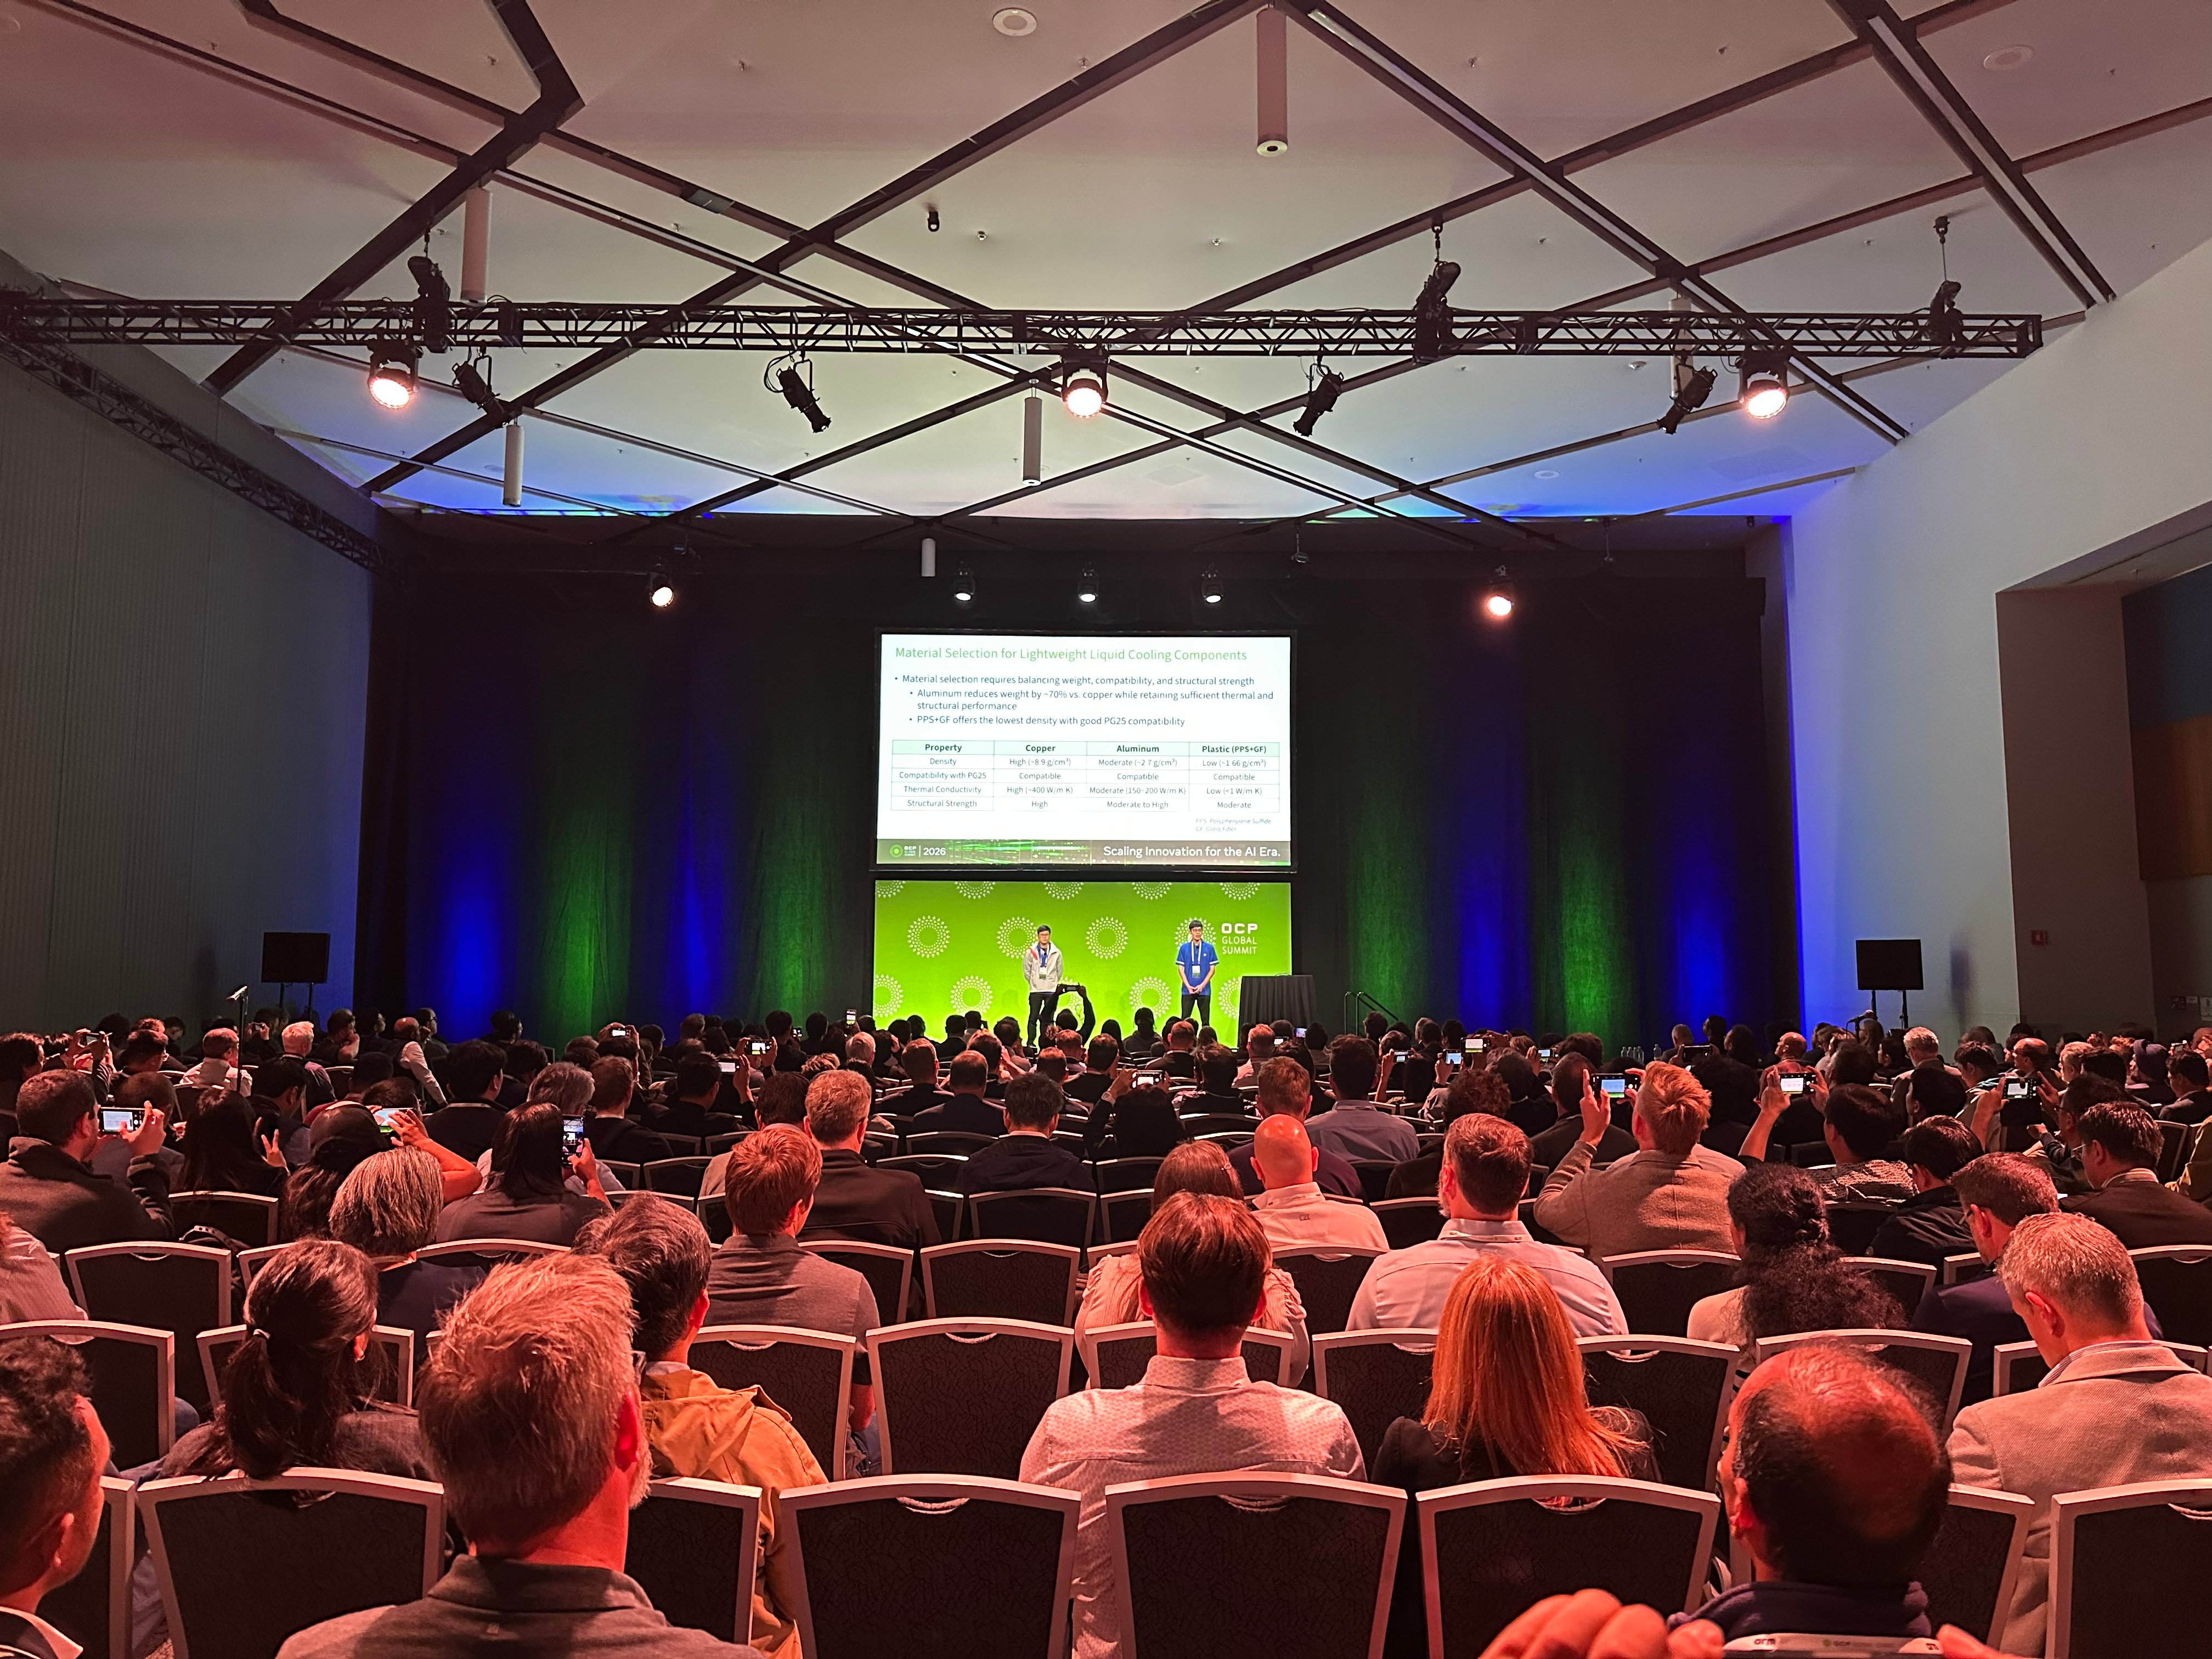
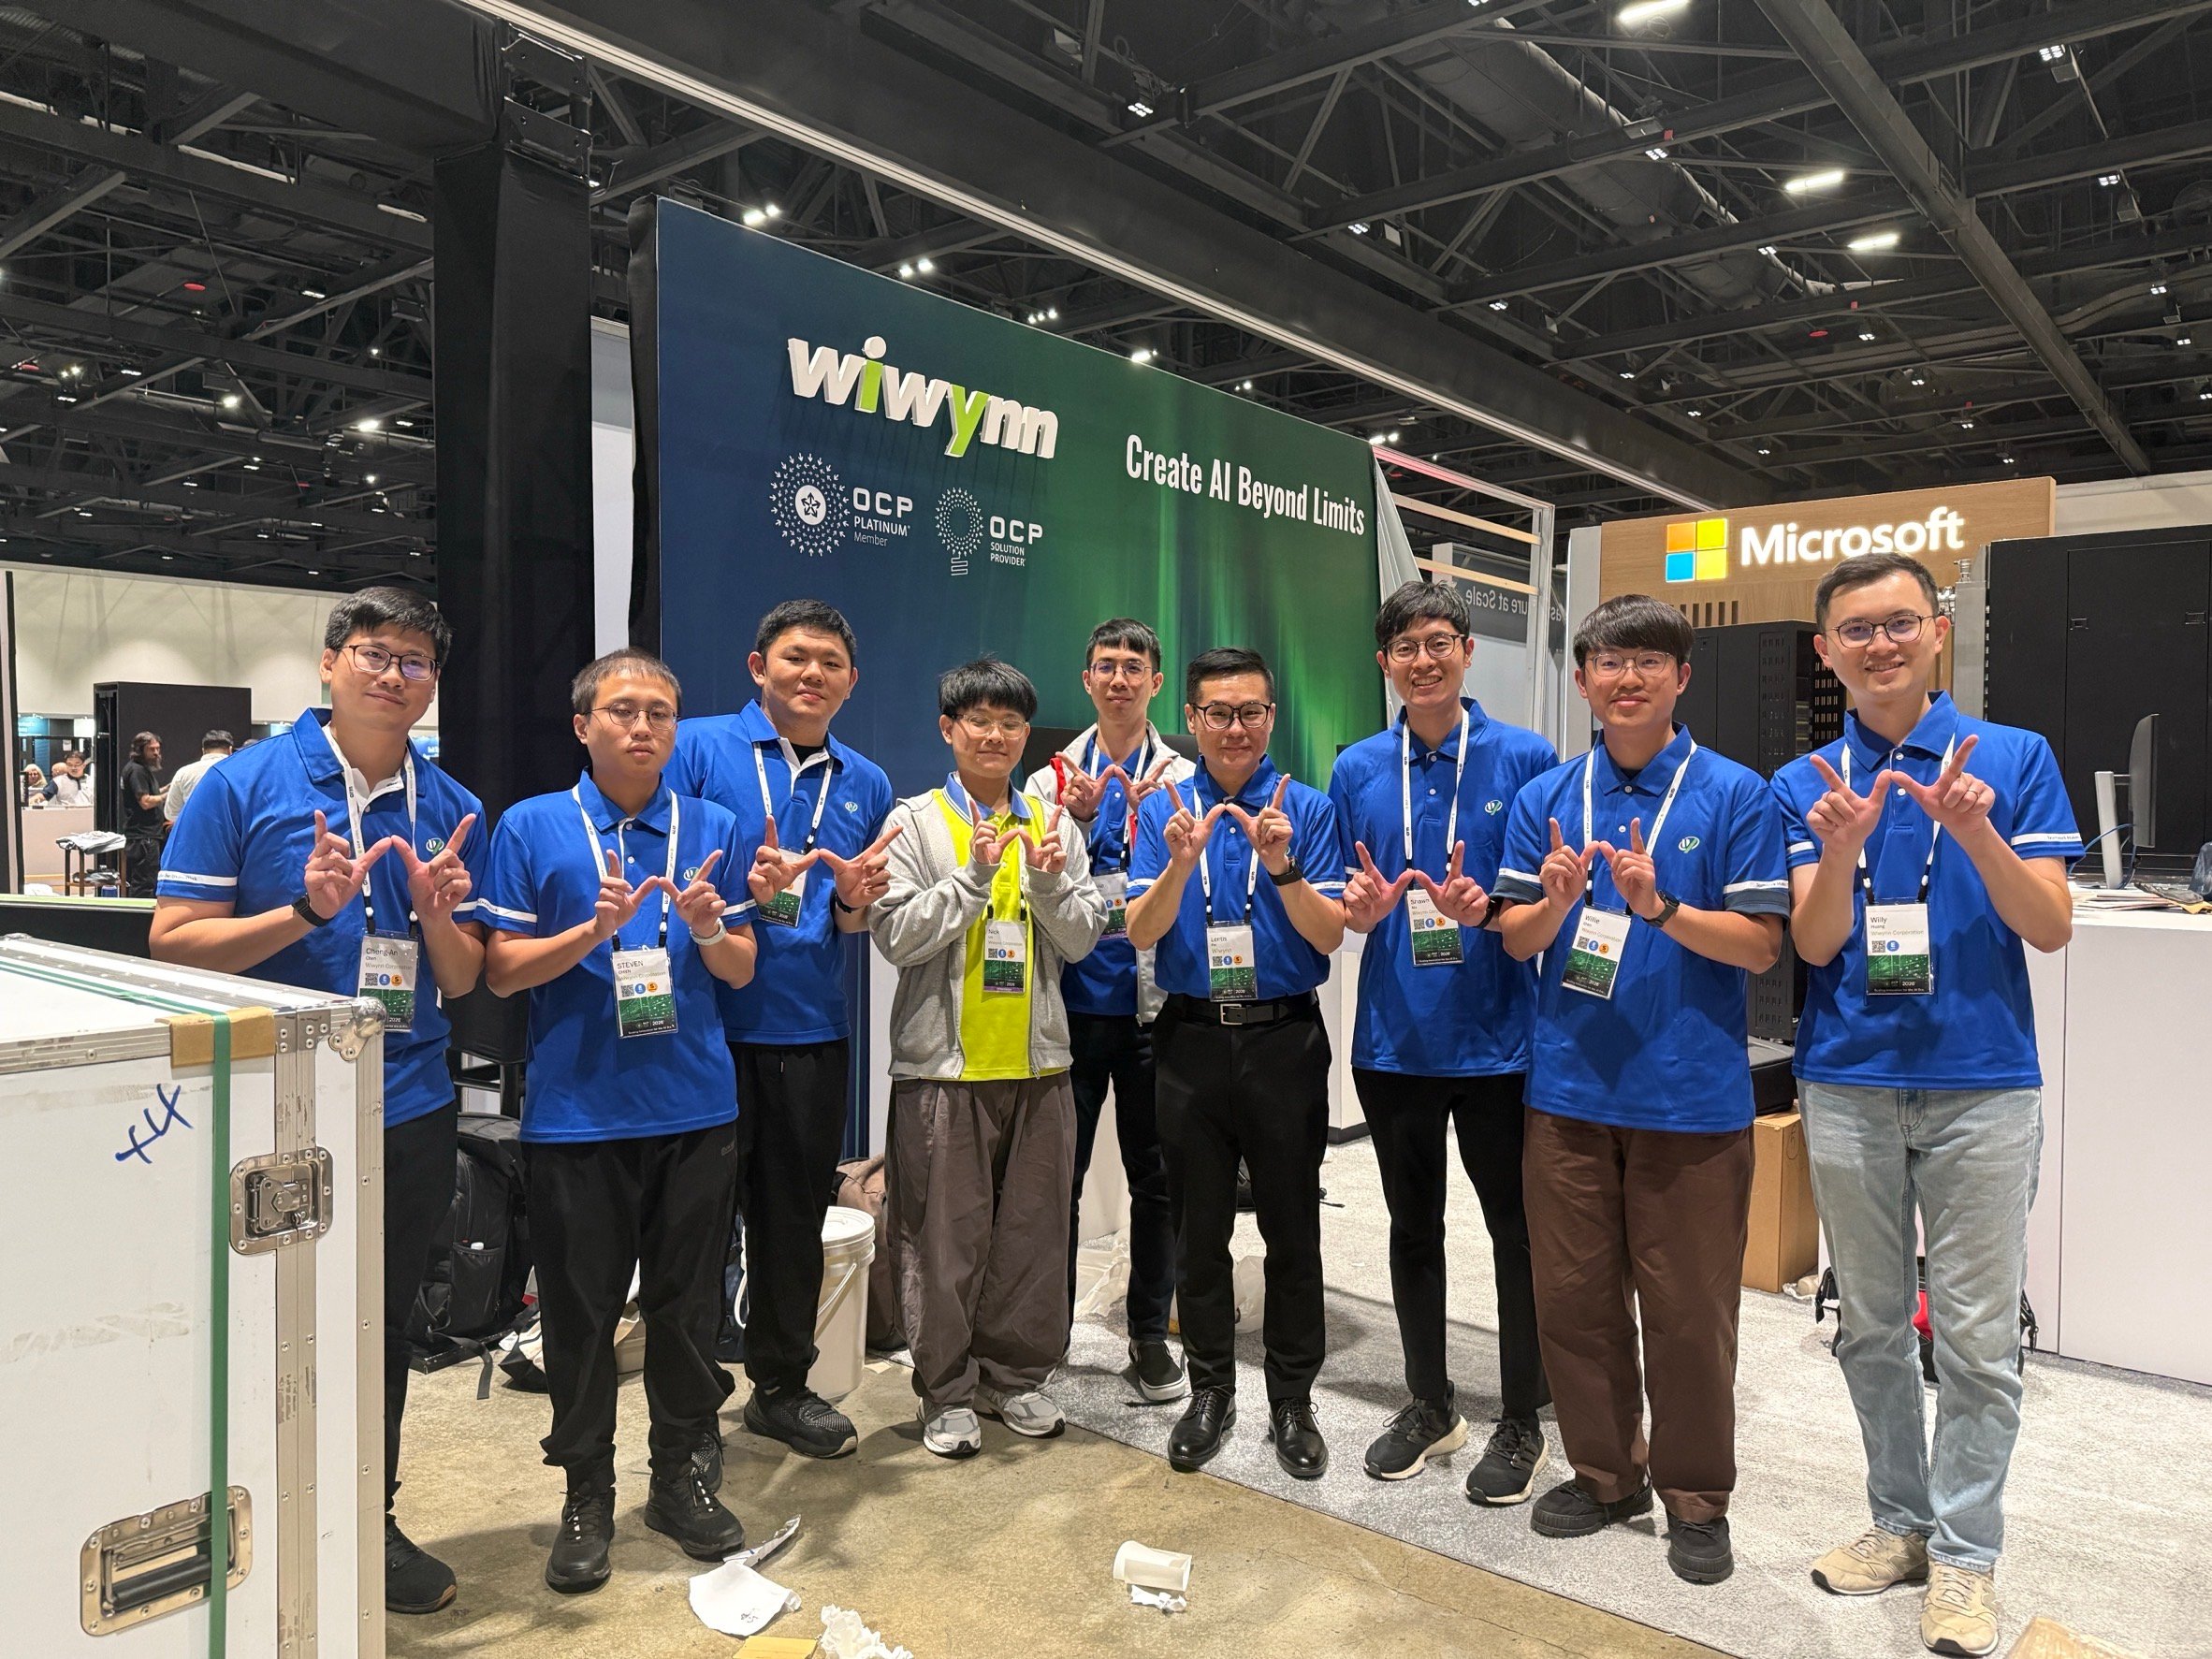
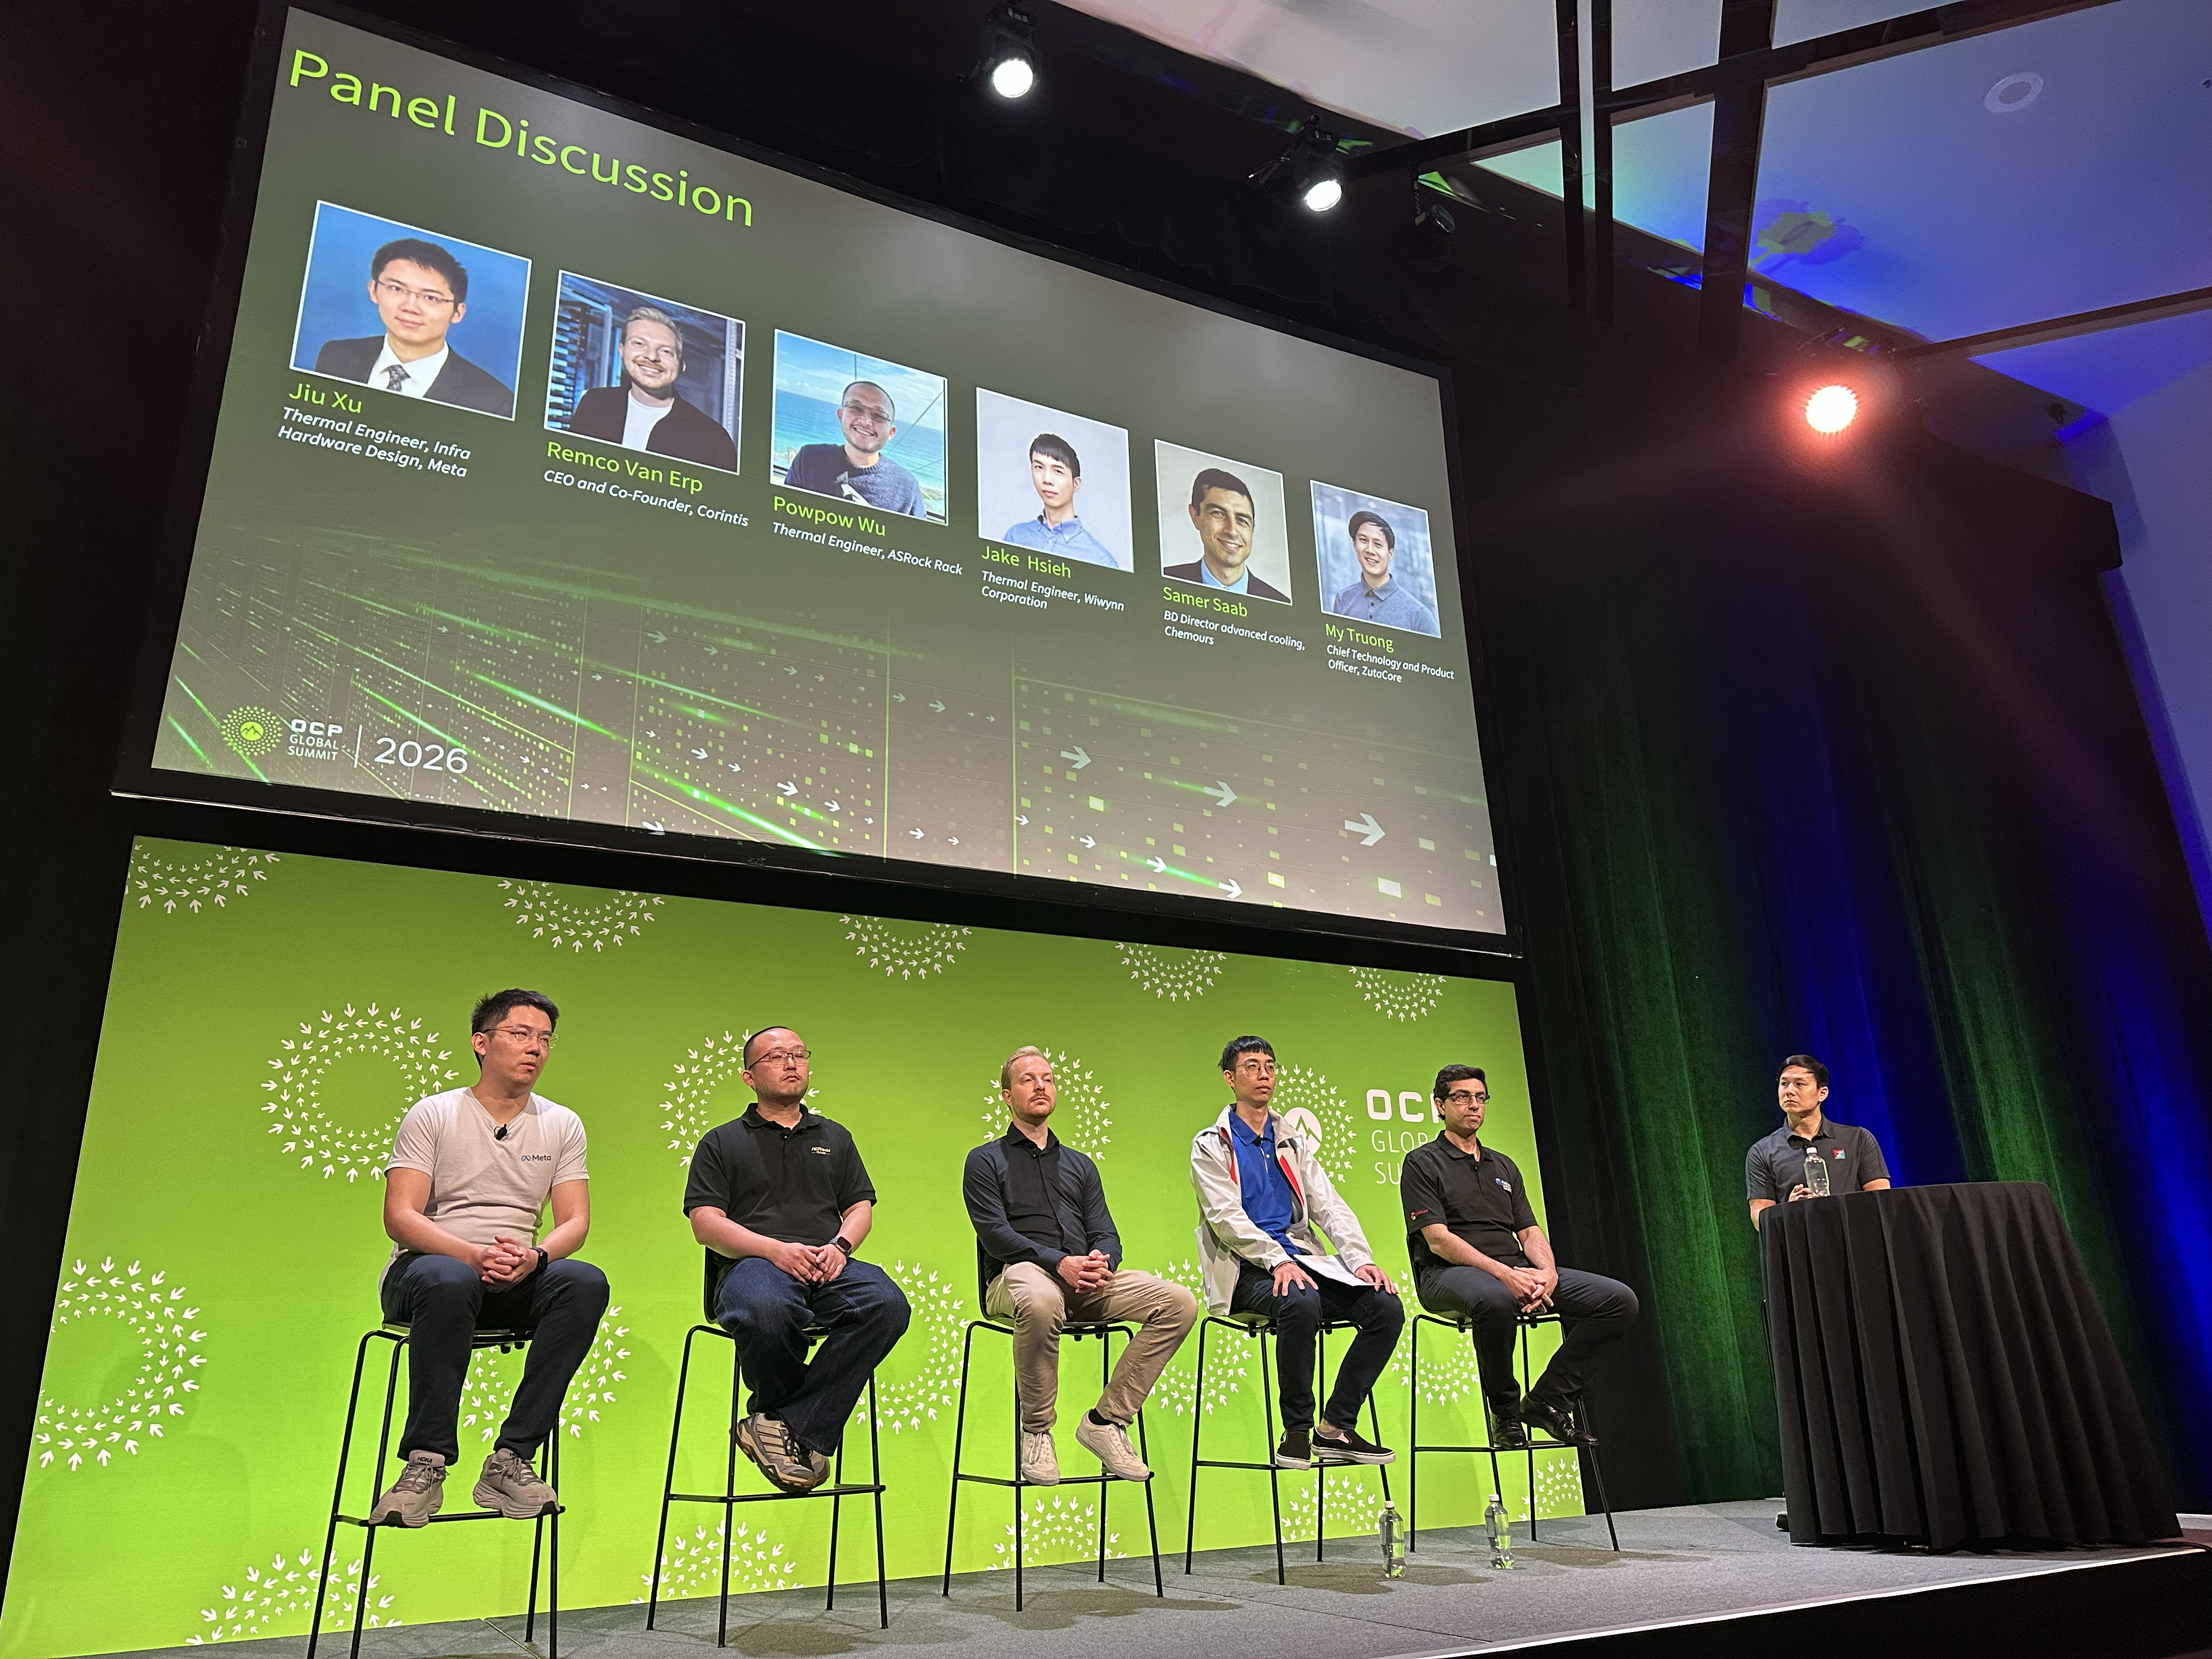






















Prompts
Click prompts to add them under the company line, click again to take one out, then copy the result into your AI chat. Shared by Asian Century Stocks and Uncovered Thai Stocks. Thank you.
Wiwynn Corporation (ticker 6669.TW), listed in Taiwan.
Copied
ETFs Holding Wiwynn Corporation
Exchange-traded funds whose newest published daily portfolio holds one of the company's listings, largest weight first.
| ETF | Weight in ETF | Shares | Market value | As of |
|---|---|---|---|---|
| DGRE | 1.08% | 11,000 | $ 1.6M | Jun 30, 2026 |
| RFEM | 0.61% | 2,881 | $ 480.479K | Jul 31, 2026 |
| DEHP | 0.59% | 50,705 | $ 2.415M | Nov 12, 2026 |
| EMMF | 0.57% | 7,000 | $ 1.018M | Jun 30, 2026 |
| SEEM | 0.47% | 19,400 | $ 2.823M | Jun 30, 2026 |
| DFSE | 0.32% | 38,775 | $ 1.846M | Nov 12, 2026 |
| DFAE | 0.16% | 310,209 | $ 14.772M | Nov 12, 2026 |
| AVSE | 0.13% | 5,965 | $ 270.623K | Nov 16, 2026 |
| DEXC | 0.11% | 5,965 | $ 284.052K | Nov 12, 2026 |
| DFEV | 0.10% | 47,756 | $ 2.274M | Nov 12, 2026 |
| DFEM | 0.08% | 152,122 | $ 7.244M | Nov 12, 2026 |
| DFAX | 0.06% | 155,258 | $ 7.393M | Nov 12, 2026 |
| JSTC | 0.05% | 3,313 | $ 152.365K | Nov 17, 2026 |
| AVEM | 0.03% | 196,864 | $ 8.931M | Nov 16, 2026 |
| AVXC | 0.03% | 2,982 | $ 135.289K | Nov 16, 2026 |