公告本公司董事會通過對關係人之捐贈事宜
Bull 0
Bear 0
Routine
|
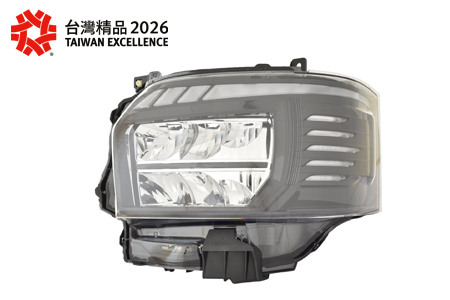
Depo Auto Parts Industrial Co., Ltd. is an automotive parts manufacturer specializing in the production of auto lamps, traffic materials, and traffic facilities. The company operates under the DEPO brand and manufactures headlamps, tail lamps, and LED lighting solutions, including high-end and performance models. Its business segments include the production of auto lamps and traffic materials, with manufacturing facilities located in China and Taiwan. The company serves the aftermarket and OEM sectors, providing products for vehicle customization and replacement. Depo Auto Parts Industrial Co., Ltd. was formerly known as Ming Yang, which started as a wholesaler of auto lamp parts before renaming to DEPO. The company has established subsidiaries such as DEPO Traffic Material (Danyang) Co., Ltd., DEPO Auto Lamp manufacturing (Hefei) Co., Ltd., and DEPO Traffic Facilities (Kunshan) Co., Ltd. It maintains a presence in the United States through a sales office and warehouses, and has received multiple awards for its lighting products, including the Taiwan Excellence Award for various LED and OLED lamp designs. Summarised from the company's own disclosures, fiscal year ended Oct 2026 |
Industry Auto Parts | Homepage depoautolamp.com |
| Sector Consumer Cyclical | IR page depoautolamp.com/investor_en_3.php | |
|
Tags
auto lamps, headlamps, tail lamps, led lighting, traffic materials, traffic facilities, aftermarket, oem, vehicle lighting, DEPO, DEPO Traffic Material (Danyang) Co. Ltd., DEPO Auto Lamp manufacturing (Hefei) Co. Ltd., DEPO Auto Lamp manufacturing (Nanchang) Co. Ltd., Ningbo DEPO Traffic Facilities Co. Ltd., DEPO Traffic Facilities (Hefei) Co. LTD, DEPO Traffic Facilities (Kunshan) Co. Ltd, Jiangsu Chenyang Traffic Material Co. Ltd., Ming Yang Traffic Facilities CO. LTD, Gordon Light Production Plant, Xinying Production Plant, Lukang C.C.P Production Plant
|
Press page — |
Metrics
| Valuation | |
|---|---|
| Market cap | NT$ 21.308B |
| Market cap (USD) | $ 646.733M |
| P/E | 7.59 |
| PEG | 0.87 |
| P/BV | 1.03 |
| P/S | 1.08 |
| P/OCF | 4.27 |
| P/FCF | — |
| Dividend yield | — |
| Turnover / mcap | — |
| Returns | |
|---|---|
| ROE | 11.9% |
| ROI | 11.6% |
| ROIC | 13.1% |
| Profit margin | 11.9% |
| Growth | |
|---|---|
| Revenue growing | No |
| Profits growing | No |
| Revenue up 3y | No |
| Revenue up 5y | No |
| Earnings growth 3y (net profit CAGR) | 8.8% |
| Quality | |
|---|---|
| Profitable | Yes |
| Margin expanding | No |
| Buying back stock | No |
| Diluting (TTM) | No |
| Debt/Equity | — |
| Podcast bulls (TTM) | Sign up |
| Podcast bears (TTM) | Sign up |
| Podcast sentiment (TTM) | Sign up |
| Podcast sentiment % (TTM) | Sign up |
| News sentiment (TTM) | 0 |
| Quality score | 18.8% |
| Insiders | |
|---|---|
| Buys, 1w | Sign up |
| Buys, 1m | Sign up |
| Buys, 1y | Sign up |
| Sells, 1w | Sign up |
| Sells, 1m | Sign up |
| Sells, 1y | Sign up |
Sign up to see this company's insider trades
| Figure | FY 2025 | FY 2024 | FY 2023 | FY 2022 | FY 2021 | FY 2020 | FY 2019 | FY 2018 | FY 2017 | FY 2016 | FY 2015 | FY 2014 | FY 2013 | FY 2012 | FY 2011 | FY 2010 |
|---|---|---|---|---|---|---|---|---|---|---|---|---|---|---|---|---|
| Revenue | 19.413B | 20.156B | 18.553B | 17.173B | 16.131B | 14.26B | 15.59B | 16.203B | 16.113B | 15.787B | 15.069B | 14.712B | 13.639B | 12.624B | 12.027B | 11.422B |
| Net profit | 2.317B | 3.148B | 2.369B | 1.8B | 1.136B | 590.45M | 644.337M | 938.352M | 1.002B | 1.192B | 1.566B | 1.67B | 1.337B | 1.035B | -390.64M | 1.124B |
| Figure | FY 2025 | FY 2024 | FY 2023 | FY 2022 | FY 2021 | FY 2020 | FY 2019 | FY 2018 | FY 2017 | FY 2016 | FY 2015 | FY 2014 | FY 2013 | FY 2012 | FY 2011 | FY 2010 |
|---|---|---|---|---|---|---|---|---|---|---|---|---|---|---|---|---|
| Share price | 139.5 | 214.5 | 147 | 71.7 | 62.8 | 69.8 | — | — | — | — | — | — | — | — | — | — |
| Price performance 12m | -0.35 | 0.46 | 1.05 | 0.14 | -0.1 | — | — | — | — | — | — | — | — | — | — | — |
Sign up to see institutional holdings
Sign UpPodcast Mentions
Sign up to see podcast mentions and sentiment
Sign UpMaterial information published on MOPS, newest first, subjects as filed in Chinese, guarantee and loan balance notices and routine equipment purchases included. The link opens the company's material information on MOPS. Press releases from the company's own website, newest first.









Prompts
Click prompts to add them under the company line, click again to take one out, then copy the result into your AI chat. Shared by Asian Century Stocks and Uncovered Thai Stocks. Thank you.
Depo Auto Parts Industrial Co., Ltd. (ticker 6605.TW), listed in Taiwan.
Copied
ETFs Holding Depo Auto Parts Industrial Co., Ltd.
Exchange-traded funds whose newest published daily portfolio holds one of the company's listings, largest weight first.
| ETF | Weight in ETF | Shares | Market value | As of |
|---|---|---|---|---|
| AVEE | 0.03% | 10,000 | $ 40.137K | Nov 16, 2026 |
| AVES | 0.02% | 74,000 | $ 297.012K | Nov 16, 2026 |
| AVSE | 0.01% | 6,000 | $ 24.082K | Nov 16, 2026 |
| DFEV | 0.01% | 51,150 | $ 205.565K | Nov 12, 2026 |
| DFEM | 0.01% | 170,000 | $ 683.207K | Nov 12, 2026 |
| DFSE | 0.01% | 11,000 | $ 44.208K | Nov 12, 2026 |
| DEXC | 0.01% | 4,000 | $ 16.075K | Nov 12, 2026 |
| DFAE | 0.00% | 67,000 | $ 269.264K | Nov 12, 2026 |
| DFAX | 0.00% | 72,000 | $ 289.358K | Nov 12, 2026 |
| AVEM | 0.00% | 260,000 | $ 1.044M | Nov 16, 2026 |
| AVXC | 0.00% | 5,000 | $ 20.068K | Nov 16, 2026 |